| Corporate Presentation NOVEMBER 12, 2025 |

| CORPORATE PRESENTATION, NOVEMBER 12, 2025 | 2 THIS OPERATING AND FINANCIAL DATA SHOULD BE READ IN CONNECTION W I T H O U R Q U A RT E R LY R E P O RT O N F O R M 10-Q F O R T H E Q U A RT E R E N D E D SEPTEMBER 30, 2025. Statements made in this presentation may be forward-looking statements within the mean - ing of Section 21E of the Securities Exchange Act of 1934, as amended. Such forward-look - ing statements are intended to be covered by the safe harbor provisions for forward-looking statements contained in Section 21E of such act. Such forward-looking statements relate to, without limitation, our future economic performance, plans and objectives for future operations and projections of revenue and other financial items. Forward-looking statements can be iden - tified by the use of words such as “may,” “will,” “plan,” “potential,” “projected,” “should,” “ex - pect,” “anticipate,” “estimate,” “target,” “continue” or comparable terminology. Forward-looking statements are inherently subject to certain risks, trends and uncertainties, many of which we cannot predict with accuracy and some of which we might not even anticipate. Although we believe that the expectations reflected in such forward-looking statements are based upon reasonable assumptions at the time made, we can give no assurance that such expectations will be achieved. Future events and actual results, financial and otherwise, may differ materi - ally from the results discussed in the forward-looking statements. Readers are cautioned not to place undue reliance on these forward-looking statements and are advised to consider the factors listed above together with the additional factors under the heading “Disclosure Regard - ing Forward-Looking Statements” and “Risk Factors” in our annual reports on Form 10-K, as may be supplemented or amended by our quarterly reports on Form 10-Q, which are incorpo - rated herein by reference. We assume no obligation to update or supplement forward-looking statements that become untrue because of subsequent events, new information or otherwise. Forward-Looking Statements |
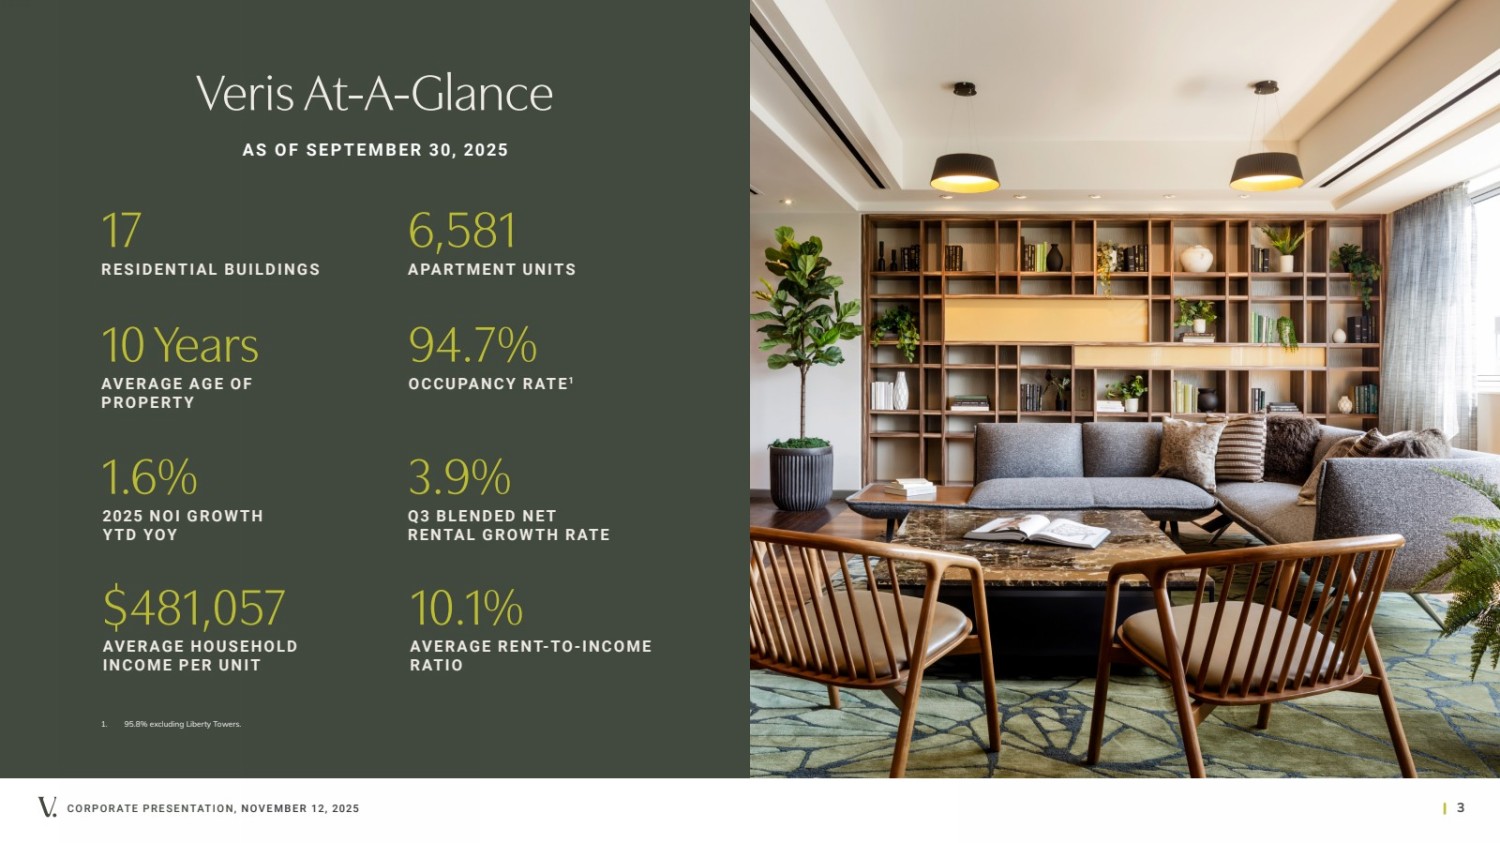
| Veris At-A-Glance CORPORATE PRESENTATION, NOVEMBER 12, 2025 | 3 94.7% OCCUPANCY RATE 1 $481,057 3.9% AVERAGE HOUSEHOLD INCOME PER UNIT Q3 B L E N D E D N E T RENTAL GROWTH RATE 10 Years 6,581 AVERAGE AGE OF PROPERTY APARTMENT UNITS 1.6% 17 RESIDENTIAL BUILDINGS 10.1% AV E R A G E R E N T-TO-I N C O M E RATIO 2025 NOI GROWTH YTD YOY AS OF SEPTEMBER 30, 2025 1. 95.8% excluding Liberty Towers. |
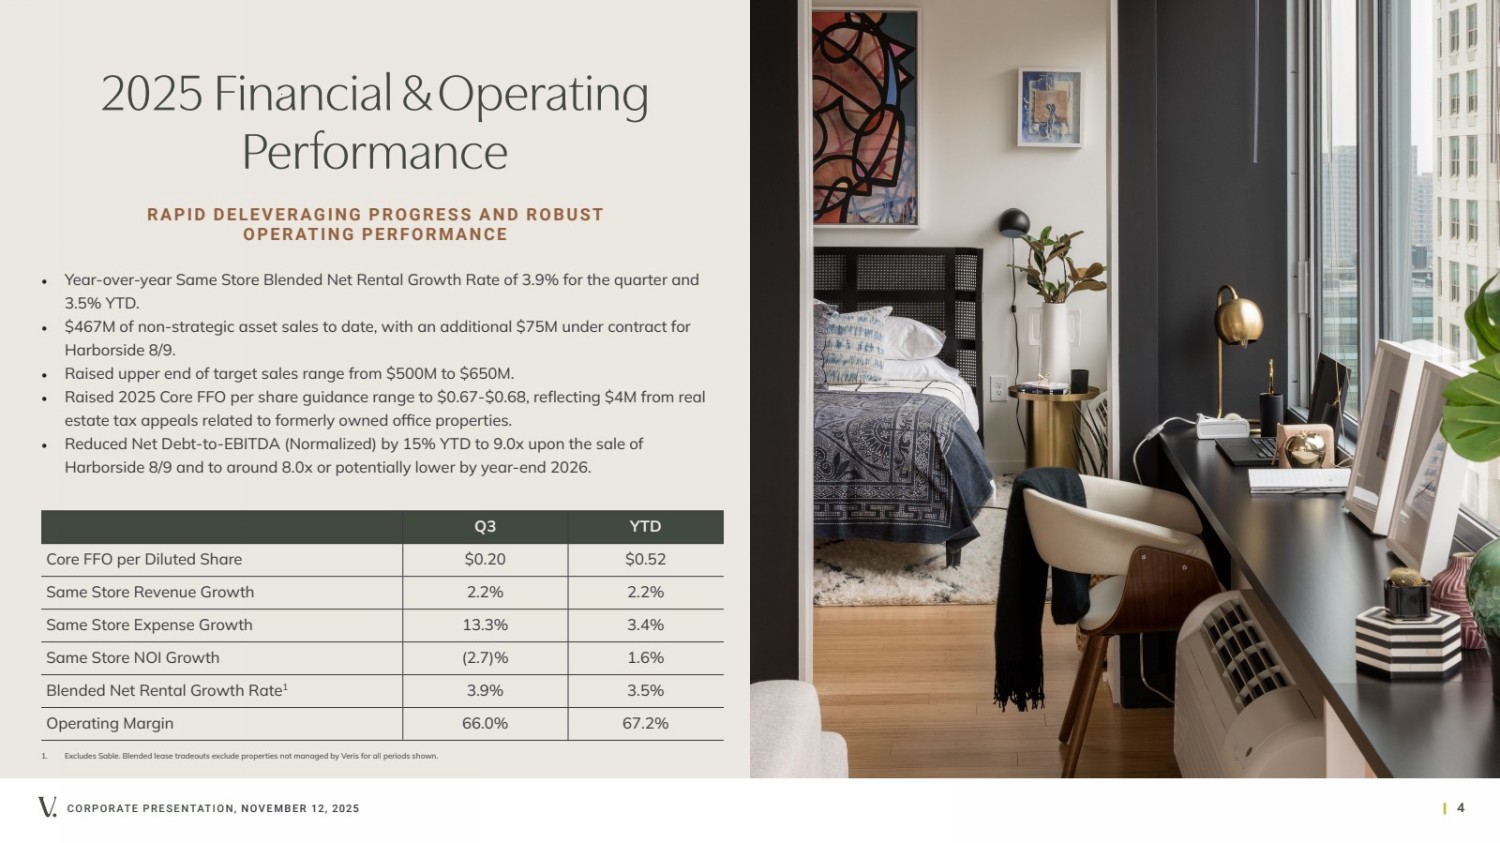
| CORPORATE PRESENTATION, NOVEMBER 12, 2025 | 4 2025 Financial & Operating Performance • Year-over-year Same Store Blended Net Rental Growth Rate of 3.9% for the quarter and 3.5% YTD. • $467M of non-strategic asset sales to date, with an additional $75M under contract for Harborside 8/9. • Raised upper end of target sales range from $500M to $650M. • Raised 2025 Core FFO per share guidance range to $0.67-$0.68, reflecting $4M from real estate tax appeals related to formerly owned office properties. • Reduced Net Debt-to-EBITDA (Normalized) by 15% YTD to 9.0x upon the sale of Harborside 8/9 and to around 8.0x or potentially lower by year-end 2026. Q3 YTD Core FFO per Diluted Share $0.20 $0.52 Same Store Revenue Growth 2.2% 2.2% Same Store Expense Growth 13.3% 3.4% Same Store NOI Growth (2.7)% 1.6% Blended Net Rental Growth Rate 1 3.9% 3.5% Operating Margin 66.0% 67.2% RAPID DELEVERAGING PROGRESS AND ROBUST OPERATING PERFORMANCE 1. Excludes Sable. Blended lease tradeouts exclude properties not managed by Veris for all periods shown. |
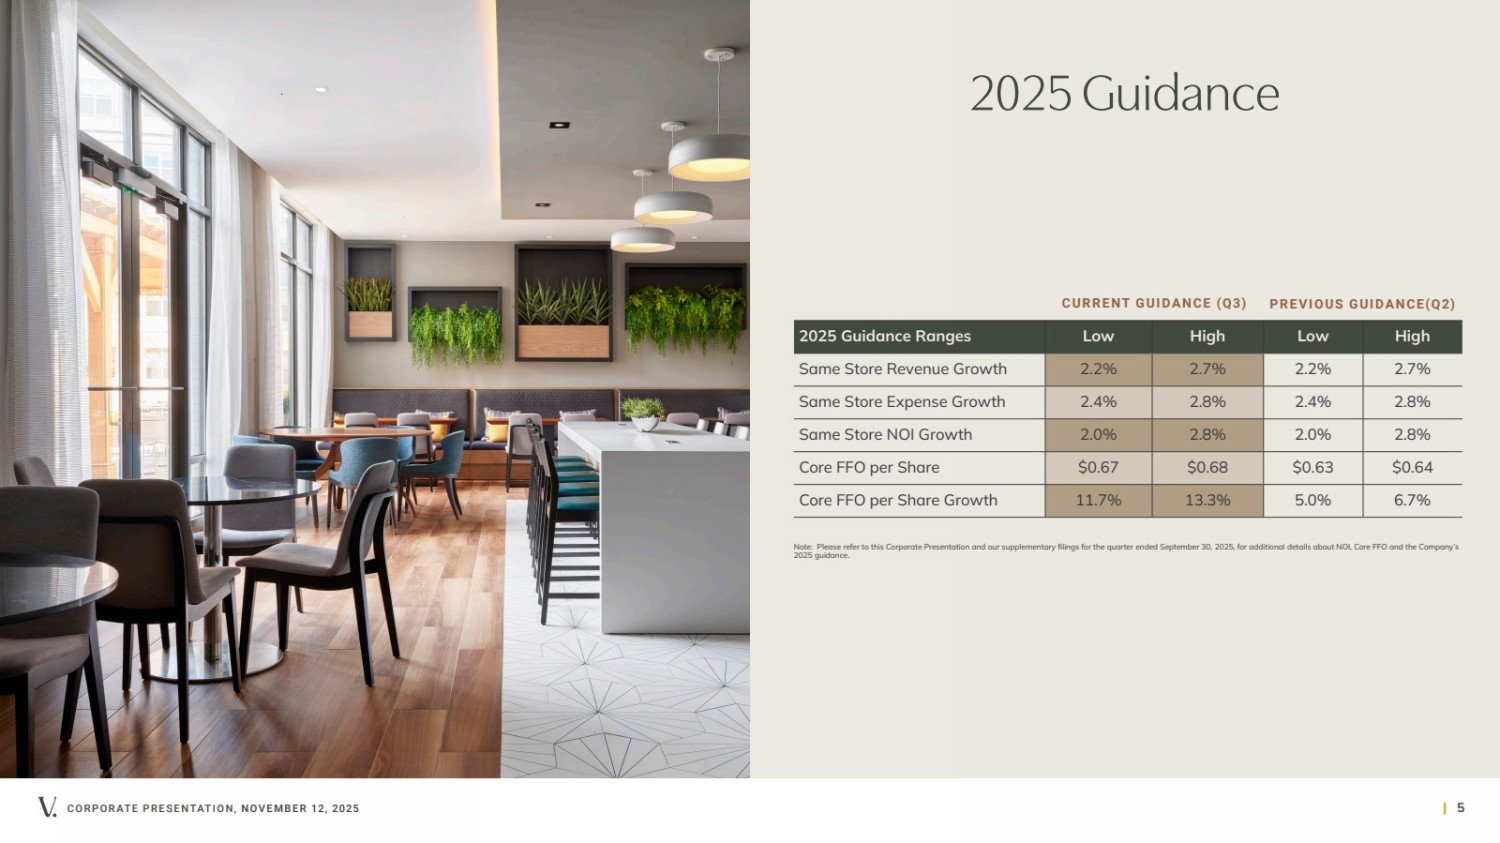
| CORPORATE PRESENTATION, NOVEMBER 12, 2025 | 5 2025 Guidance 2025 Guidance Ranges Low High Low High Same Store Revenue Growth 2.2% 2.7% 2.2% 2.7% Same Store Expense Growth 2.4% 2.8% 2.4% 2.8% Same Store NOI Growth 2.0% 2.8% 2.0% 2.8% Core FFO per Share $0.67 $0.68 $0.63 $0.64 Core FFO per Share Growth 11.7% 13.3% 5.0% 6.7% Note: Please refer to this Corporate Presentation and our supplementary filings for the quarter ended September 30, 2025, for additional details about NOI, Core FFO and the Company’s 2025 guidance. CURRENT GUIDANCE (Q3) PREVIOUS GUIDANCE(Q2) |
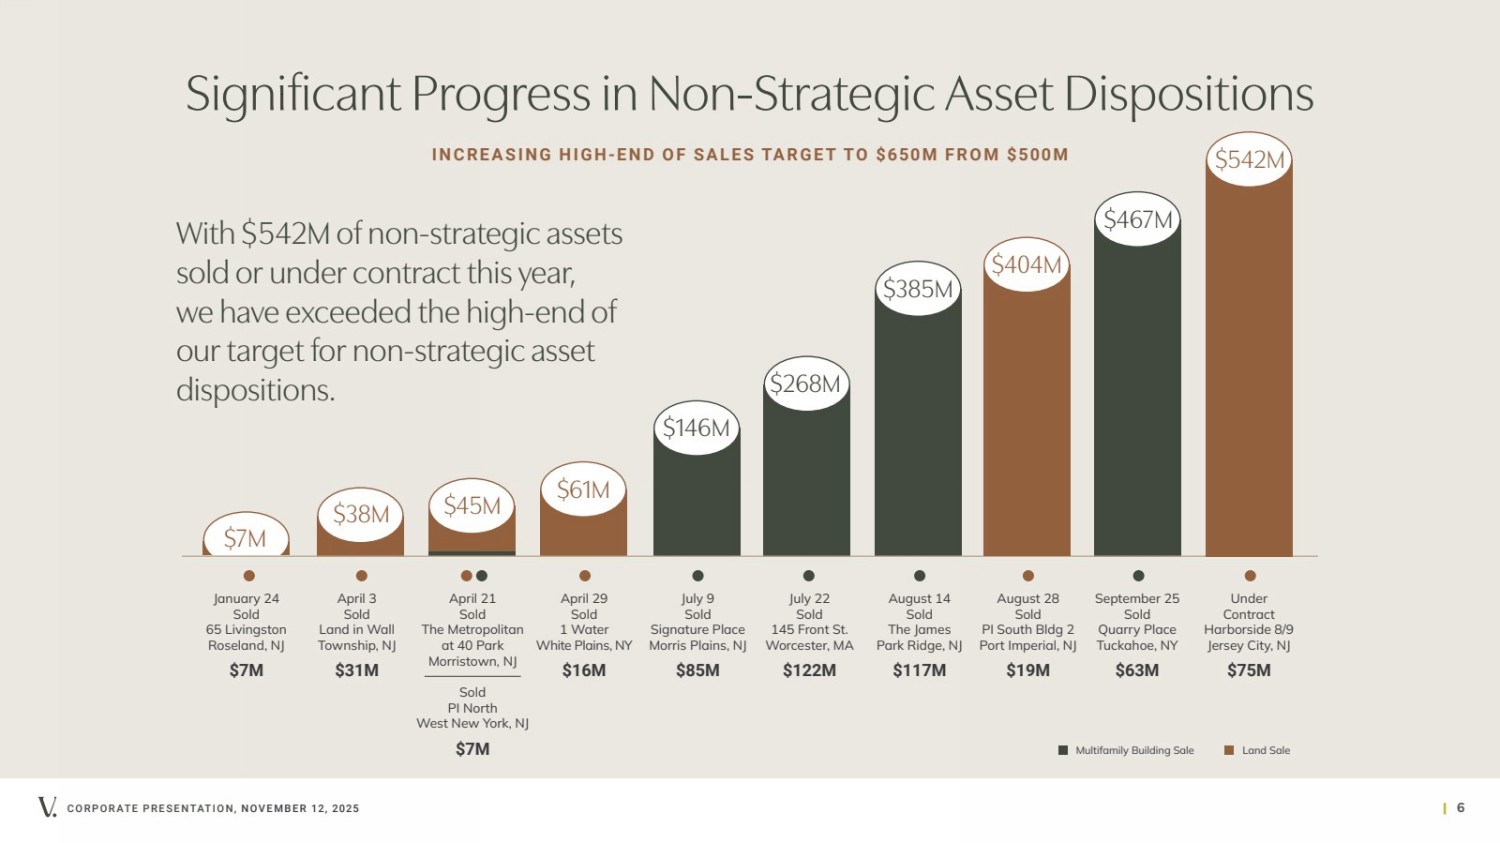
| With $542M of non-strategic assets sold or under contract this year, we have exceeded the high-end of our target for non-strategic asset dispositions. $38M $45M $61M $146M $268M $385M $467M January 24 Sold 65 Livingston Roseland, NJ $7M April 21 Sold The Metropolitan at 40 Park Morristown, NJ Sold PI North West New York, NJ $7M April 29 Sold 1 Water White Plains, NY $16M July 9 Sold Signature Place Morris Plains, NJ $85M July 22 Sold 145 Front St. Worcester, MA $122M August 14 Sold The James Park Ridge, NJ $117M April 3 Sold Land in Wall Township, NJ $31M September 25 Sold Quarry Place Tuckahoe, NY $63M Multifamily Building Sale $7M Land Sale $404M August 28 Sold PI South Bldg 2 Port Imperial, NJ $19M $542M Under Contract Harborside 8/9 Jersey City, NJ $75M CORPORATE PRESENTATION, NOVEMBER 12, 2025 | 6 Significant Progress in Non-Strategic Asset Dispositions INCREASING HIGH-END OF SALES TARGET TO $650M FROM $500M |
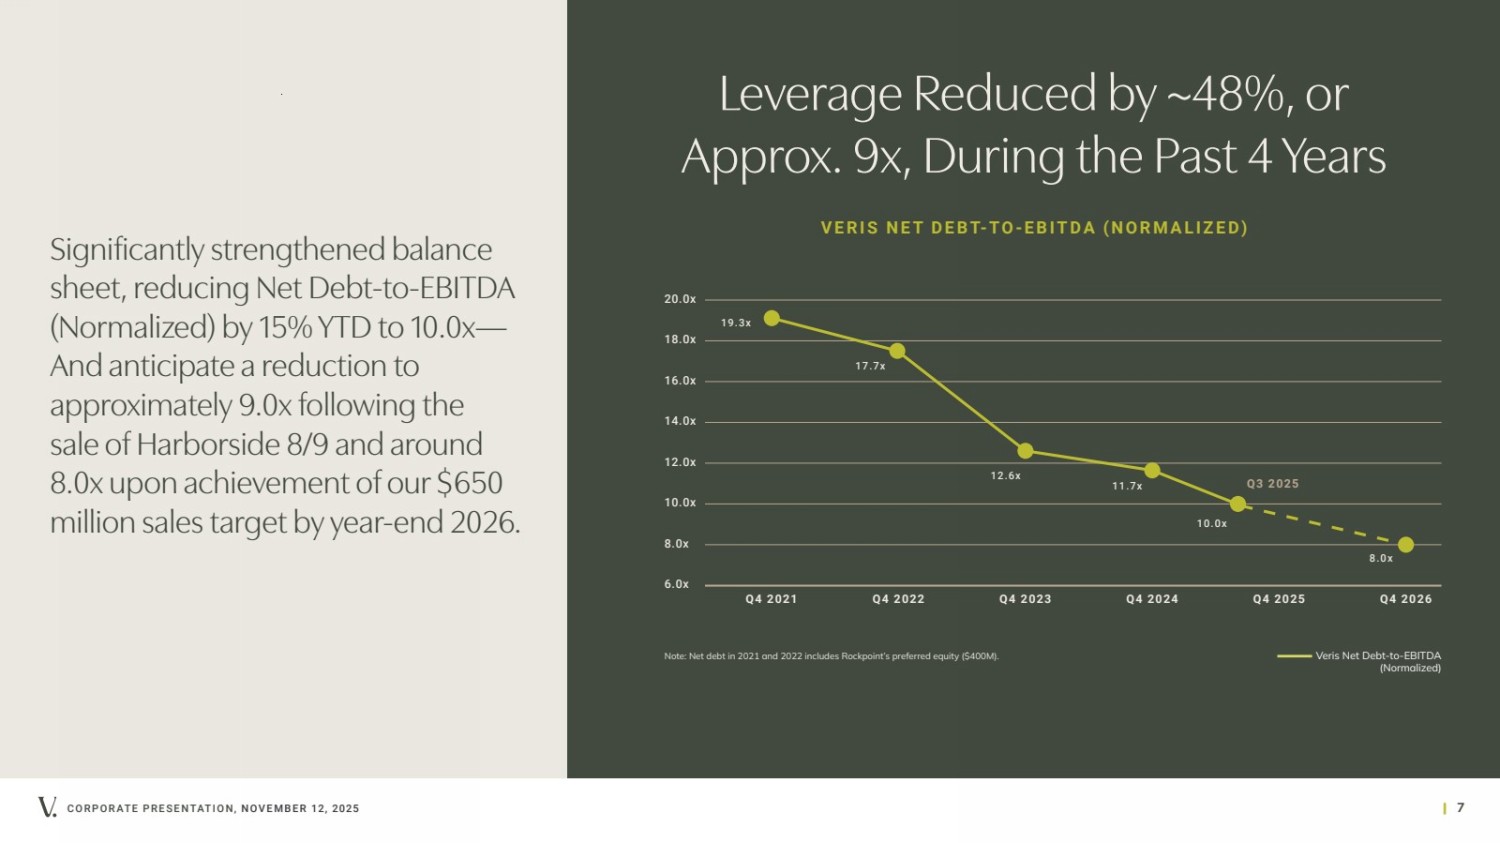
| Significantly strengthened balance sheet, reducing Net Debt-to-EBITDA (Normalized) by 15% YTD to 10.0x— And anticipate a reduction to approximately 9.0x following the sale of Harborside 8/9 and around 8.0x upon achievement of our $650 million sales target by year-end 2026. CORPORATE PRESENTATION, NOVEMBER 12, 2025 | 7 Leverage Reduced by ~48%, or Approx. 9x, During the Past 4 Years V E R I S N E T D E B T- T O - E B I T D A ( N O R M A L I Z E D ) Note: Net debt in 2021 and 2022 includes Rockpoint’s preferred equity ($400M). 6.0x 8.0x 10.0x 12.0x 14.0x 16.0x 18.0x 20.0x 19.3x 17.7x 12.6x 11.7x 10.0x 8.0x Q4 2021 Q4 2022 Q4 2023 Q4 2024 Q4 2025 Q3 2025 Q4 2026 Veris Net Debt-to-EBITDA (Normalized) |
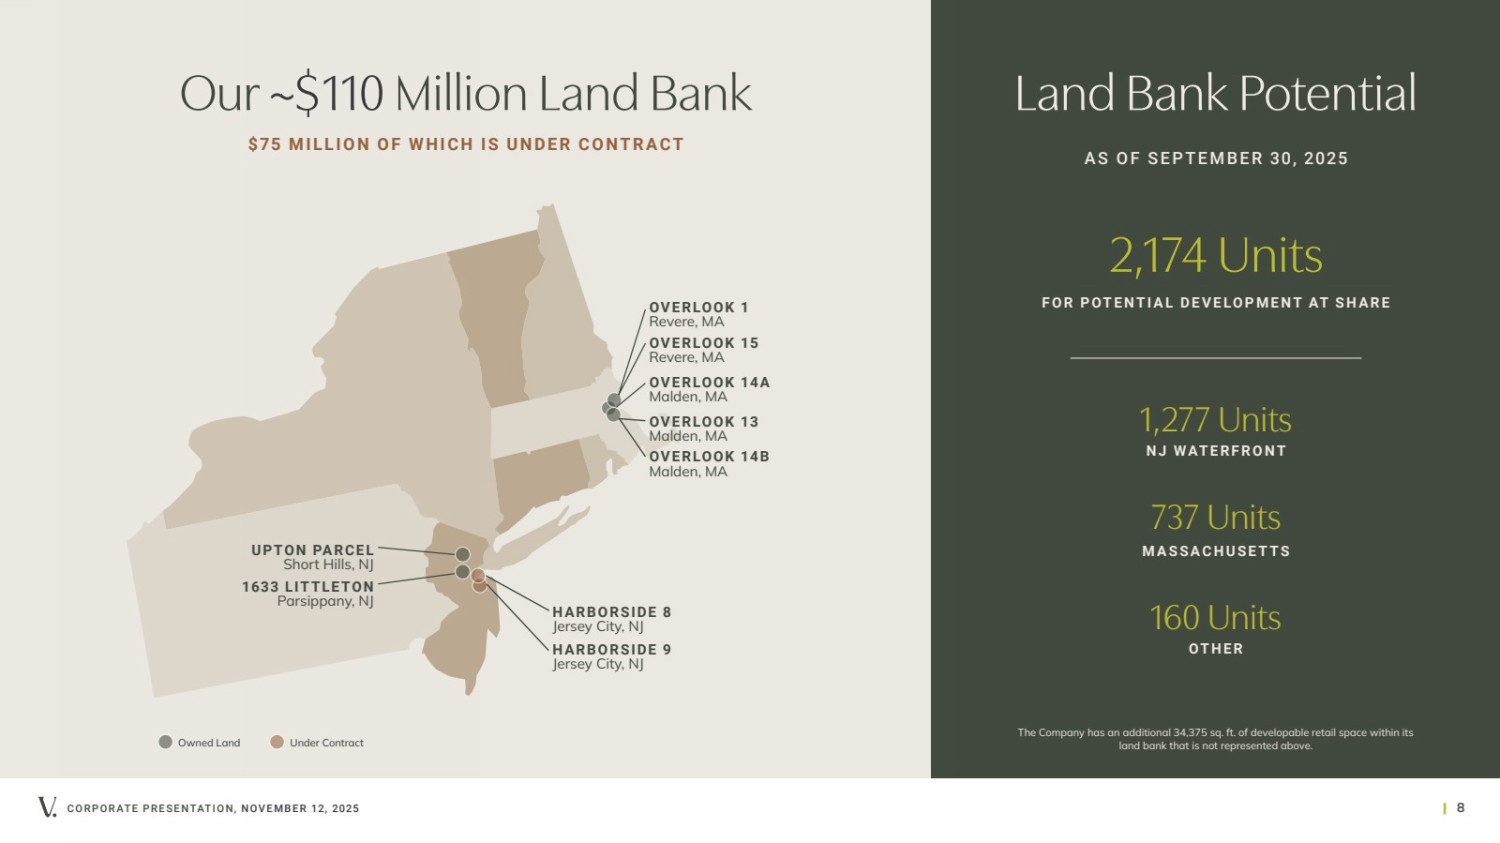
| Owned Land Under Contract CORPORATE PRESENTATION, NOVEMBER 12, 2025 | 8 Land Bank Potential HARBORSIDE 8 Jersey City, NJ 2,174 Units FOR POTENTIAL DEVELOPMENT AT SHARE 1,277 Units NJ WATERFRONT 737 Units MASSACHUSETTS 1633 LITTLETON Parsippany, NJ UPTON PARCEL Short Hills, NJ OVERLOOK 1 Revere, MA OVERLOOK 15 Revere, MA OVERLOOK 14A Malden, MA OVERLOOK 13 Malden, MA OVERLOOK 14B Malden, MA HARBORSIDE 9 Jersey City, NJ The Company has an additional 34,375 sq. ft. of developable retail space within its land bank that is not represented above. Our ~$110 Million Land Bank AS OF SEPTEMBER 30, 2025 160 Units OTHER $75 MILLION OF WHICH IS UNDER CONTRACT |
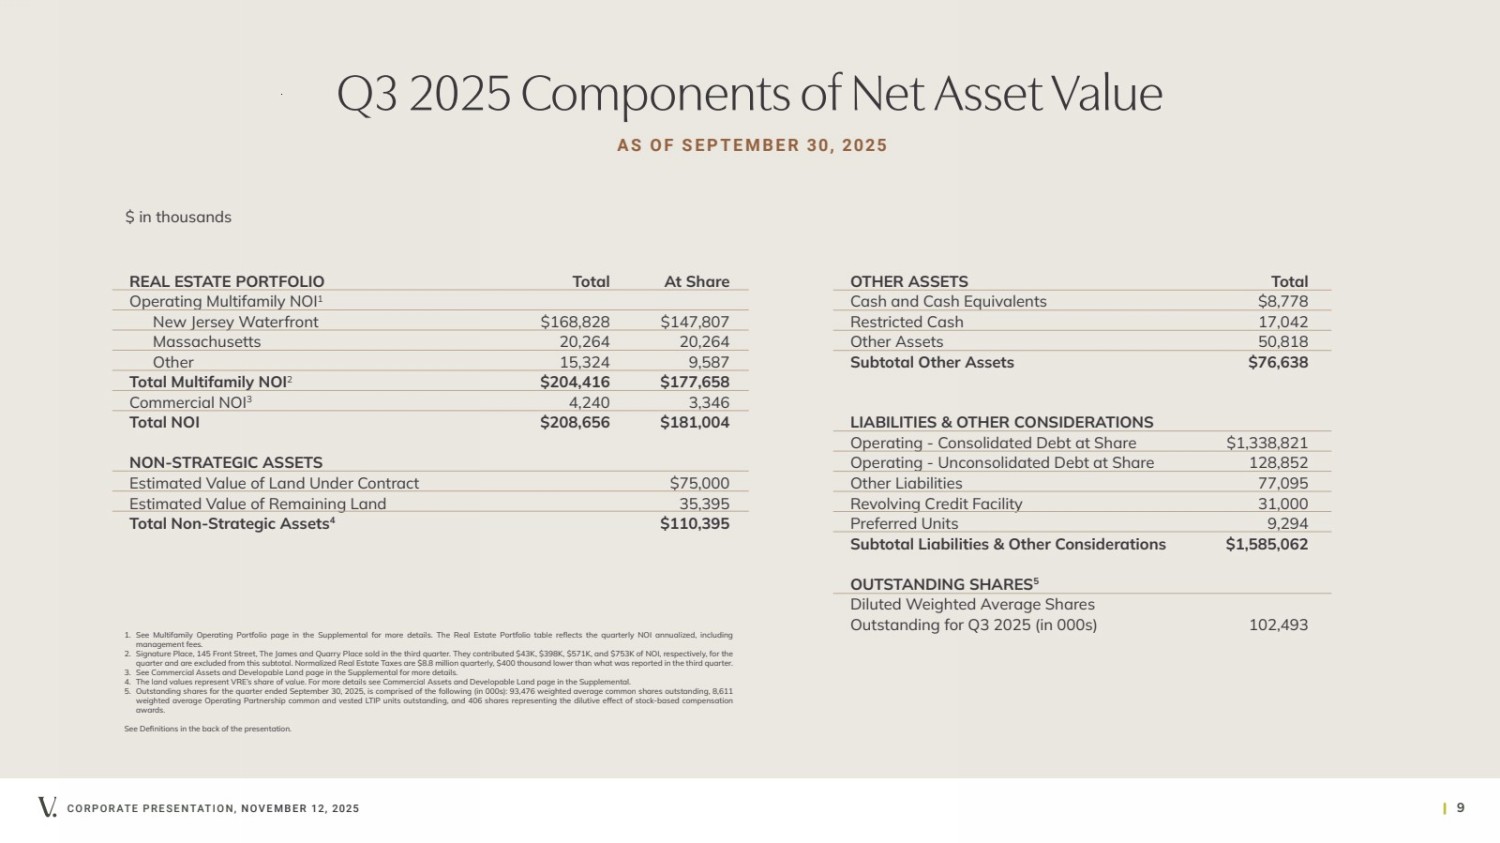
| CORPORATE PRESENTATION, NOVEMBER 12, 2025 | 9 Q3 2025 Components of Net Asset Value REAL ESTATE PORTFOLIO Total At Share Operating Multifamily NOI1 New Jersey Waterfront $168,828 $147,807 Massachusetts 20,264 20,264 Other 15,324 9,587 Total Multifamily NOI2 $204,416 $177,658 Commercial NOI3 4,240 3,346 Total NOI $208,656 $181,004 NON-STRATEGIC ASSETS Estimated Value of Land Under Contract $75,000 Estimated Value of Remaining Land 35,395 Total Non-Strategic Assets4 $110,395 OTHER ASSETS Total Cash and Cash Equivalents $8,778 Restricted Cash 17,042 Other Assets 50,818 Subtotal Other Assets $76,638 LIABILITIES & OTHER CONSIDERATIONS Operating - Consolidated Debt at Share $1,338,821 Operating - Unconsolidated Debt at Share 128,852 Other Liabilities 77,095 Revolving Credit Facility 31,000 Preferred Units 9,294 Subtotal Liabilities & Other Considerations $1,585,062 OUTSTANDING SHARES5 Diluted Weighted Average Shares Outstanding for Q3 2025 (in 000s) 102,493 1. See Multifamily Operating Portfolio page in the Supplemental for more details. The Real Estate Portfolio table reflects the quarterly NOI annualized, including management fees. 2. Signature Place, 145 Front Street, The James and Quarry Place sold in the third quarter. They contributed $43K, $398K, $571K, and $753K of NOI, respectively, for the quarter and are excluded from this subtotal. Normalized Real Estate Taxes are $8.8 million quarterly, $400 thousand lower than what was reported in the third quarter. 3. See Commercial Assets and Developable Land page in the Supplemental for more details. 4. The land values represent VRE’s share of value. For more details see Commercial Assets and Developable Land page in the Supplemental. 5. Outstanding shares for the quarter ended September 30, 2025, is comprised of the following (in 000s): 93,476 weighted average common shares outstanding, 8,611 weighted average Operating Partnership common and vested LTIP units outstanding, and 406 shares representing the dilutive effect of stock-based compensation awards. See Definitions in the back of the presentation. $ in thousands AS OF SEPTEMBER 30, 2025 |
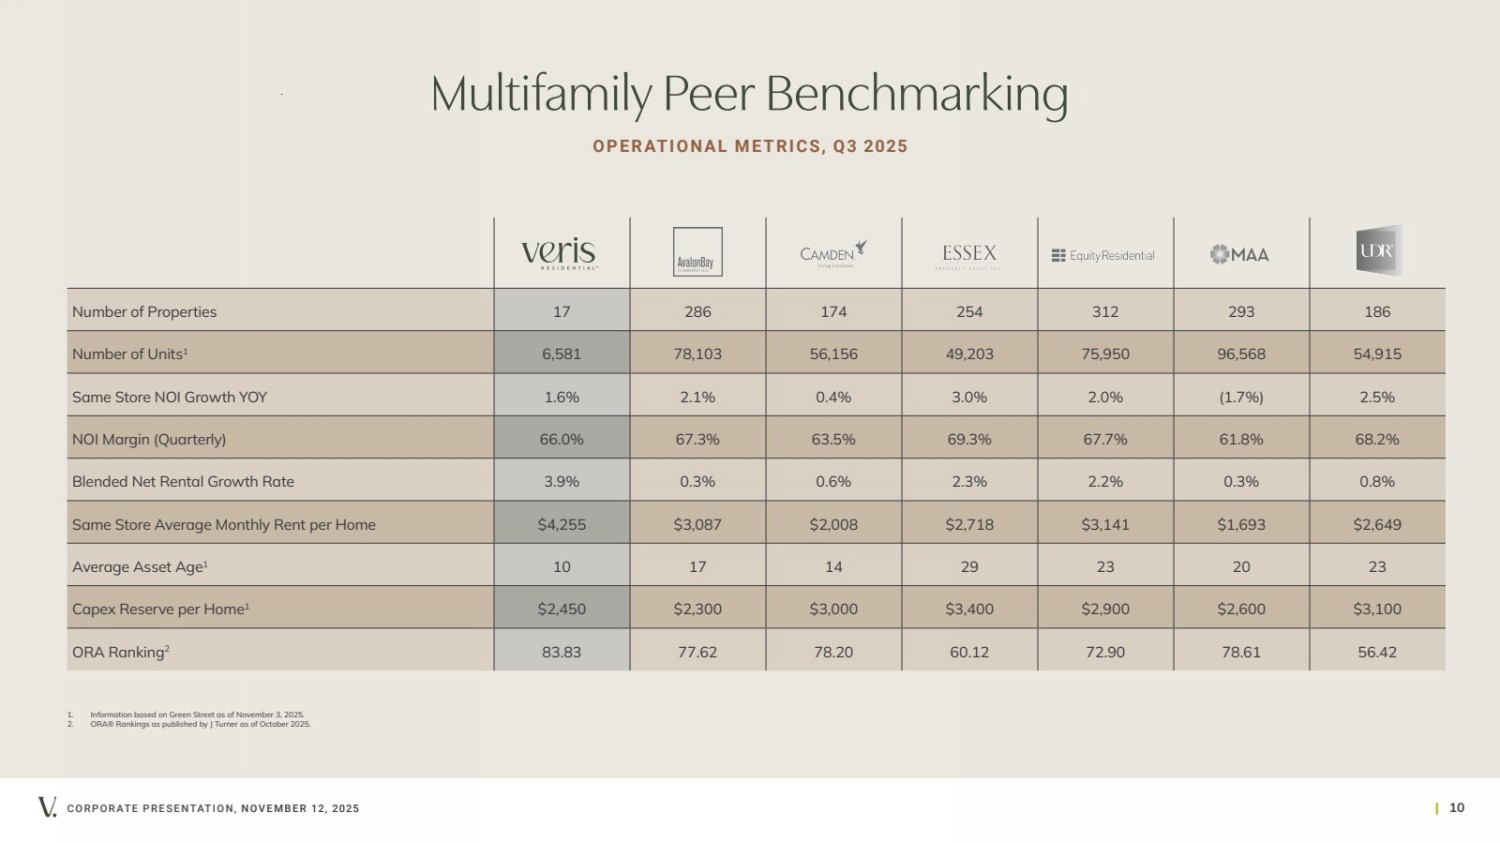
| CORPORATE PRESENTATION, NOVEMBER 12, 2025 | 10 Multifamily Peer Benchmarking OPERATIONAL METRICS, Q3 2025 Number of Properties 17 286 174 254 312 293 186 Number of Units1 6,581 78,103 56,156 49,203 75,950 96,568 54,915 Same Store NOI Growth YOY 1.6% 2.1% 0.4% 3.0% 2.0% (1.7%) 2.5% NOI Margin (Quarterly) 66.0% 67.3% 63.5% 69.3% 67.7% 61.8% 68.2% Blended Net Rental Growth Rate 3.9% 0.3% 0.6% 2.3% 2.2% 0.3% 0.8% Same Store Average Monthly Rent per Home $4,255 $3,087 $2,008 $2,718 $3,141 $1,693 $2,649 Average Asset Age1 10 17 14 29 23 20 23 Capex Reserve per Home1 $2,450 $2,300 $3,000 $3,400 $2,900 $2,600 $3,100 ORA Ranking2 83.83 77.62 78.20 60.12 72.90 78.61 56.42 1. Information based on Green Street as of November 3, 2025. 2. ORA® Rankings as published by J Turner as of October 2025. |
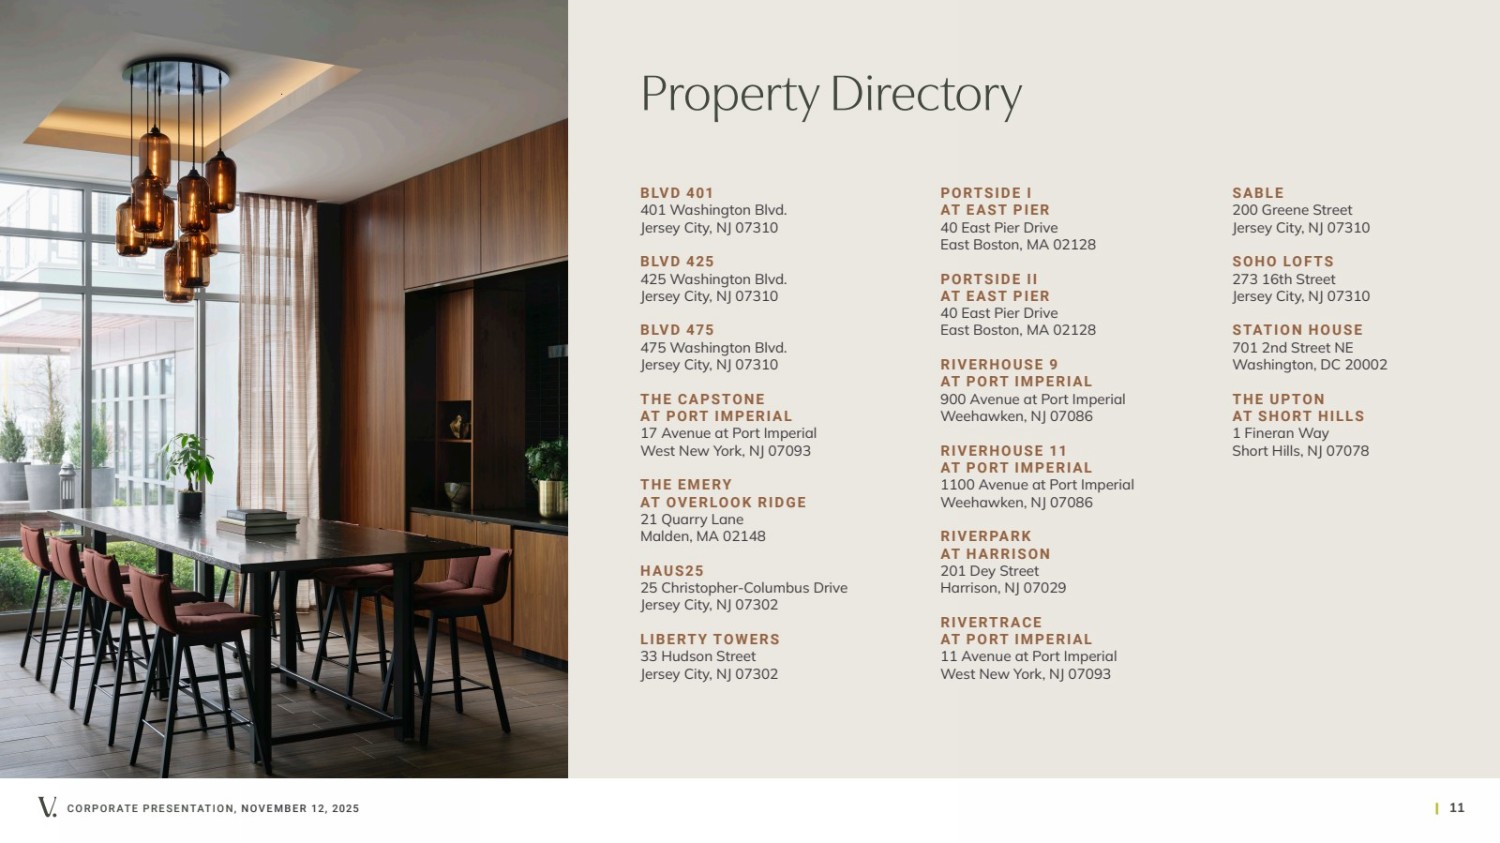
| CORPORATE PRESENTATION, NOVEMBER 12, 2025 | 11 Property Directory BLVD 401 401 Washington Blvd. Jersey City, NJ 07310 BLVD 425 425 Washington Blvd. Jersey City, NJ 07310 BLVD 475 475 Washington Blvd. Jersey City, NJ 07310 THE CAPSTONE AT PORT IMPERIAL 17 Avenue at Port Imperial West New York, NJ 07093 THE EMERY AT OVERLOOK RIDGE 21 Quarry Lane Malden, MA 02148 HAUS25 25 Christopher-Columbus Drive Jersey City, NJ 07302 LIBERTY TOWERS 33 Hudson Street Jersey City, NJ 07302 PORTSIDE I AT EAST PIER 40 East Pier Drive East Boston, MA 02128 PORTSIDE II AT EAST PIER 40 East Pier Drive East Boston, MA 02128 R I V E R H O U S E 9 AT PORT IMPERIAL 900 Avenue at Port Imperial Weehawken, NJ 07086 RIVERHOUSE 11 AT PORT IMPERIAL 1100 Avenue at Port Imperial Weehawken, NJ 07086 RIVERPARK AT HARRISON 201 Dey Street Harrison, NJ 07029 RIVERTRACE AT PORT IMPERIAL 11 Avenue at Port Imperial West New York, NJ 07093 SABLE 200 Greene Street Jersey City, NJ 07310 SOHO LOFTS 273 16th Street Jersey City, NJ 07310 STATION HOUSE 701 2nd Street NE Washington, DC 20002 THE UPTON AT SHORT HILLS 1 Fineran Way Short Hills, NJ 07078 |
| CORPORATE PRESENTATION, NOVEMBER 12, 2025 | 12 Definitions AV E R A G E E F F E CT I V E M O N T H LY R E N T P E R H O M E represents the average effective rent (net of concessions) for in-place leases and the market rent for vacant homes. BLENDED NET RENTAL GROWTH RATE combines new lease and renewal lease growth rates. New lease growth rate refers to the difference in rent a new occupant of a unit is paying compared to the rent the unit’s previous occupant was paying on a net effective basis. Renewal lease growth rate refers to the increase or decrease in monthly rent in a renewed lease compared to the previous lease on a net effective basis. CORE FFO AND ADJUSTED FFO (“AFFO”) Core FFO is defined as FFO, as adjusted for certain items to facilitate comparative measurement of the Company’s performance over time. Core FFO is presented solely as supplemental disclosure that the Company’s management believes provides useful information to investors and analysts of its results, after adjusting for certain items to facilitate comparability of its performance from period to period. Core FFO is a non-GAAP financial measure that is not intended to represent cash flow and is not indicative of cash flows provided by operating activities as determined in accordance with GAAP. As there is not a generally accepted definition established for Core FFO, the Company’s Core FFO may not be comparable to the Core FFO reported by other REITs. A reconciliation of net income per share to Core FFO and Adjusted FFO in dollars and per share are included in the financial tables accompanying our quarterly and annual filings. N E T D E BT-TO-E B I T D A (N O R M A L I Z E D) Adjusted Earnings Before Interest, Tax, Depreciation and Amortization (Normalized) (Adjusted EBTIDA (Normalized)): The Company defines Adjusted EBITDA (Normalized) as Adjusted EBITDA, adjusted to reflect the effects of non-recurring property transactions. In the case of acquisition properties, Adjusted EBITDA (Normalized) would be calculated based on Adjusted EBITDA plus the Company’s income (loss) for its ownership period annualized and included on a trailing twelve month basis. In the case of disposition properties, Adjusted EBITDA (Normalized) would be calculated based on Adjusted EBITDA minus the disposition property’s actual income (loss) on a trailing twelve-month basis. In the case of joint venture transaction properties whereby the Company acquires a controlling interest and subsequently consolidates the acquired asset, Adjusted EBITDA (Normalized) would be calculated based on Adjusted EBITDA plus the actual income (loss) on a trailing twelve-month basis in proportion to the Company’s economic interests in the joint venture as of the reporting date, minus recurring joint venture distributions (the Company’s practice for EBITDA recognition for joint ventures). The Company presents Adjusted EBITDA (Normalized) because the Company believes that Adjusted EBITDA (Normalized) provides a more appropriate denominator for its calculation of the Net Debt-to-EBITDA ratio, as it reflects the leverage profile of the Company as of the reporting date. Adjusted EBITDA (Normalized) should not be considered as an alternative to net income (determined in accordance with GAAP), as an indication of the Company’s financial performance, as an alternative to net cash flows from operating activities (determined in accordance with GAAP) or as a measure of the Company’s liquidity. NET OPERATING INCOME (NOI) represents total revenues less total operating expenses, as reconciled to net income above. The Company considers NOI to be a meaningful non-GAAP financial measure for making decisions and assessing unlevered performance of its property types and markets as it relates to total return on assets, as opposed to levered return on equity. As properties are considered for sale and acquisition based on NOI estimates and projections, the Company utilizes this measure to make investment decisions, as well as compare the performance of its assets to those of its peers. NOI should not be considered a substitute for net income, and the Company’s use of NOI may not be comparable to similarly titled measures used by other companies. The Company calculates NOI before any allocations to non-controlling interests, as those interests do not affect the overall performance of the individual assets being measured and assessed. ORA™ score is an aggregate compilation of a property’s ratings across various review sites. Each month, J Turner Research monitors the online ratings of properties nationwide. Using a statistical model, a single score based on a scale of 0 to 100 is assigned to each property. SAME STORE includes properties that were owned for the entirety of the years being compared and exclude properties under redevelopment or development and properties acquired, sold or classified as held for sale during the years being compared. |
| Thank You |