| Corporate Presentation SEPTEMBER 2, 2025 |
| CORPORATE PRESENTATION, SEPTEMBER 2, 2025 | 2 THIS OPERATING AND FINANCIAL DATA SHOULD BE READ IN CONNECTION W I T H O U R Q U A RT E R LY R E P O RT O N F O R M 10-Q F O R T H E Q U A RT E R E N D E D JUNE 30, 2025. Statements made in this presentation may be forward-looking statements within the mean - ing of Section 21E of the Securities Exchange Act of 1934, as amended. Such forward-look - ing statements are intended to be covered by the safe harbor provisions for forward-looking statements contained in Section 21E of such act. Such forward-looking statements relate to, without limitation, our future economic performance, plans and objectives for future operations and projections of revenue and other financial items. Forward-looking statements can be iden - tified by the use of words such as “may,” “will,” “plan,” “potential,” “projected,” “should,” “ex - pect,” “anticipate,” “estimate,” “target,” “continue” or comparable terminology. Forward-looking statements are inherently subject to certain risks, trends and uncertainties, many of which we cannot predict with accuracy and some of which we might not even anticipate. Although we believe that the expectations reflected in such forward-looking statements are based upon reasonable assumptions at the time made, we can give no assurance that such expectations will be achieved. Future events and actual results, financial and otherwise, may differ materi - ally from the results discussed in the forward-looking statements. Readers are cautioned not to place undue reliance on these forward-looking statements and are advised to consider the factors listed above together with the additional factors under the heading “Disclosure Regard - ing Forward-Looking Statements” and “Risk Factors” in our annual reports on Form 10-K, as may be supplemented or amended by our quarterly reports on Form 10-Q, which are incorpo - rated herein by reference. We assume no obligation to update or supplement forward-looking statements that become untrue because of subsequent events, new information or otherwise. Forward-Looking Statements |
| CORPORATE PRESENTATION, SEPTEMBER 2, 2025 | 3 Our Vision To continuously innovate and transform residential living by creating exceptional spaces where residents thrive and feel truly at home, while positively impacting the communities we serve. Our Mission To deliver comprehensive residential solutions that blend luxury, energy efficiency and thoughtful design. Through our commitment to excellence in development and management, we create lasting value for our residents while fostering vibrant, connected communities. |
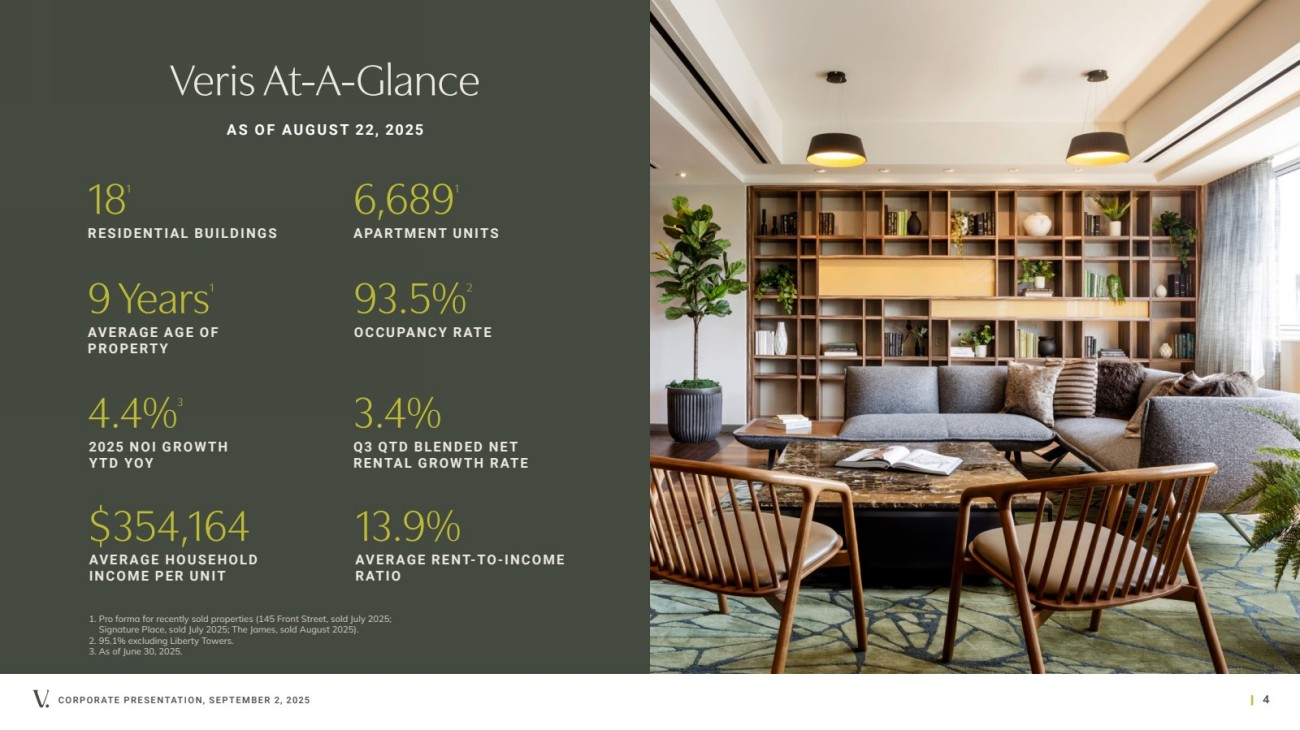
| Veris At-A-Glance CORPORATE PRESENTATION, SEPTEMBER 2, 2025 | 4 93.5% 2 OCCUPANCY RATE $354,164 3.4% AVERAGE HOUSEHOLD INCOME PER UNIT Q3 QT D B L E N D E D N E T RENTAL GROWTH RATE 9 Years 1 6,689 1 AVERAGE AGE OF PROPERTY APARTMENT UNITS 1. Pro forma for recently sold properties (145 Front Street, sold July 2025; Signature Place, sold July 2025; The James, sold August 2025). 2. 95.1% excluding Liberty Towers. 3. As of June 30, 2025. 4.4% 3 18 1 RESIDENTIAL BUILDINGS 13.9% AV E R A G E R E N T-TO-I N C O M E RATIO 2025 NOI GROWTH YTD YOY AS OF AUGUST 22, 2025 |
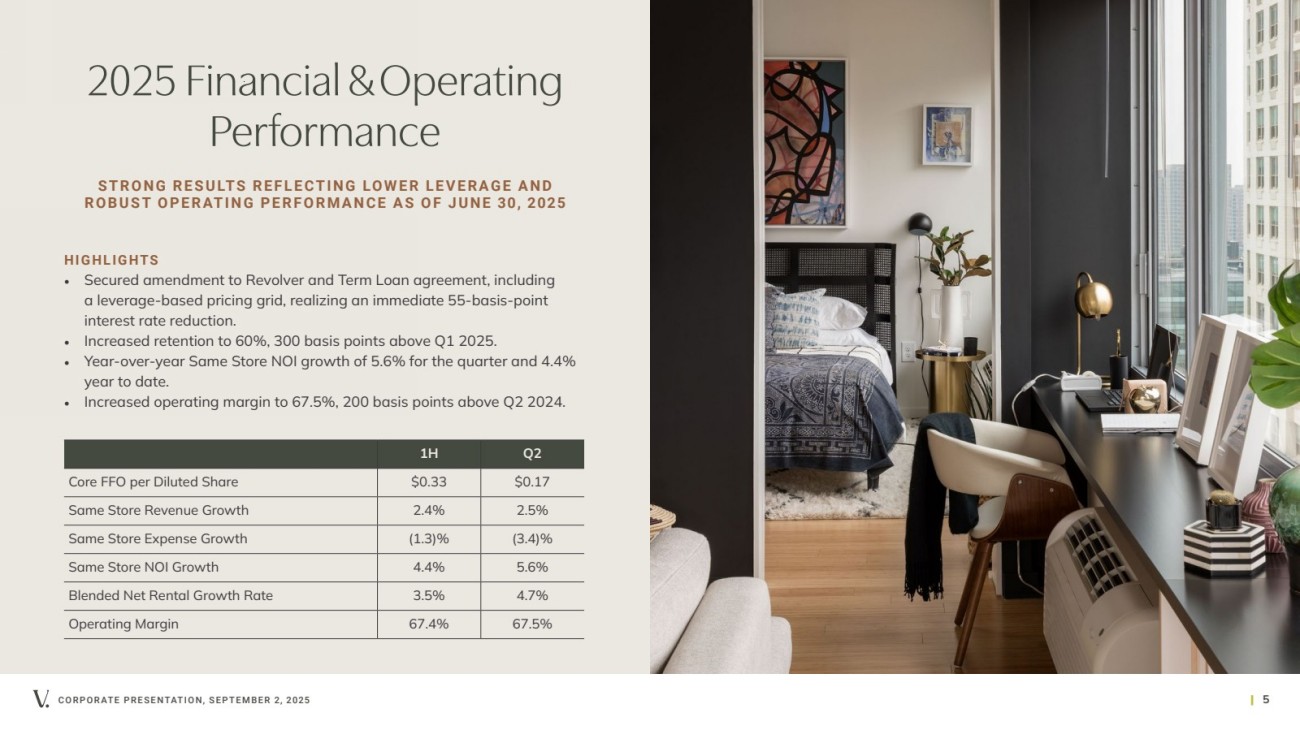
| CORPORATE PRESENTATION, SEPTEMBER 2, 2025 | 5 2025 Financial & Operating Performance HIGHLIGHTS • Secured amendment to Revolver and Term Loan agreement, including a leverage-based pricing grid, realizing an immediate 55-basis-point interest rate reduction. • Increased retention to 60%, 300 basis points above Q1 2025. • Year-over-year Same Store NOI growth of 5.6% for the quarter and 4.4% year to date. • Increased operating margin to 67.5%, 200 basis points above Q2 2024. 1H Q2 Core FFO per Diluted Share $0.33 $0.17 Same Store Revenue Growth 2.4% 2.5% Same Store Expense Growth (1.3)% (3.4)% Same Store NOI Growth 4.4% 5.6% Blended Net Rental Growth Rate 3.5% 4.7% Operating Margin 67.4% 67.5% STRONG RESULTS REFLECTING LOWER LEVERAGE AND ROBUST OPERATING PERFORMANCE AS OF JUNE 30, 2025 |
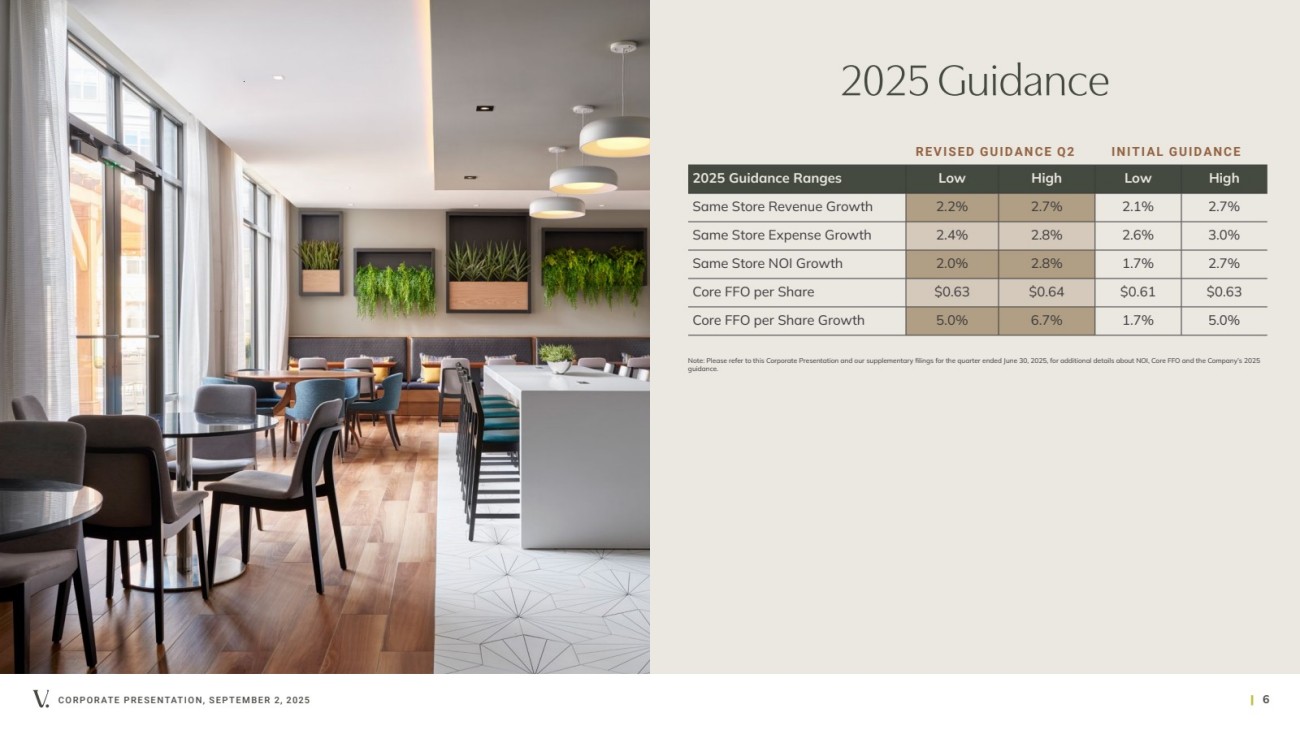
| CORPORATE PRESENTATION, SEPTEMBER 2, 2025 | 6 2025 Guidance 2025 Guidance Ranges Low High Low High Same Store Revenue Growth 2.2% 2.7% 2.1% 2.7% Same Store Expense Growth 2.4% 2.8% 2.6% 3.0% Same Store NOI Growth 2.0% 2.8% 1.7% 2.7% Core FFO per Share $0.63 $0.64 $0.61 $0.63 Core FFO per Share Growth 5.0% 6.7% 1.7% 5.0% Note: Please refer to this Corporate Presentation and our supplementary filings for the quarter ended June 30, 2025, for additional details about NOI, Core FFO and the Company’s 2025 guidance. REVISED GUIDANCE Q2 INITIAL GUIDANCE |
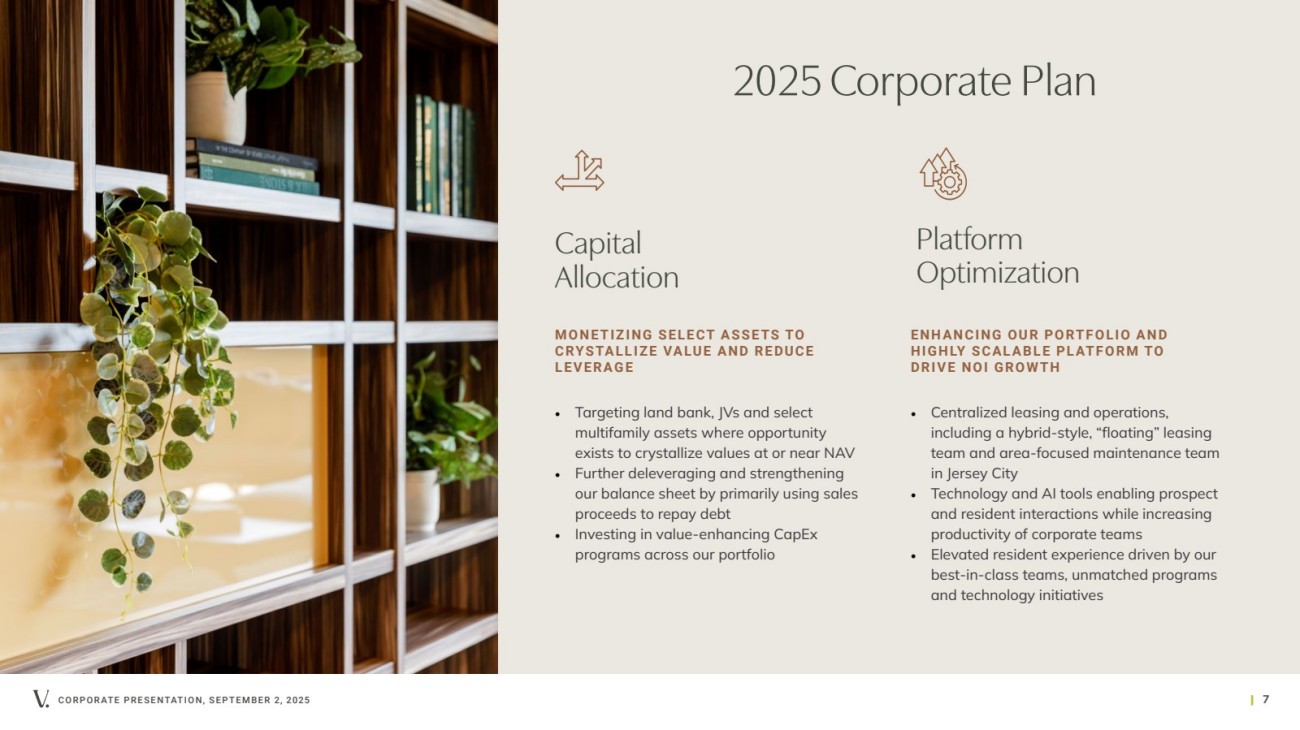
| CORPORATE PRESENTATION, SEPTEMBER 2, 2025 | 7 2025 Corporate Plan Platform Optimization Capital Allocation • Targeting land bank, JVs and select multifamily assets where opportunity exists to crystallize values at or near NAV • Further deleveraging and strengthening our balance sheet by primarily using sales proceeds to repay debt • Investing in value-enhancing CapEx programs across our portfolio ENHANCING OUR PORTFOLIO AND H I G H LY S C A L A B L E P L AT F O R M TO DRIVE NOI GROWTH MONETIZING SELECT ASSETS TO CRYSTALLIZE VALUE AND REDUCE LEVERAGE • Centralized leasing and operations, including a hybrid-style, “floating” leasing team and area-focused maintenance team in Jersey City • Technology and AI tools enabling prospect and resident interactions while increasing productivity of corporate teams • Elevated resident experience driven by our best-in-class teams, unmatched programs and technology initiatives |
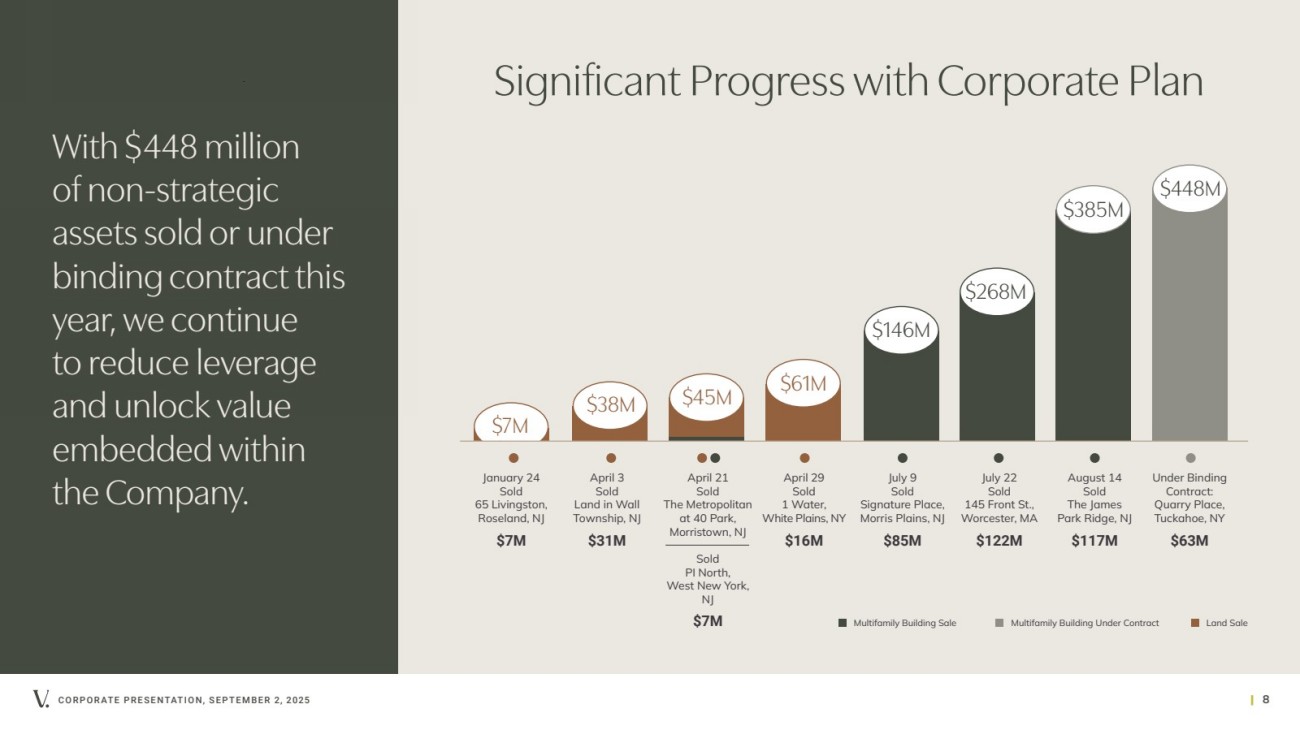
| With $448 million of non-strategic assets sold or under binding contract this year, we continue to reduce leverage and unlock value embedded within the Company. $38M $45M $61M $146M $268M $385M $448M January 24 Sold 65 Livingston, Roseland, NJ $7M April 21 Sold The Metropolitan at 40 Park, Morristown, NJ Sold PI North, West New York, NJ $7M April 29 Sold 1 Water, White Plains, NY $16M July 9 Sold Signature Place, Morris Plains, NJ $85M July 22 Sold 145 Front St., Worcester, MA $122M August 14 Sold The James Park Ridge, NJ $117M April 3 Sold Land in Wall Township, NJ $31M Under Binding Contract: Quarry Place, Tuckahoe, NY $63M Multifamily Building Sale $7M Multifamily Building Under Contract Land Sale CORPORATE PRESENTATION, SEPTEMBER 2, 2025 | 8 Significant Progress with Corporate Plan |
| CORPORATE PRESENTATION, SEPTEMBER 2, 2025 | 9 Improving Our Liquidity & Reducing Borrowing Costs Subsequent to the end of Q2 2025, Veris announced the amendment of its $500 million credit facility, which was established in April 2024. The Amended Facility package comprises a $300 million Revolver and a $200 million delayed-draw Term Loan. • Improved Cost of Debt: Revolver’s new, leverage-based pricing grid spread ranges from SOFR + 1.20% to 1.75%1—an initial 55-basis-point improvement in borrowing costs. • Increased Asset-Level Flexibility: Reduced required number of secured properties in collateral pool from five to two. • Reduced Debt Outstanding: Paid off $200 million Term Loan subsequent to quarter end with sale proceeds from Signature Place and 145 Front Street. • Balance Sheet Optimization: Positions the Company to achieve goal of reducing Net Debt-to-EBITDA (Normalized) to approximately 10.0x by year-end 2025 and below 9.0x by year-end 2026. MODIFICATION OF EXISTING CREDIT FACILITY 11.7x YE 2024 ~10.0x TARGET YE 2025 <9.0x TARGET YE 2026 Further 3x Leverage Reduction by Year-End 2026 V E R I S N E T D E BT-TO-E B I T D A (N O R M A L I Z E D) $300M R E VO LV I N G C R E D I T FACILITY S+1.50%1 BORROWING SPREAD AT TIME OF CLOSING 1. Inclusive of the 5-basis-point spread reduction associated with meeting certain sustainable KPIs. |

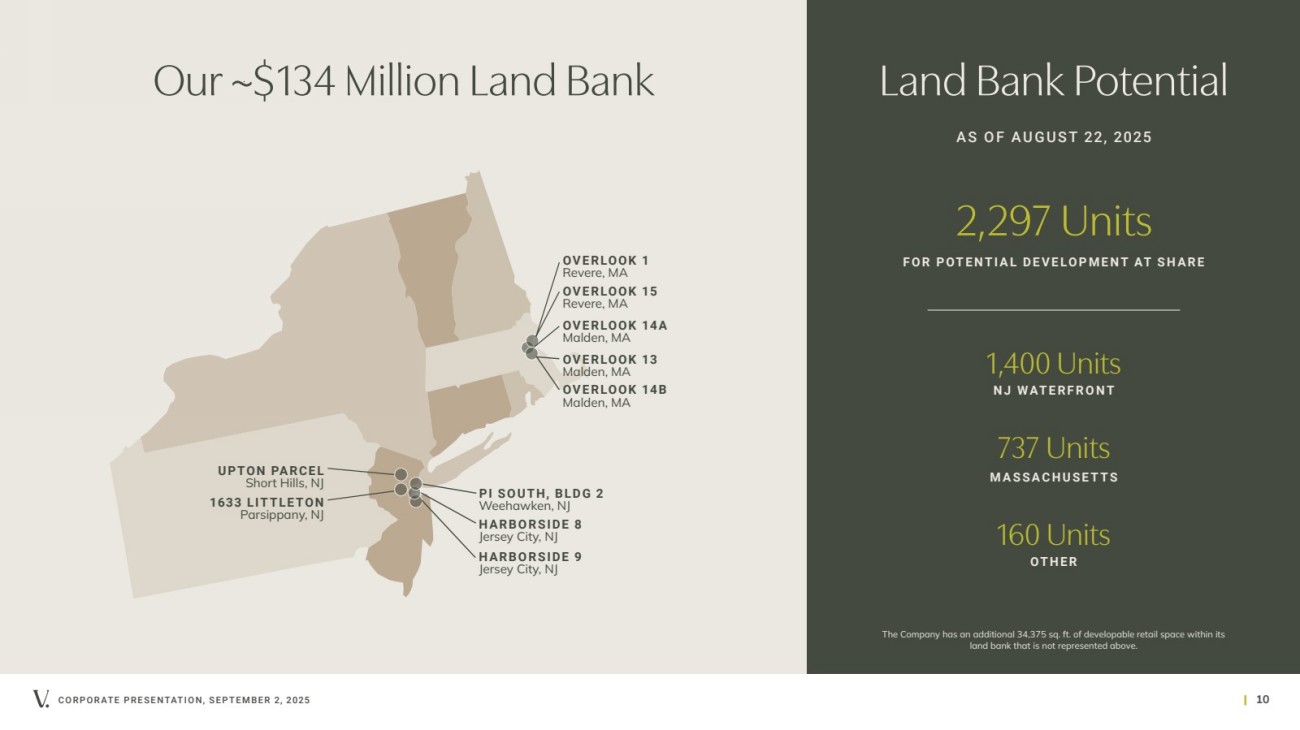
| CORPORATE PRESENTATION, SEPTEMBER 2, 2025 | 10 Land Bank Potential HARBORSIDE 8 Jersey City, NJ 2,297 Units FOR POTENTIAL DEVELOPMENT AT SHARE 1,400 Units NJ WATERFRONT 737 Units MASSACHUSETTS 1633 LITTLETON Parsippany, NJ UPTON PARCEL Short Hills, NJ OVERLOOK 1 Revere, MA OVERLOOK 15 Revere, MA OVERLOOK 14A Malden, MA OVERLOOK 13 Malden, MA OVERLOOK 14B Malden, MA HARBORSIDE 9 Jersey City, NJ The Company has an additional 34,375 sq. ft. of developable retail space within its land bank that is not represented above. PI SOUTH, BLDG 2 Weehawken, NJ Our ~$134 Million Land Bank AS OF AUGUST 22, 2025 160 Units OTHER |
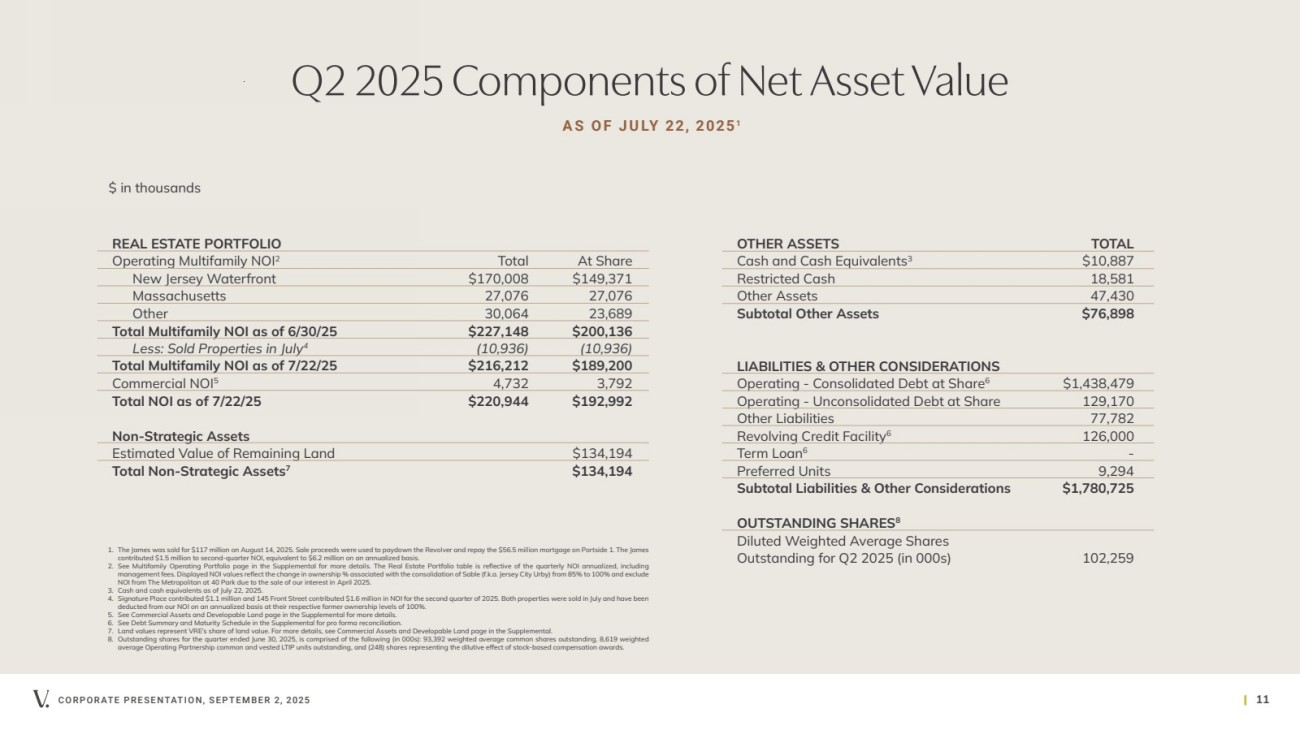
| CORPORATE PRESENTATION, SEPTEMBER 2, 2025 | 11 Q2 2025 Components of Net Asset Value REAL ESTATE PORTFOLIO Operating Multifamily NOI2 Total At Share New Jersey Waterfront $170,008 $149,371 Massachusetts 27,076 27,076 Other 30,064 23,689 Total Multifamily NOI as of 6/30/25 $227,148 $200,136 Less: Sold Properties in July4 (10,936) (10,936) Total Multifamily NOI as of 7/22/25 $216,212 $189,200 Commercial NOI5 4,732 3,792 Total NOI as of 7/22/25 $220,944 $192,992 Non-Strategic Assets Estimated Value of Remaining Land $134,194 Total Non-Strategic Assets7 $134,194 OTHER ASSETS TOTAL Cash and Cash Equivalents3 $10,887 Restricted Cash 18,581 Other Assets 47,430 Subtotal Other Assets $76,898 LIABILITIES & OTHER CONSIDERATIONS Operating - Consolidated Debt at Share6 $1,438,479 Operating - Unconsolidated Debt at Share 129,170 Other Liabilities 77,782 Revolving Credit Facility6 126,000 Term Loan6 - Preferred Units 9,294 Subtotal Liabilities & Other Considerations $1,780,725 OUTSTANDING SHARES8 Diluted Weighted Average Shares Outstanding for Q2 2025 (in 000s) 102,259 1. The James was sold for $117 million on August 14, 2025. Sale proceeds were used to paydown the Revolver and repay the $56.5 million mortgage on Portside 1. The James contributed $1.5 million to second-quarter NOI, equivalent to $6.2 million on an annualized basis. 2. See Multifamily Operating Portfolio page in the Supplemental for more details. The Real Estate Portfolio table is reflective of the quarterly NOI annualized, including management fees. Displayed NOI values reflect the change in ownership % associated with the consolidation of Sable (f.k.a. Jersey City Urby) from 85% to 100% and exclude NOI from The Metropolitan at 40 Park due to the sale of our interest in April 2025. 3. Cash and cash equivalents as of July 22, 2025. 4. Signature Place contributed $1.1 million and 145 Front Street contributed $1.6 million in NOI for the second quarter of 2025. Both properties were sold in July and have been deducted from our NOI on an annualized basis at their respective former ownership levels of 100%. 5. See Commercial Assets and Developable Land page in the Supplemental for more details. 6. See Debt Summary and Maturity Schedule in the Supplemental for pro forma reconciliation. 7. Land values represent VRE’s share of land value. For more details, see Commercial Assets and Developable Land page in the Supplemental. 8. Outstanding shares for the quarter ended June 30, 2025, is comprised of the following (in 000s): 93,392 weighted average common shares outstanding, 8,619 weighted average Operating Partnership common and vested LTIP units outstanding, and (248) shares representing the dilutive effect of stock-based compensation awards. $ in thousands A S O F J U LY 22, 20251 |
| CORPORATE PRESENTATION, SEPTEMBER 2, 2025 | 12 Our Competitive Advantage Class A Portfolio Newest Portfolio | Unparalleled Amenity Offering Highest Average Rent & Growth Rate Desirable Northeast Markets with Limited New Supply Leading Operating Platform Vertically Integrated & Highly Scalable | Customer Experience-Focused Innovative Use of Technology & AI Significant Capital Allocation Opportunities to Drive Growth Unconsolidated Joint Ventures | Land Bank | Value-Add Programs Experienced Team Management with Proven Track Record Seasoned Board | Best-in-Class Governance Focused on the Creation and Crystallization of Shareholder Value |

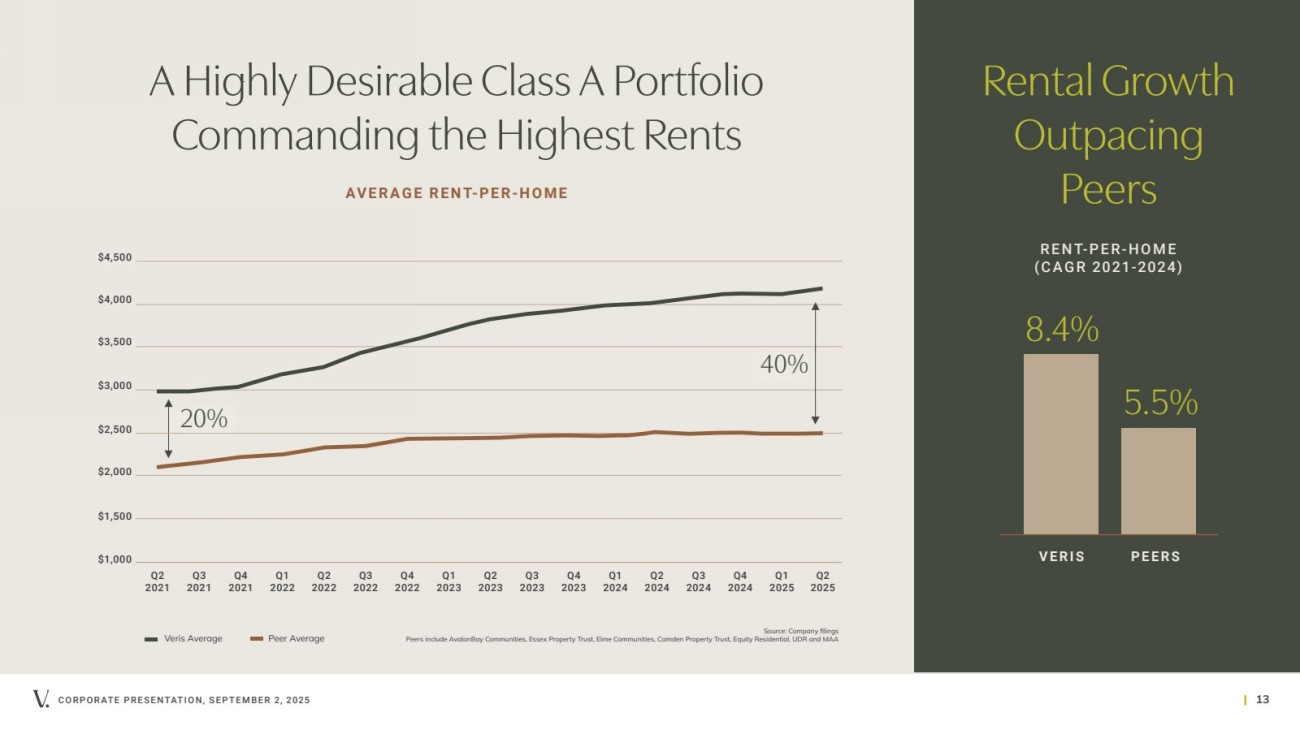
| Source: Company filings Peers include AvalonBay Communities, Essex Property Trust, Elme Communities, Camden Property Trust, Equity Residential, UDR and MAA CORPORATE PRESENTATION, SEPTEMBER 2, 2025 | 13 A Highly Desirable Class A Portfolio Commanding the Highest Rents AV E R A G E R E N T-P E R-H O M E 8.4% 5.5% Rental Growth Outpacing Peers VERIS PEERS R E N T-P E R-H O M E (CAGR 2021-2024) Q2 2021 Q3 2021 Q4 2021 Q1 2022 $1,000 $1,500 $2,000 $2,500 $3,000 $3,500 $4,000 $4,500 Veris Average Peer Average 20% 40% Q2 2022 Q3 2022 Q4 2022 Q1 2023 Q2 2023 Q3 2023 Q4 2023 Q1 2024 Q2 2024 Q3 2024 Q4 2024 Q1 2025 Q2 2025 |
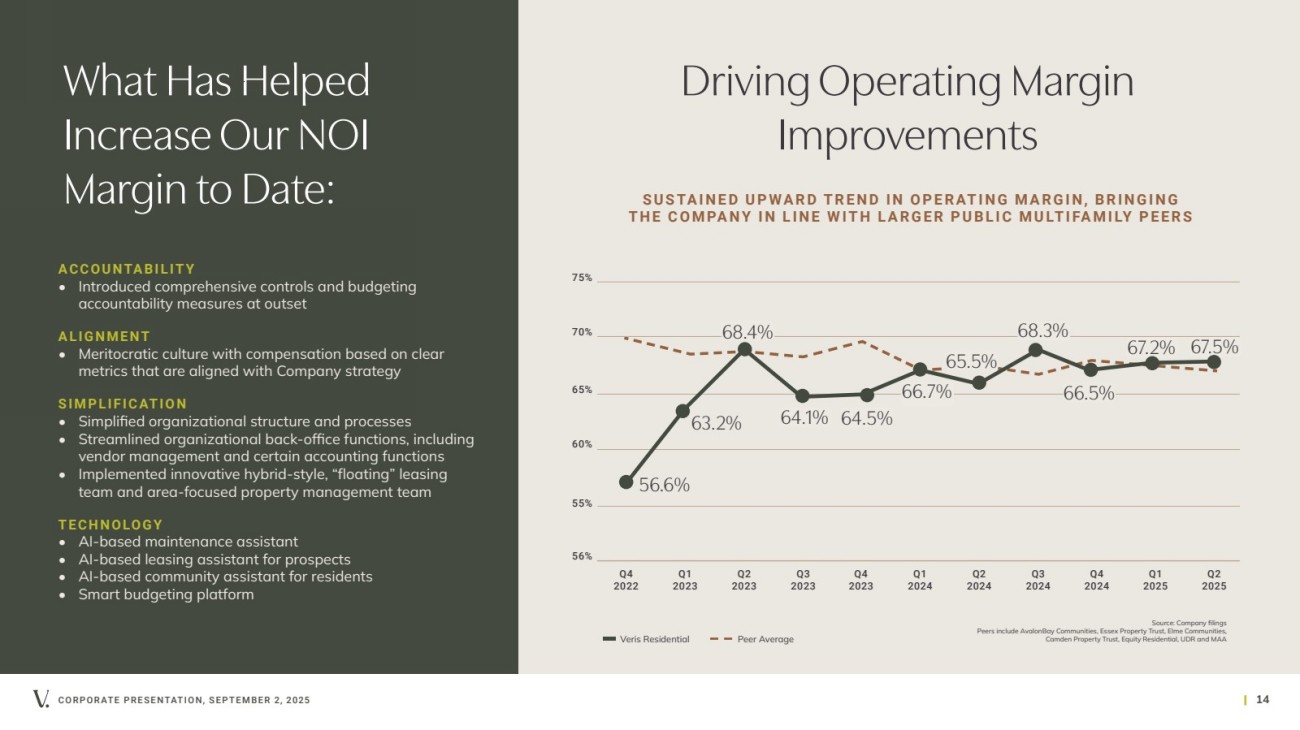
| 70% 65% 60% 55% 56% Veris Residential Source: Company filings Peers include AvalonBay Communities, Essex Property Trust, Elme Communities, Camden Property Trust, Equity Residential, UDR and MAA 75% Q4 2022 Q1 2023 Q2 2023 Q3 2023 Q4 2023 Q1 2024 Q2 2024 Q3 2024 Peer Average Driving Operating Margin Improvements S U S TA I N E D U P WA R D T R E N D I N O P E R AT I N G M A R G I N, B R I N G I N G T H E C O M PA N Y I N L I N E W I T H L A R G E R P U B L I C M U LT I FA M I LY P E E R S ACCOUNTABILITY • Introduced comprehensive controls and budgeting accountability measures at outset ALIGNMENT • Meritocratic culture with compensation based on clear metrics that are aligned with Company strategy SIMPLIFICATION • Simplified organizational structure and processes • Streamlined organizational back-office functions, including vendor management and certain accounting functions • Implemented innovative hybrid-style, “floating” leasing team and area-focused property management team TECHNOLOGY • AI-based maintenance assistant • AI-based leasing assistant for prospects • AI-based community assistant for residents • Smart budgeting platform 56.6% 63.2% 64.1% 64.5% 66.7% 65.5% Q4 2024 66.5% Q1 2025 Q2 2025 67.2% 67.5% 68.4% 68.3% CORPORATE PRESENTATION, SEPTEMBER 2, 2025 | 14 What Has Helped Increase Our NOI Margin to Date: |
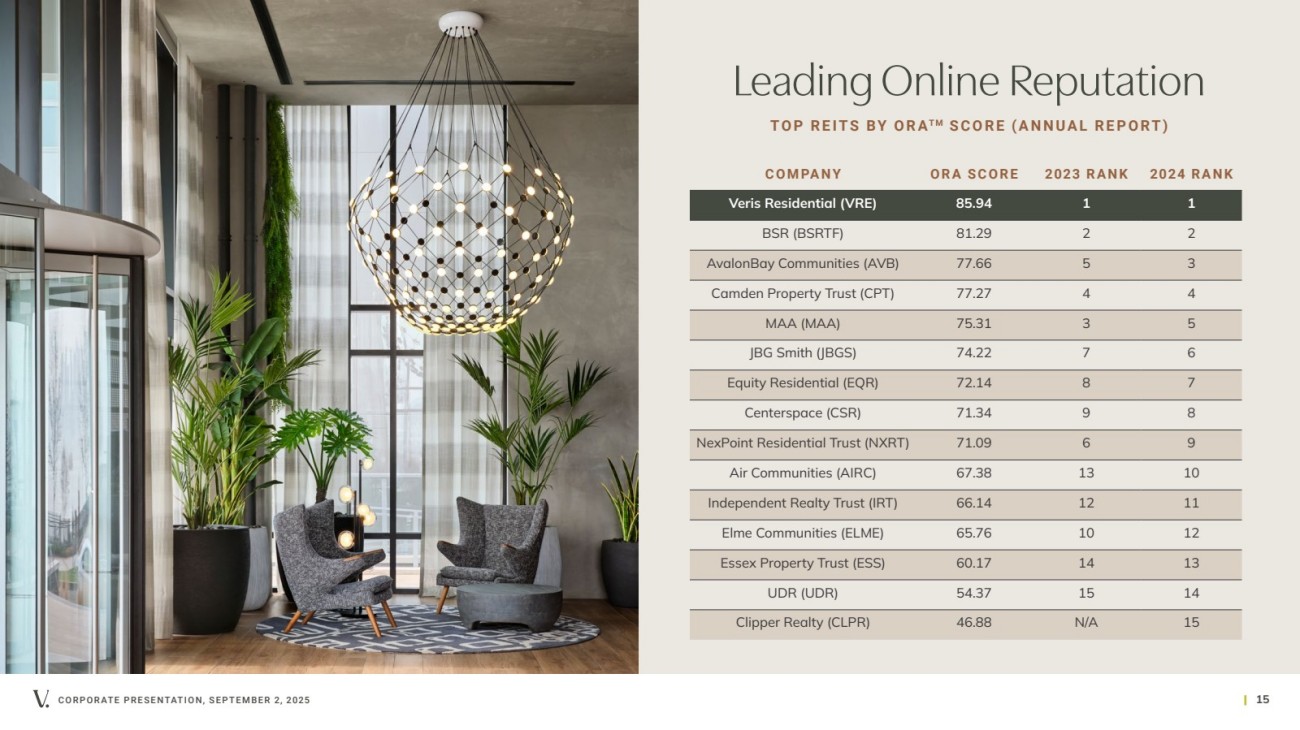
| CORPORATE PRESENTATION, SEPTEMBER 2, 2025 | 15 COMPANY ORA SCORE 2023 RANK 2024 RANK Veris Residential (VRE) 85.94 1 1 BSR (BSRTF) 81.29 2 2 AvalonBay Communities (AVB) 77.66 5 3 Camden Property Trust (CPT) 77.27 4 4 MAA (MAA) 75.31 3 5 JBG Smith (JBGS) 74.22 7 6 Equity Residential (EQR) 72.14 8 7 Centerspace (CSR) 71.34 9 8 NexPoint Residential Trust (NXRT) 71.09 6 9 Air Communities (AIRC) 67.38 13 10 Independent Realty Trust (IRT) 66.14 12 11 Elme Communities (ELME) 65.76 10 12 Essex Property Trust (ESS) 60.17 14 13 UDR (UDR) 54.37 15 14 Clipper Realty (CLPR) 46.88 N/A 15 Leading Online Reputation TOP REITS BY ORAT M SCORE (ANNUAL REPORT) |
| CORPORATE PRESENTATION, SEPTEMBER 2, 2025 | 16 Technology without people is just circuits and code—but people partnered with technology forms the foundation for sustainable value creation. Prism, powered by people + tech, is our overarching approach to purposeful technology implementation, focused on solutions that drive measurable returns, rather than innovation for innovation’s sake. LEARN MORE AT PrismVRE.com We use technology to amplify our human talent, transforming operational friction points into opportunities while ensuring our technology evolves with the needs of our communities and residents. |

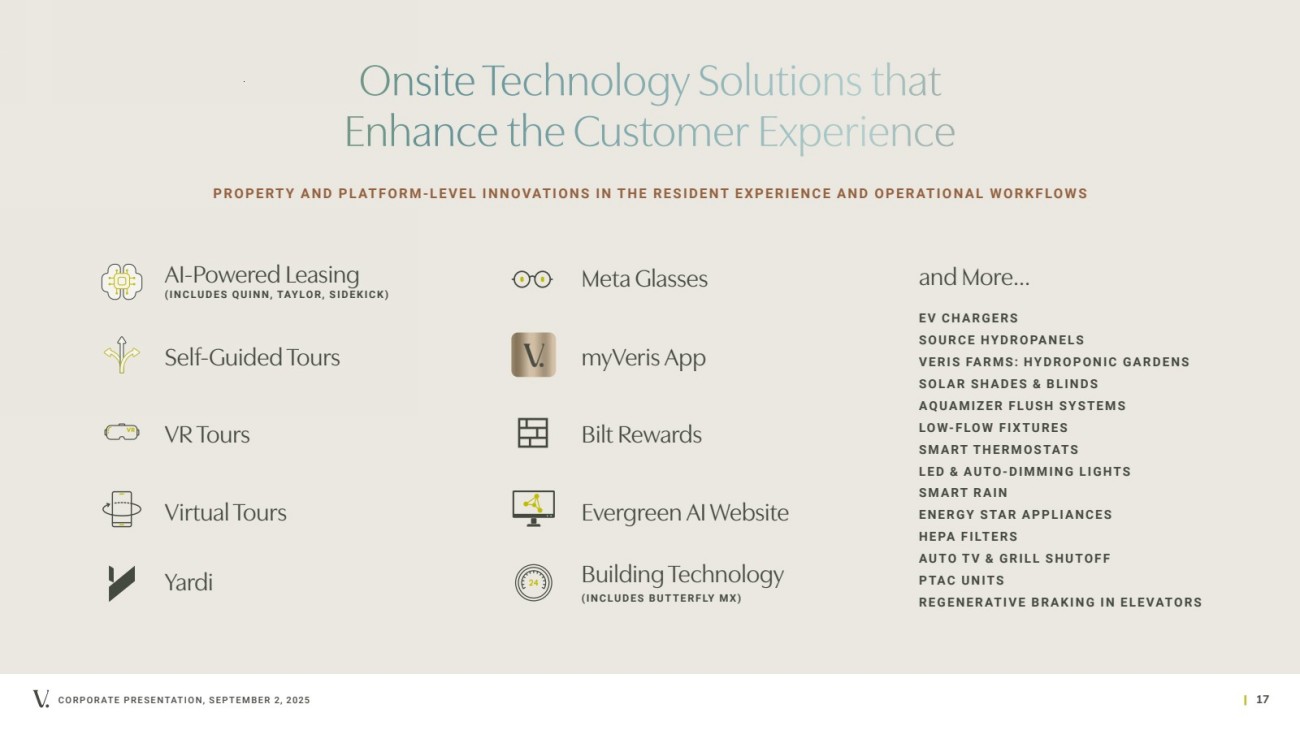
| CORPORATE PRESENTATION, SEPTEMBER 2, 2025 | 17 Self-Guided Tours Meta Glasses and More... myVeris App Bilt Rewards Evergreen AI Website VR Tours Virtual Tours Yardi AI-Powered Leasing (INCLUDES QUINN, TAYLOR, SIDEKICK) Building Technology (I N C LU D E S B U T T E R F LY M X) EV CHARGERS SOURCE HYDROPANELS VERIS FARMS: HYDROPONIC GARDENS SOLAR SHADES & BLINDS AQUAMIZER FLUSH SYSTEMS LOW-FLOW FIXTURES SMART THERMOSTATS LED & AUTO-DIMMING LIGHTS SMART RAIN ENERGY STAR APPLIANCES HEPA FILTERS AUTO TV & GRILL SHUTOFF PTAC UNITS REGENERATIVE BRAKING IN ELEVATORS PROPERTY AND PLATFORM-LEVEL INNOVATIONS IN THE RESIDENT EXPERIENCE AND OPERATIONAL WORKFLOWS Onsite Technology Solutions that Enhance the Customer Experience |
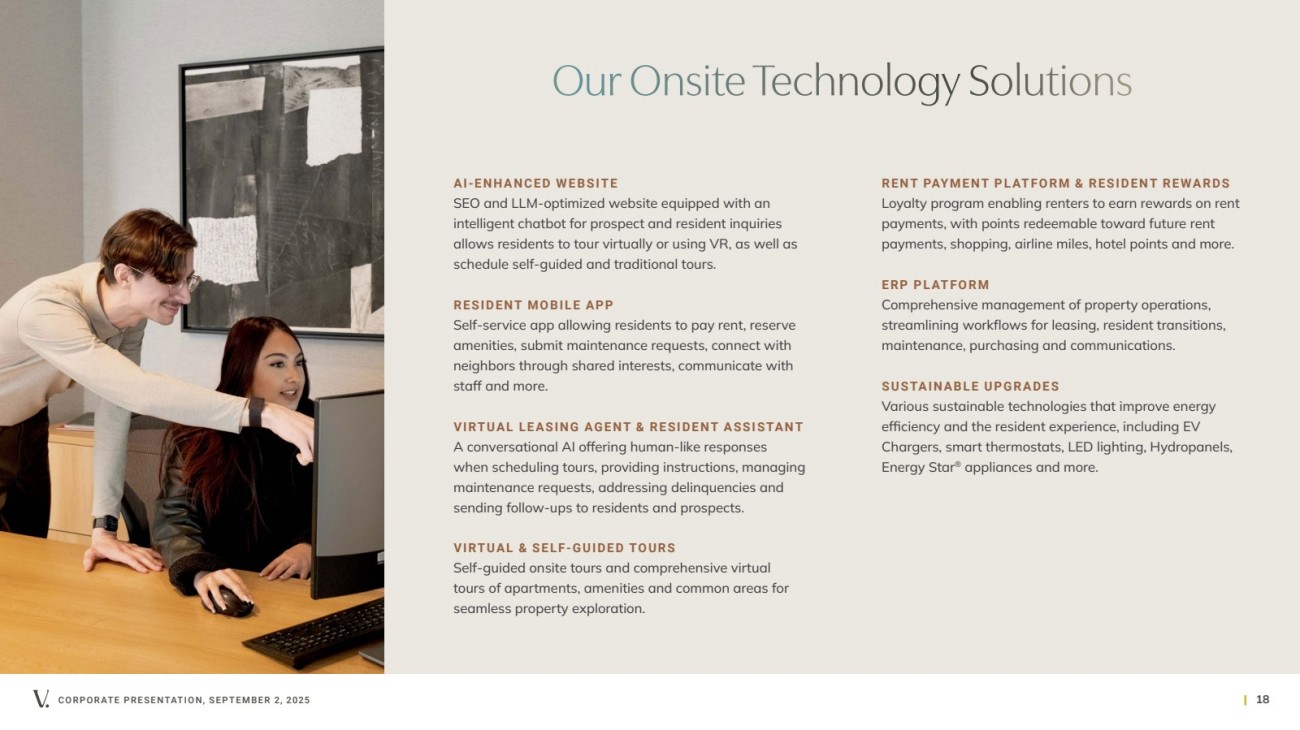
| CORPORATE PRESENTATION, SEPTEMBER 2, 2025 | 18 Our Onsite Technology Solutions AI-ENHANCED WEBSITE SEO and LLM-optimized website equipped with an intelligent chatbot for prospect and resident inquiries allows residents to tour virtually or using VR, as well as schedule self-guided and traditional tours. RESIDENT MOBILE APP Self-service app allowing residents to pay rent, reserve amenities, submit maintenance requests, connect with neighbors through shared interests, communicate with staff and more. VIRTUAL LEASING AGENT & RESIDENT ASSISTANT A conversational AI offering human-like responses when scheduling tours, providing instructions, managing maintenance requests, addressing delinquencies and sending follow-ups to residents and prospects. VIRTUAL & SELF-GUIDED TOURS Self-guided onsite tours and comprehensive virtual tours of apartments, amenities and common areas for seamless property exploration. RENT PAYMENT PLATFORM & RESIDENT REWARDS Loyalty program enabling renters to earn rewards on rent payments, with points redeemable toward future rent payments, shopping, airline miles, hotel points and more. ERP PLATFORM Comprehensive management of property operations, streamlining workflows for leasing, resident transitions, maintenance, purchasing and communications. SUSTAINABLE UPGRADES Various sustainable technologies that improve energy efficiency and the resident experience, including EV Chargers, smart thermostats, LED lighting, Hydropanels, Energy Star® appliances and more. |
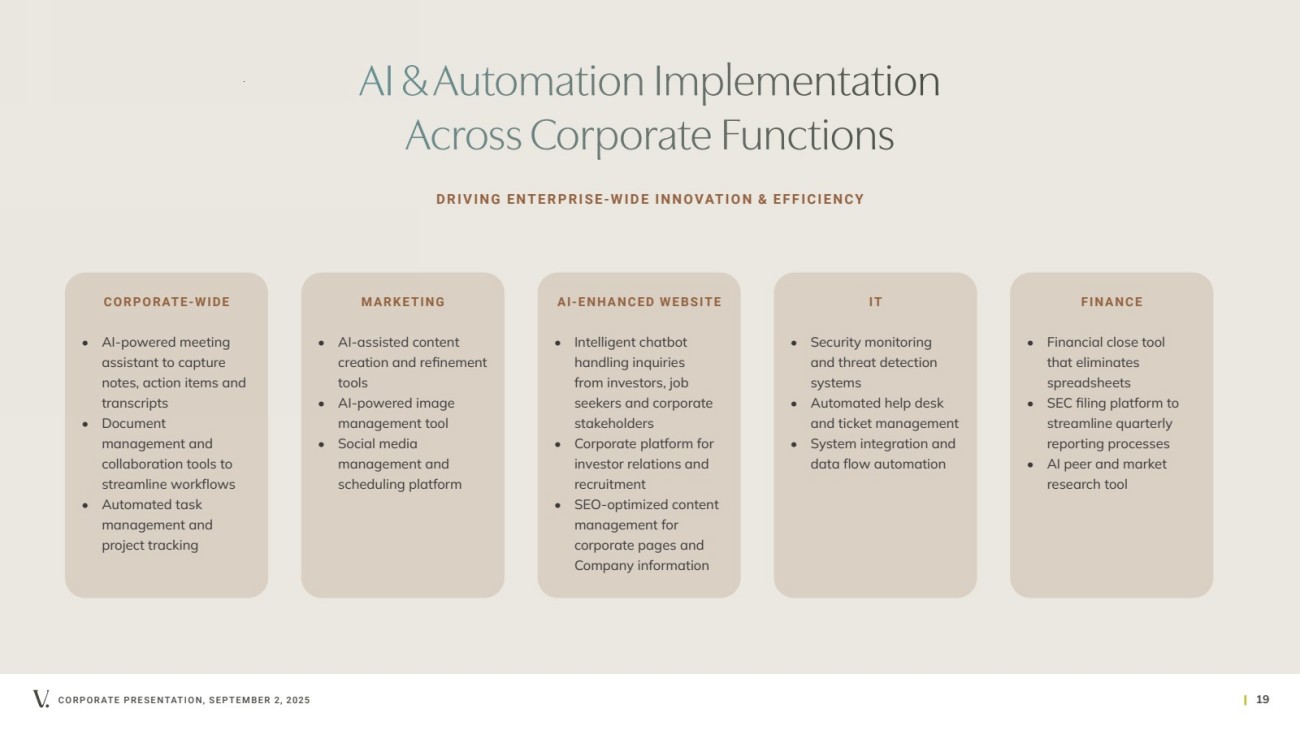
| CORPORATE PRESENTATION, SEPTEMBER 2, 2025 | 19 AI & Automation Implementation Across Corporate Functions DRIVING ENTERPRISE-WIDE INNOVATION & EFFICIENCY CORPORATE-WIDE • AI-powered meeting assistant to capture notes, action items and transcripts • Document management and collaboration tools to streamline workflows • Automated task management and project tracking MARKETING • AI-assisted content creation and refinement tools • AI-powered image management tool • Social media management and scheduling platform AI-ENHANCED WEBSITE • Intelligent chatbot handling inquiries from investors, job seekers and corporate stakeholders • Corporate platform for investor relations and recruitment • SEO-optimized content management for corporate pages and Company information I T • Security monitoring and threat detection systems • Automated help desk and ticket management • System integration and data flow automation FINANCE • Financial close tool that eliminates spreadsheets • SEC filing platform to streamline quarterly reporting processes • AI peer and market research tool |
| CORPORATE PRESENTATION, SEPTEMBER 2, 2025 | 20 Market Overview |

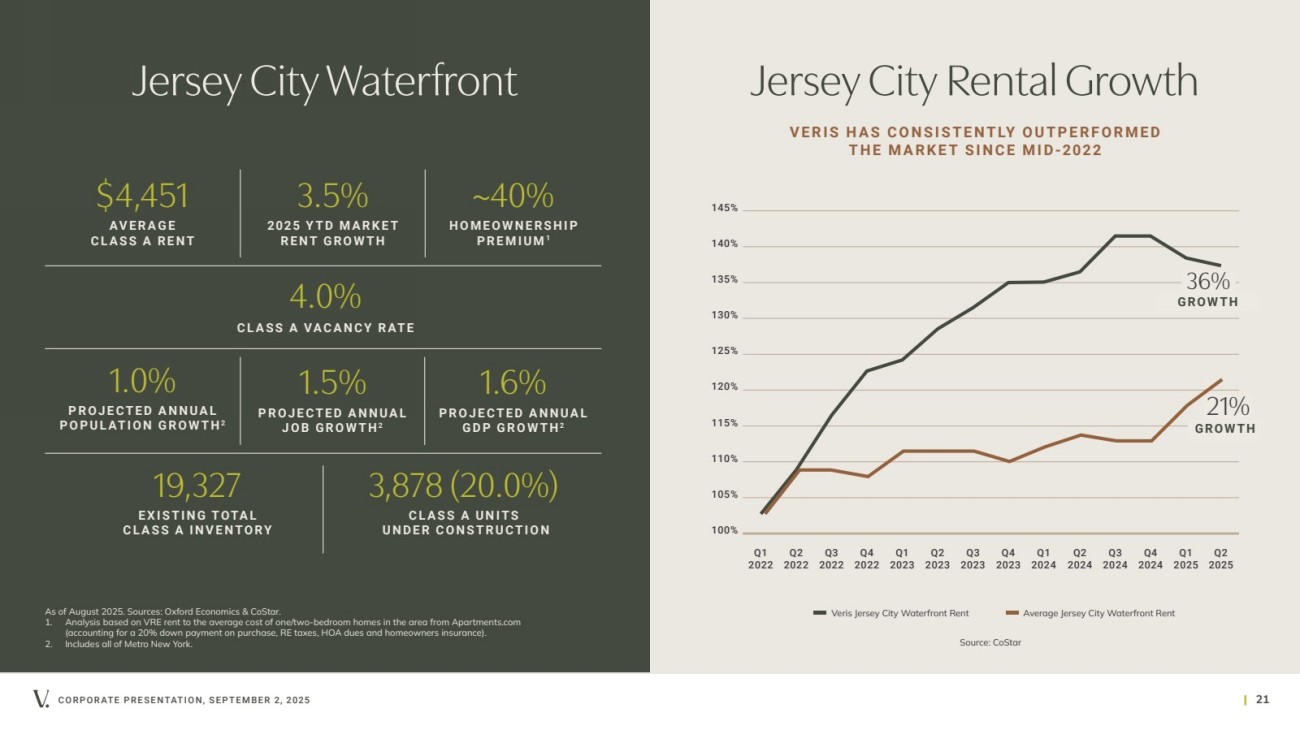
| CORPORATE PRESENTATION, SEPTEMBER 2, 2025 | 21 Jersey City Waterfront 19,327 EXISTING TOTAL CLASS A INVENTORY 4.0% CLASS A VACANCY RATE $4,451 AVERAGE CLASS A RENT ~40% HOMEOWNERSHIP PREMIUM1 1.0% PROJECTED ANNUAL POPULATION GROWTH2 1.5% PROJECTED ANNUAL JOB GROWTH2 1.6% PROJECTED ANNUAL GDP GROWTH2 3,878 (20.0%) CLASS A UNITS UNDER CONSTRUCTION As of August 2025. Sources: Oxford Economics & CoStar. 1. Analysis based on VRE rent to the average cost of one/two-bedroom homes in the area from Apartments.com (accounting for a 20% down payment on purchase, RE taxes, HOA dues and homeowners insurance). 2. Includes all of Metro New York. 3.5% 2025 YTD MARKET RENT GROWTH Jersey City Rental Growth V E R I S H A S C O N S I S T E N T LY O U T P E R F O R M E D THE MARKET SINCE MID-2022 100% 105% 110% 115% 120% 125% 130% 135% 140% 145% Q1 2022 Q2 2022 Q3 2022 Q4 2022 Q1 2023 Q2 2023 Q3 2023 Q4 2023 Q1 2024 Q2 2024 Q3 2024 Q4 2024 Veris Jersey City Waterfront Rent Average Jersey City Waterfront Rent Portfolio Q1 2025 Source: CoStar Q2 2025 36% GROWTH 21% GROWTH |
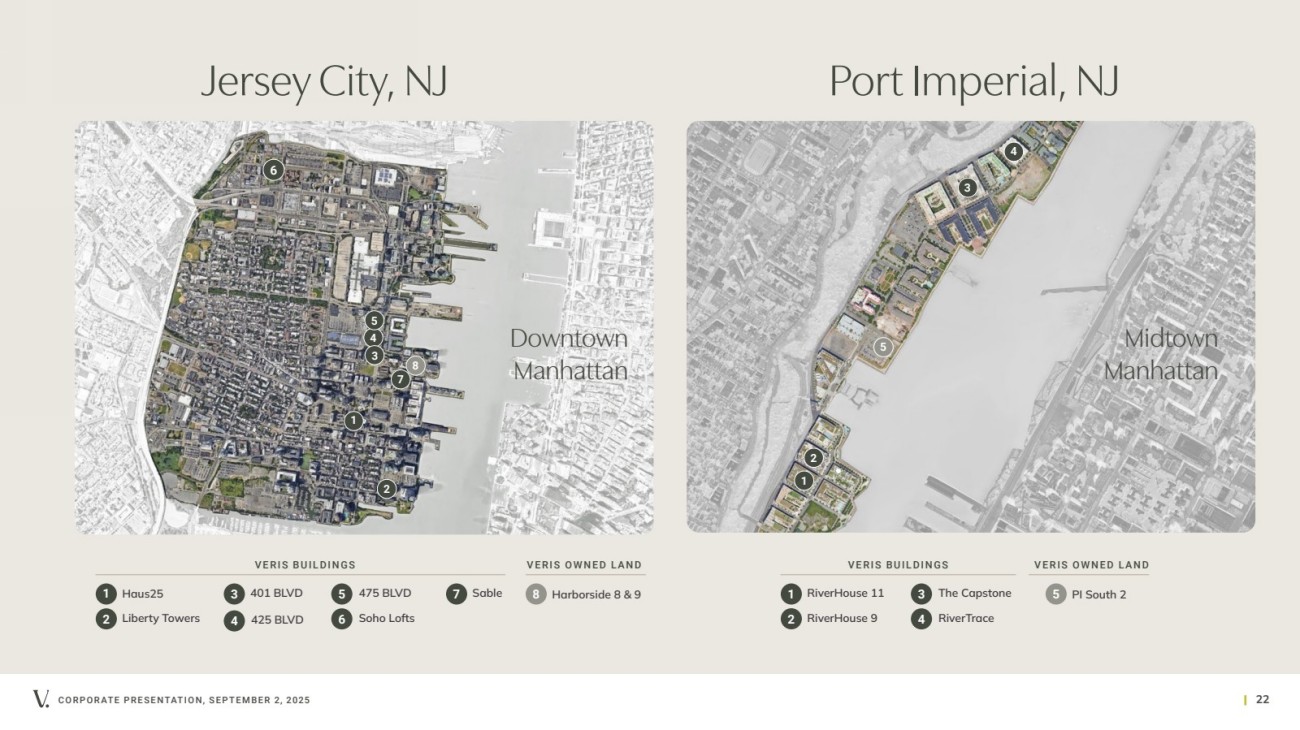
| CORPORATE PRESENTATION, SEPTEMBER 2, 2025 | 22 Downtown Manhattan Haus25 Liberty Towers 401 BLVD 425 BLVD 8 Harborside 8 & 9 1 2 4 5 3 475 BLVD Soho Lofts 6 Sable 7 8 VERIS BUILDINGS VERIS OWNED LAND 4 1 2 3 Midtown Manhattan 1 7 2 3 4 5 6 Jersey City, NJ Port Imperial, NJ RiverHouse 11 RiverHouse 9 The Capstone RiverTrace VERIS BUILDINGS VERIS OWNED LAND 1 2 3 4 5 PI South 2 5 |
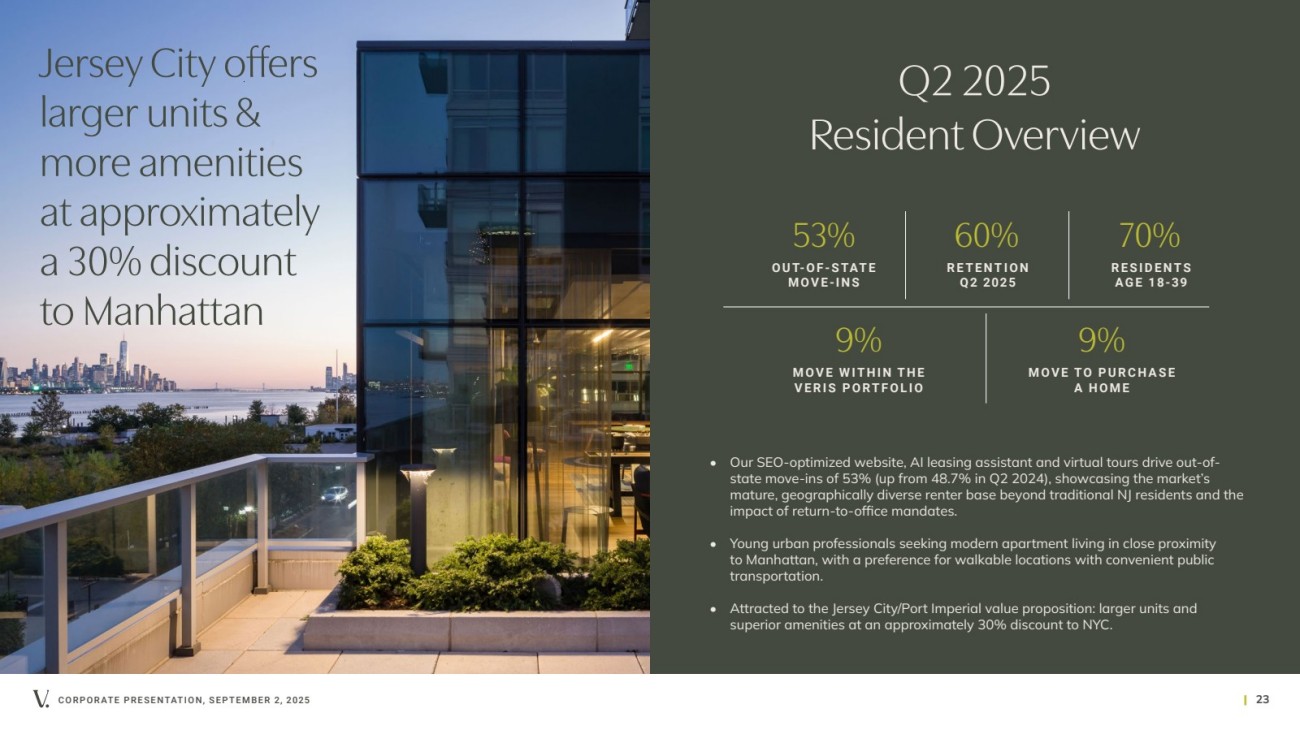
| CORPORATE PRESENTATION, SEPTEMBER 2, 2025 | 23 53% O U T- O F - S TAT E MOVE-INS 60% RETENTION Q2 2025 9% MOVE WITHIN THE VERIS PORTFOLIO 9% M OV E TO P U R C H A S E A HOME Q2 2025 Resident Overview 70% RESIDENTS AGE 18-39 • Our SEO-optimized website, AI leasing assistant and virtual tours drive out-of-state move-ins of 53% (up from 48.7% in Q2 2024), showcasing the market’s mature, geographically diverse renter base beyond traditional NJ residents and the impact of return-to-office mandates. • Young urban professionals seeking modern apartment living in close proximity to Manhattan, with a preference for walkable locations with convenient public transportation. • Attracted to the Jersey City/Port Imperial value proposition: larger units and superior amenities at an approximately 30% discount to NYC. Jersey City offers larger units & more amenities at approximately a 30% discount to Manhattan |
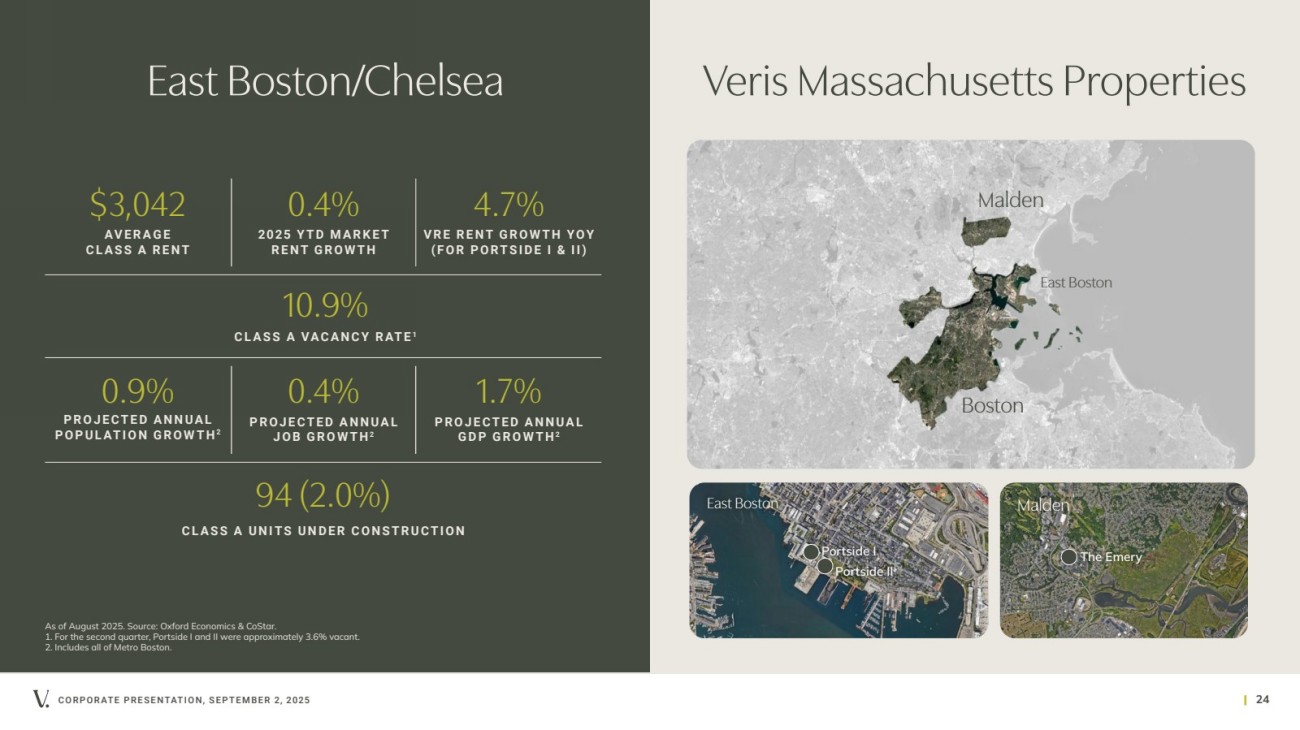
| CORPORATE PRESENTATION, SEPTEMBER 2, 2025 | 24 East Boston/Chelsea 10.9% CLASS A VACANCY RATE 1 $3,042 AVERAGE CLASS A RENT 0.9% PROJECTED ANNUAL POPULATION GROWTH2 0.4% PROJECTED ANNUAL JOB GROWTH2 1.7% PROJECTED ANNUAL GDP GROWTH2 94 (2.0%) CLASS A UNITS UNDER CONSTRUCTION As of August 2025. Source: Oxford Economics & CoStar. 1. For the second quarter, Portside I and II were approximately 3.6% vacant. 2. Includes all of Metro Boston. Veris Massachusetts Properties Boston Malden East Boston The Emery East Boston Malden Portside I Portside II 4.7% VRE RENT GROWTH YOY (FOR PORTSIDE I & II) 0.4% 2025 YTD MARKET RENT GROWTH |
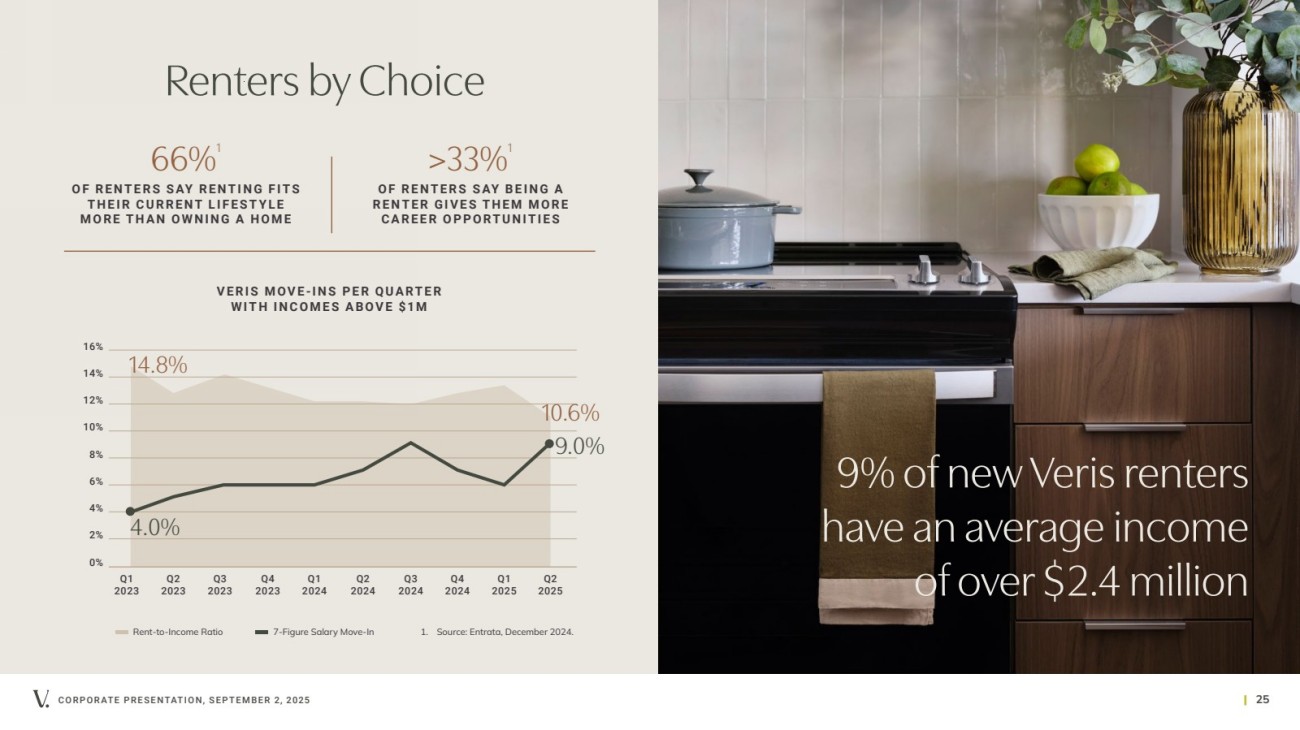
| CORPORATE PRESENTATION, SEPTEMBER 2, 2025 | 25 9% of new Veris renters have an average income of over $2.4 million Renters by Choice 66%1 O F R E N T E R S S AY R E N T I N G F I TS T H E I R C U R R E N T L I F E S T Y L E MORE THAN OWNING A HOME >33%1 O F R E N T E R S S AY B E I N G A R E N T E R G I V E S T H E M M O R E CAREER OPPORTUNITIES 0% 2% 4% 6% 8% 10% 12% 14% 16% VERIS MOVE-INS PER QUARTER WITH INCOMES ABOVE $1M Rent-to-Income Ratio 7-Figure Salary Move-In 1. Source: Entrata, December 2024. Q1 2023 Q2 2023 Q3 2023 Q4 2023 Q1 2024 Q2 2024 Q3 2024 Q4 2024 Q1 2025 Q2 2025 9.0% 4.0% 14.8% 10.6% |
| CORPORATE PRESENTATION, SEPTEMBER 2, 2025 | 26 Corporate Responsibility |

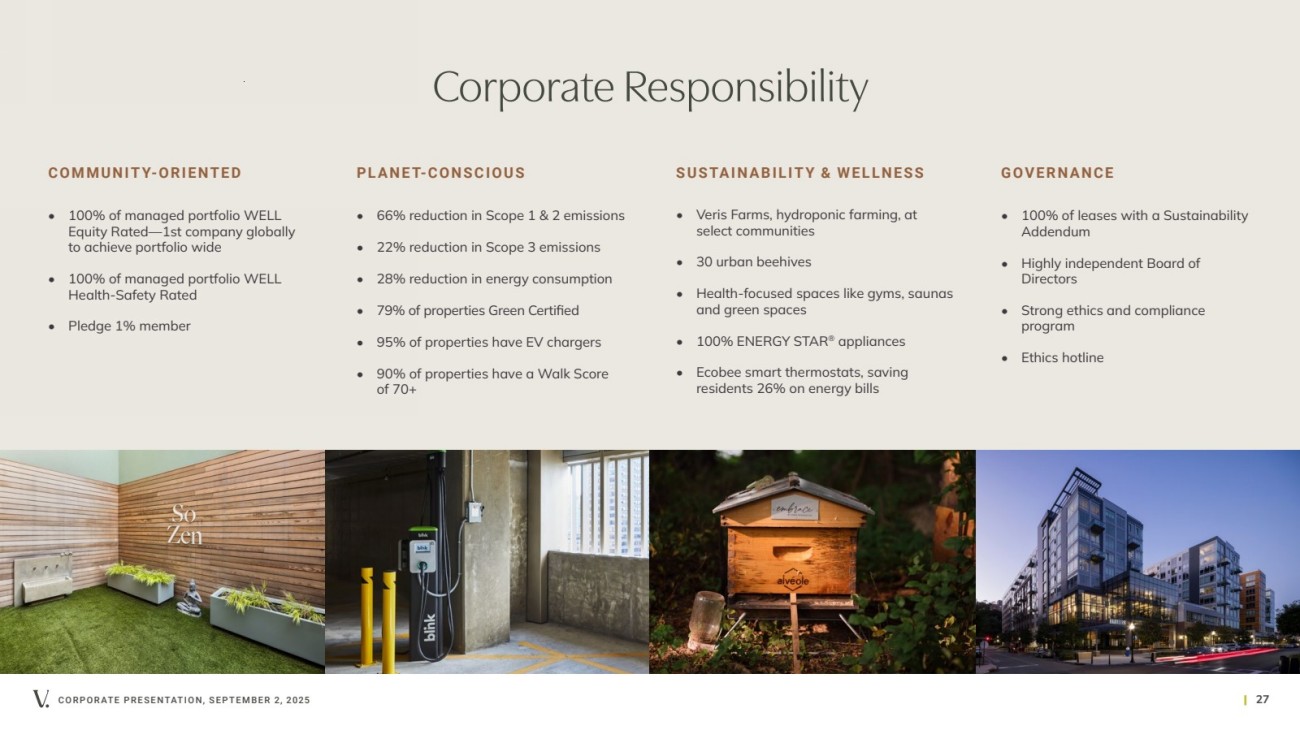
| CORPORATE PRESENTATION, SEPTEMBER 2, 2025 | 27 SUSTAINABILITY & WELLNESS GOVERNANCE • 66% reduction in Scope 1 & 2 emissions • 22% reduction in Scope 3 emissions • 28% reduction in energy consumption • 79% of properties Green Certified • 95% of properties have EV chargers • 90% of properties have a Walk Score of 70+ • 100% of managed portfolio WELL Equity Rated—1st company globally to achieve portfolio wide • 100% of managed portfolio WELL Health-Safety Rated • Pledge 1% member • 100% of leases with a Sustainability Addendum • Highly independent Board of Directors • Strong ethics and compliance program • Ethics hotline • Veris Farms, hydroponic farming, at select communities • 30 urban beehives • Health-focused spaces like gyms, saunas and green spaces • 100% ENERGY STAR® appliances • Ecobee smart thermostats, saving residents 26% on energy bills Corporate Responsibility COMMUNITY-ORIENTED P L A N E T-C O N S C I O U S |
| CORPORATE PRESENTATION, SEPTEMBER 2, 2025 | 28 Our Values EXCELLENCE ALWAYS FORWARD-THINKING Our properties are part of wider communities, and we recognize our responsibility to those around us. By putting our residents and employees first, we ensure exceptional living and working experiences that create long-term value. We pioneer innovative solutions that transform residential living and create resilient communities. Life in a Veris Residential community promises excellence at every turn. Our tailor-made programs assure consistent, best-in-class service from move-in to move-out. PEOPLE FIRST COMMUNITY IMPACT |

| CORPORATE PRESENTATION, SEPTEMBER 2, 2025 | 29 Ancillary Information |

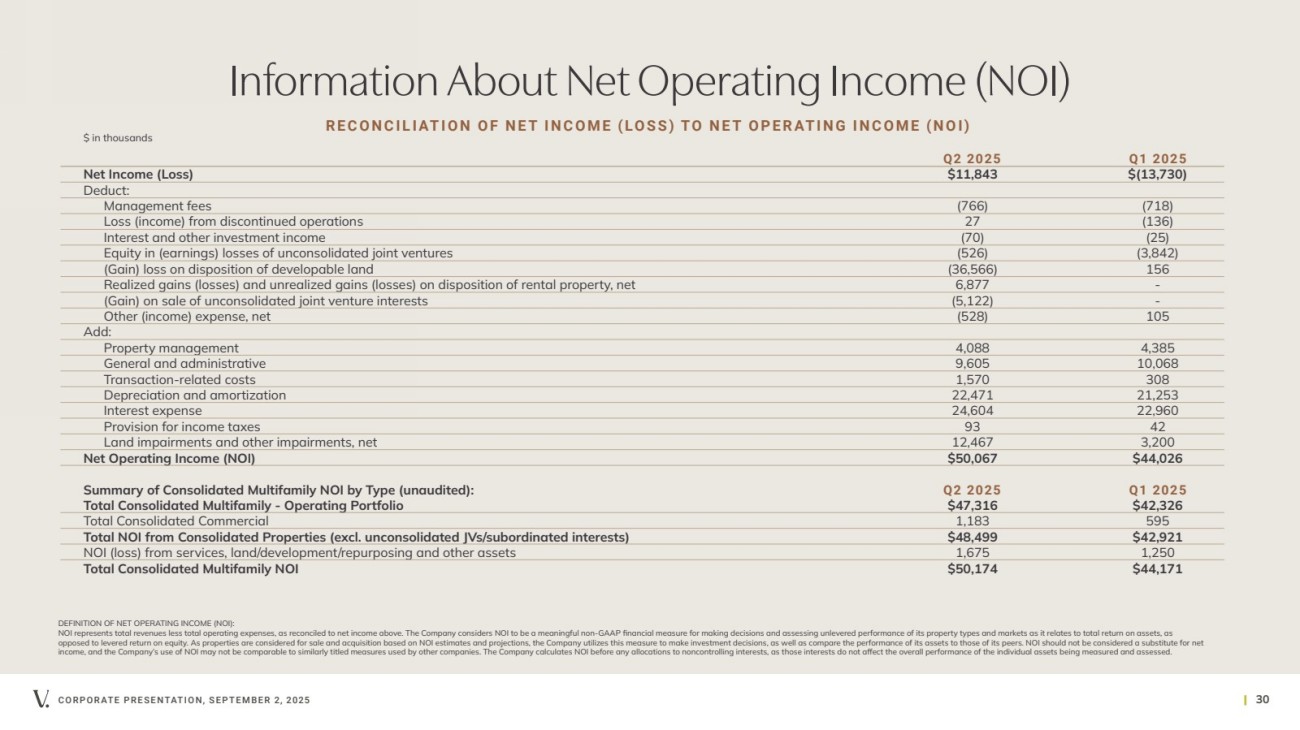
| Q2 2025 Q1 2025 Net Income (Loss) $11,843 $(13,730) Deduct: Management fees (766) (718) Loss (income) from discontinued operations 27 (136) Interest and other investment income (70) (25) Equity in (earnings) losses of unconsolidated joint ventures (526) (3,842) (Gain) loss on disposition of developable land (36,566) 156 Realized gains (losses) and unrealized gains (losses) on disposition of rental property, net 6,877 - (Gain) on sale of unconsolidated joint venture interests (5,122) - Other (income) expense, net (528) 105 Add: Property management 4,088 4,385 General and administrative 9,605 10,068 Transaction-related costs 1,570 308 Depreciation and amortization 22,471 21,253 Interest expense 24,604 22,960 Provision for income taxes 93 42 Land impairments and other impairments, net 12,467 3,200 Net Operating Income (NOI) $50,067 $44,026 Summary of Consolidated Multifamily NOI by Type (unaudited): Q2 2025 Q1 2025 Total Consolidated Multifamily - Operating Portfolio $47,316 $42,326 Total Consolidated Commercial 1,183 595 Total NOI from Consolidated Properties (excl. unconsolidated JVs/subordinated interests) $48,499 $42,921 NOI (loss) from services, land/development/repurposing and other assets 1,675 1,250 Total Consolidated Multifamily NOI $50,174 $44,171 CORPORATE PRESENTATION, SEPTEMBER 2, 2025 | 30 DEFINITION OF NET OPERATING INCOME (NOI): NOI represents total revenues less total operating expenses, as reconciled to net income above. The Company considers NOI to be a meaningful non-GAAP financial measure for making decisions and assessing unlevered performance of its property types and markets as it relates to total return on assets, as opposed to levered return on equity. As properties are considered for sale and acquisition based on NOI estimates and projections, the Company utilizes this measure to make investment decisions, as well as compare the performance of its assets to those of its peers. NOI should not be considered a substitute for net income, and the Company’s use of NOI may not be comparable to similarly titled measures used by other companies. The Company calculates NOI before any allocations to noncontrolling interests, as those interests do not affect the overall performance of the individual assets being measured and assessed. Information About Net Operating Income (NOI) RECONCILIATION OF NET INCOME (LOSS) TO NET OPERATING INCOME (NOI) $ in thousands |
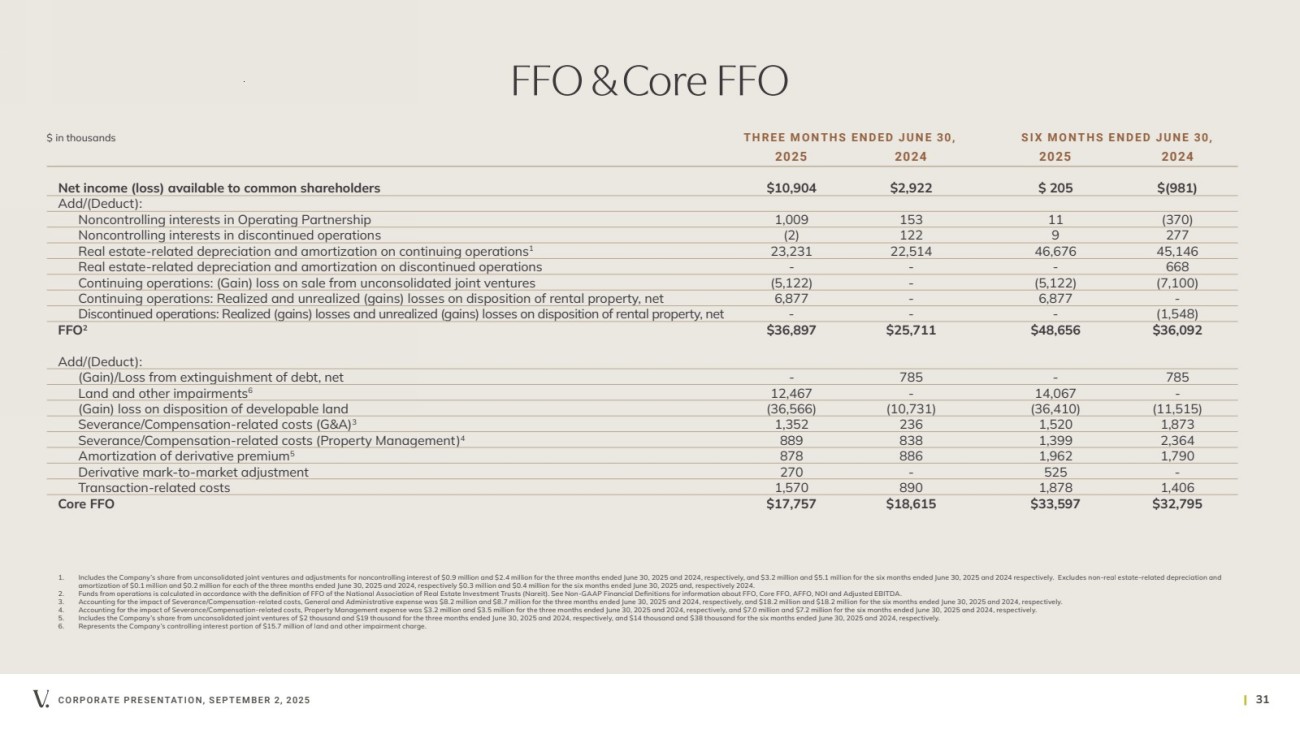
| CORPORATE PRESENTATION, SEPTEMBER 2, 2025 | 31 2025 2024 2025 2024 Net income (loss) available to common shareholders $10,904 $2,922 $ 205 $(981) Add/(Deduct): Noncontrolling interests in Operating Partnership 1,009 153 11 (370) Noncontrolling interests in discontinued operations (2) 122 9 277 Real estate-related depreciation and amortization on continuing operations1 23,231 22,514 46,676 45,146 Real estate-related depreciation and amortization on discontinued operations - - - 668 Continuing operations: (Gain) loss on sale from unconsolidated joint ventures (5,122) - (5,122) (7,100) Continuing operations: Realized and unrealized (gains) losses on disposition of rental property, net 6,877 - 6,877 - Discontinued operations: Realized (gains) losses and unrealized (gains) losses on disposition of rental property, net - - - (1,548) FFO2 $36,897 $25,711 $48,656 $36,092 Add/(Deduct): (Gain)/Loss from extinguishment of debt, net - 785 - 785 Land and other impairments6 12,467 - 14,067 - (Gain) loss on disposition of developable land (36,566) (10,731) (36,410) (11,515) Severance/Compensation-related costs (G&A)3 1,352 236 1,520 1,873 Severance/Compensation-related costs (Property Management)4 889 838 1,399 2,364 Amortization of derivative premium5 878 886 1,962 1,790 Derivative mark-to-market adjustment 270 - 525 - Transaction-related costs 1,570 890 1,878 1,406 Core FFO $17,757 $18,615 $33,597 $32,795 FFO & Core FFO 1. Includes the Company’s share from unconsolidated joint ventures and adjustments for noncontrolling interest of $0.9 million and $2.4 million for the three months ended June 30, 2025 and 2024, respectively, and $3.2 million and $5.1 million for the six months ended June 30, 2025 and 2024 respectively. Excludes non-real estate-related depreciation and amortization of $0.1 million and $0.2 million for each of the three months ended June 30, 2025 and 2024, respectively $0.3 million and $0.4 million for the six months ended June 30, 2025 and, respectively 2024. 2. Funds from operations is calculated in accordance with the definition of FFO of the National Association of Real Estate Investment Trusts (Nareit). See Non-GAAP Financial Definitions for information about FFO, Core FFO, AFFO, NOI and Adjusted EBITDA. 3. Accounting for the impact of Severance/Compensation-related costs, General and Administrative expense was $8.2 million and $8.7 million for the three months ended June 30, 2025 and 2024, respectively, and $18.2 million and $18.2 million for the six months ended June 30, 2025 and 2024, respectively. 4. Accounting for the impact of Severance/Compensation-related costs, Property Management expense was $3.2 million and $3.5 million for the three months ended June 30, 2025 and 2024, respectively, and $7.0 million and $7.2 million for the six months ended June 30, 2025 and 2024, respectively. 5. Includes the Company’s share from unconsolidated joint ventures of $2 thousand and $19 thousand for the three months ended June 30, 2025 and 2024, respectively, and $14 thousand and $38 thousand for the six months ended June 30, 2025 and 2024, respectively. 6. Represents the Company’s controlling interest portion of $15.7 million of land and other impairment charge. $ in thousands THREE MONTHS ENDED JUNE 30, SIX MONTHS ENDED JUNE 30, |
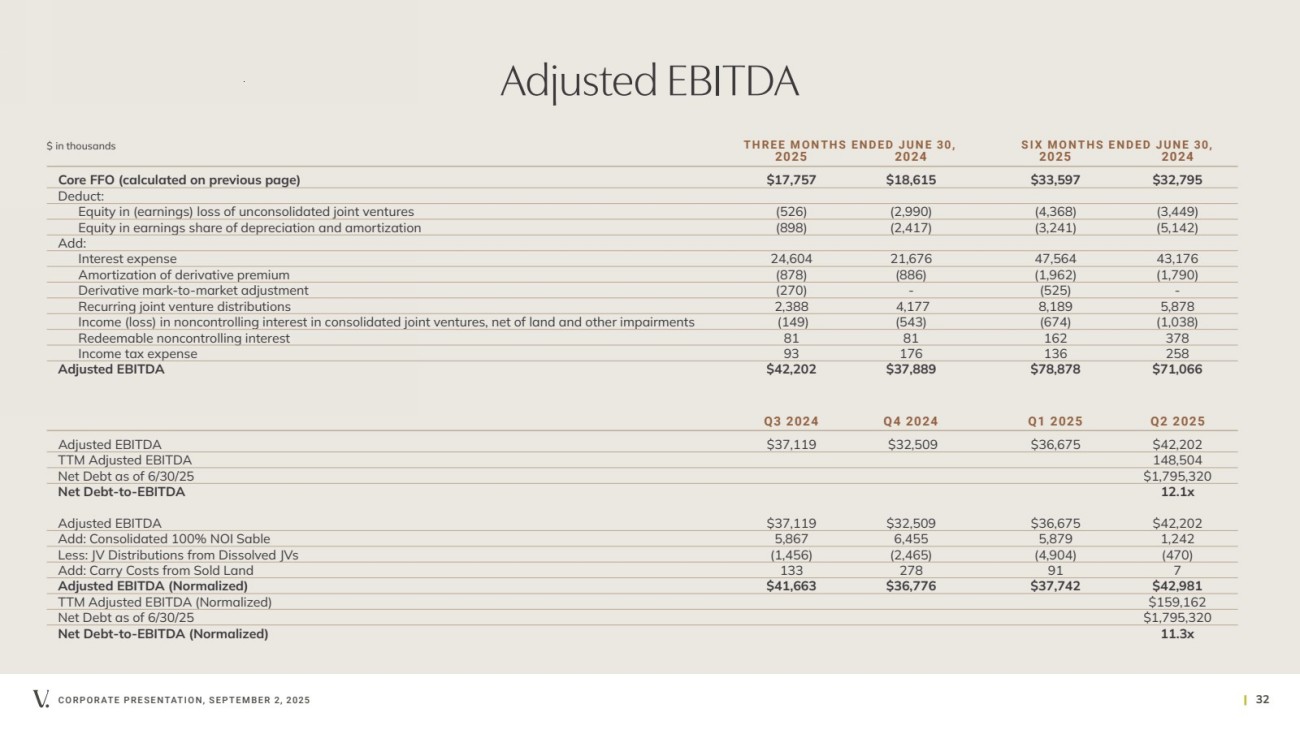
| CORPORATE PRESENTATION, SEPTEMBER 2, 2025 | 32 Adjusted EBITDA 2025 2024 2025 2024 Core FFO (calculated on previous page) $17,757 $18,615 $33,597 $32,795 Deduct: Equity in (earnings) loss of unconsolidated joint ventures (526) (2,990) (4,368) (3,449) Equity in earnings share of depreciation and amortization (898) (2,417) (3,241) (5,142) Add: Interest expense 24,604 21,676 47,564 43,176 Amortization of derivative premium (878) (886) (1,962) (1,790) Derivative mark-to-market adjustment (270) - (525) - Recurring joint venture distributions 2,388 4,177 8,189 5,878 Income (loss) in noncontrolling interest in consolidated joint ventures, net of land and other impairments (149) (543) (674) (1,038) Redeemable noncontrolling interest 81 81 162 378 Income tax expense 93 176 136 258 Adjusted EBITDA $42,202 $37,889 $78,878 $71,066 $ in thousands THREE MONTHS ENDED JUNE 30, SIX MONTHS ENDED JUNE 30, Q3 2024 Q4 2024 Q1 2025 Q2 2025 Adjusted EBITDA $37,119 $32,509 $36,675 $42,202 TTM Adjusted EBITDA 148,504 Net Debt as of 6/30/25 $1,795,320 Net Debt-to-EBITDA 12.1x Adjusted EBITDA $37,119 $32,509 $36,675 $42,202 Add: Consolidated 100% NOI Sable 5,867 6,455 5,879 1,242 Less: JV Distributions from Dissolved JVs (1,456) (2,465) (4,904) (470) Add: Carry Costs from Sold Land 133 278 91 7 Adjusted EBITDA (Normalized) $41,663 $36,776 $37,742 $42,981 TTM Adjusted EBITDA (Normalized) $159,162 Net Debt as of 6/30/25 $1,795,320 Net Debt-to-EBITDA (Normalized) 11.3x |
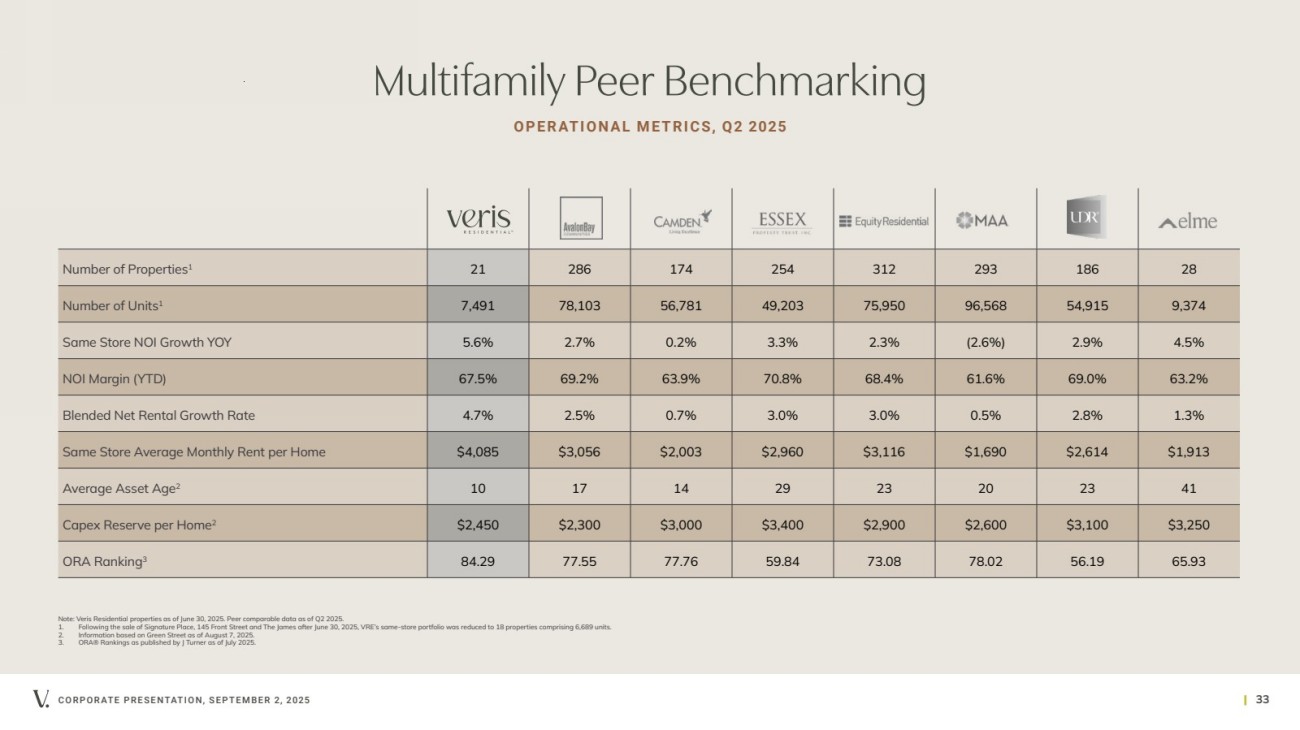
| CORPORATE PRESENTATION, SEPTEMBER 2, 2025 | 33 Multifamily Peer Benchmarking OPERATIONAL METRICS, Q2 2025 Number of Properties1 21 286 174 254 312 293 186 28 Number of Units1 7,491 78,103 56,781 49,203 75,950 96,568 54,915 9,374 Same Store NOI Growth YOY 5.6% 2.7% 0.2% 3.3% 2.3% (2.6%) 2.9% 4.5% NOI Margin (YTD) 67.5% 69.2% 63.9% 70.8% 68.4% 61.6% 69.0% 63.2% Blended Net Rental Growth Rate 4.7% 2.5% 0.7% 3.0% 3.0% 0.5% 2.8% 1.3% Same Store Average Monthly Rent per Home $4,085 $3,056 $2,003 $2,960 $3,116 $1,690 $2,614 $1,913 Average Asset Age2 10 17 14 29 23 20 23 41 Capex Reserve per Home2 $2,450 $2,300 $3,000 $3,400 $2,900 $2,600 $3,100 $3,250 ORA Ranking3 84.29 77.55 77.76 59.84 73.08 78.02 56.19 65.93 Note: Veris Residential properties as of June 30, 2025. Peer comparable data as of Q2 2025. 1. Following the sale of Signature Place, 145 Front Street and The James after June 30, 2025, VRE’s same-store portfolio was reduced to 18 properties comprising 6,689 units. 2. Information based on Green Street as of August 7, 2025. 3. ORA® Rankings as published by J Turner as of July 2025. |
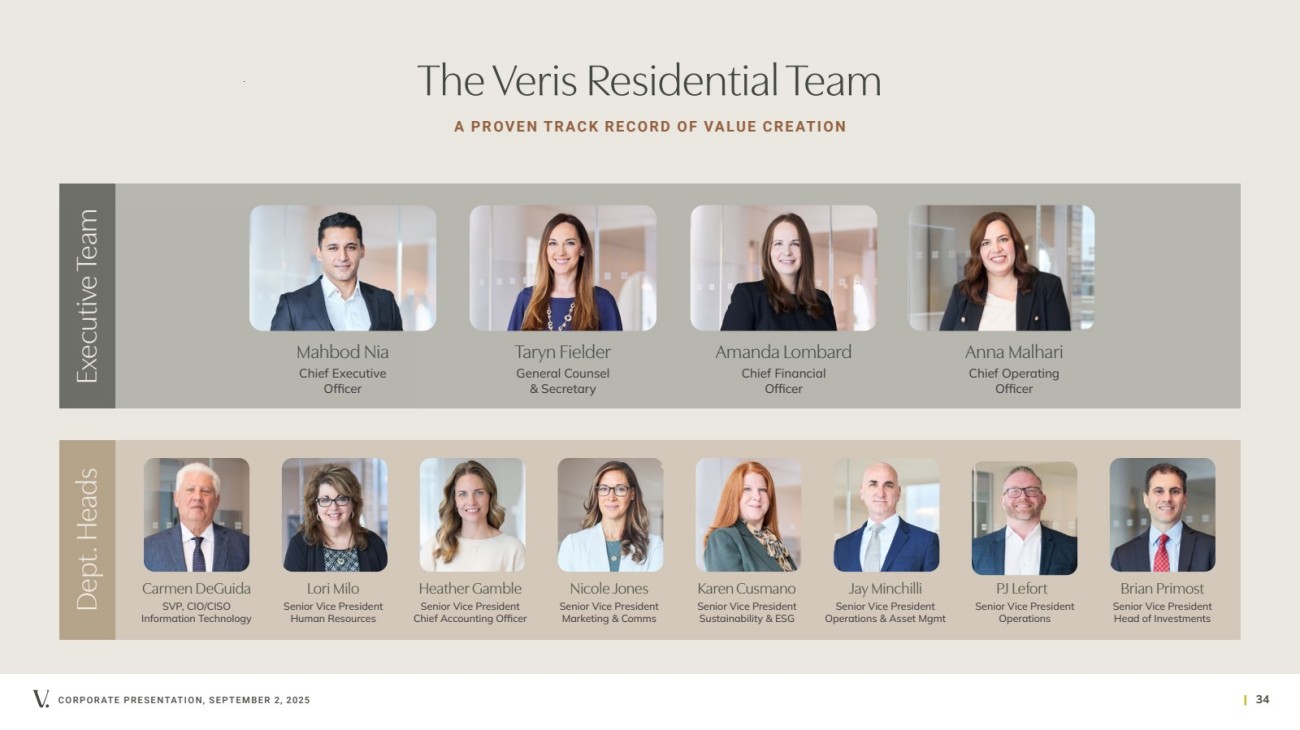
| CORPORATE PRESENTATION, SEPTEMBER 2, 2025 | 34 The Veris Residential Team Executive Team Dept. Heads Mahbod Nia Taryn Fielder Amanda Lombard Anna Malhari Chief Executive Officer General Counsel & Secretary Chief Financial Officer Chief Operating Officer Carmen DeGuida Lori Milo Karen Cusmano PJ Lefort SVP, CIO/CISO Information Technology Senior Vice President Human Resources Senior Vice President Sustainability & ESG Senior Vice President Operations Senior Vice President Operations & Asset Mgmt Nicole Jones Senior Vice President Marketing & Comms Jay Minchilli Brian Primost Senior Vice President Head of Investments A PROVEN TRACK RECORD OF VALUE CREATION Heather Gamble Senior Vice President Chief Accounting Officer |
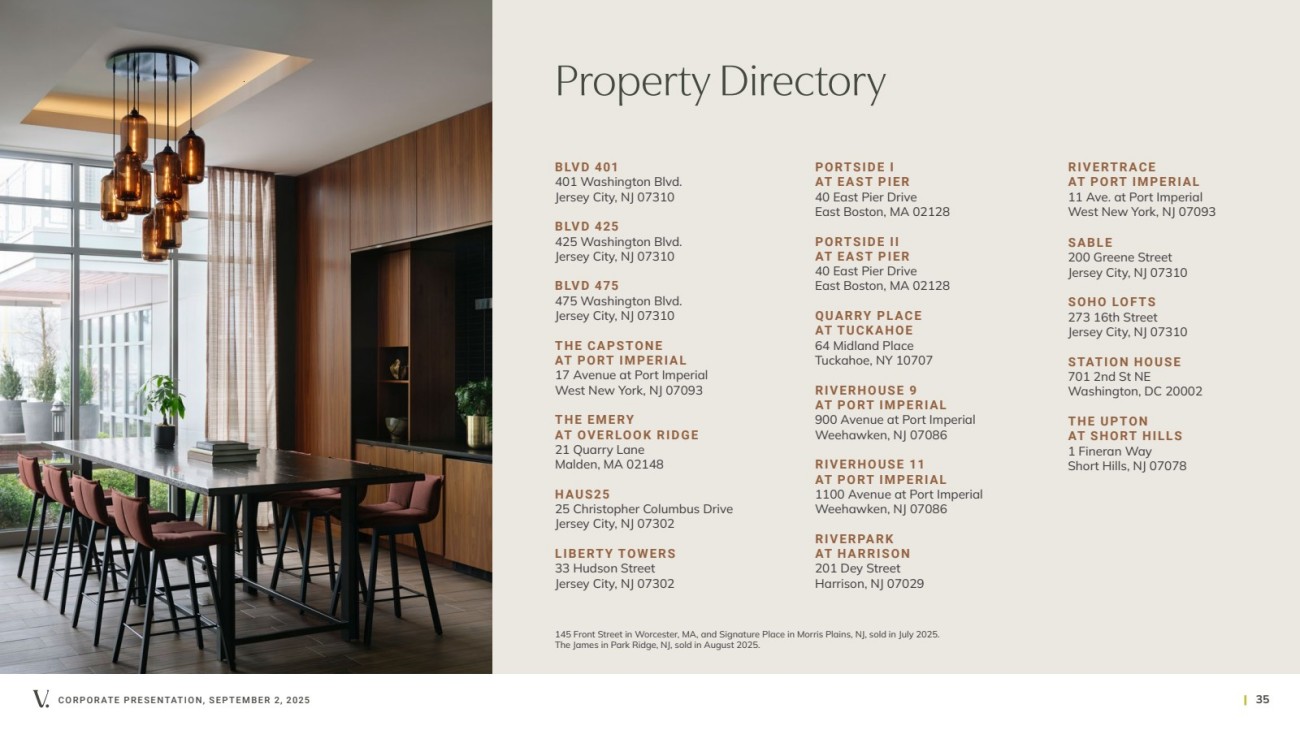
| CORPORATE PRESENTATION, SEPTEMBER 2, 2025 | 35 Property Directory BLVD 401 401 Washington Blvd. Jersey City, NJ 07310 BLVD 425 425 Washington Blvd. Jersey City, NJ 07310 BLVD 475 475 Washington Blvd. Jersey City, NJ 07310 THE CAPSTONE AT PORT IMPERIAL 17 Avenue at Port Imperial West New York, NJ 07093 THE EMERY AT OVERLOOK RIDGE 21 Quarry Lane Malden, MA 02148 HAUS25 25 Christopher Columbus Drive Jersey City, NJ 07302 LIBERTY TOWERS 33 Hudson Street Jersey City, NJ 07302 PORTSIDE I AT EAST PIER 40 East Pier Drive East Boston, MA 02128 PORTSIDE II AT EAST PIER 40 East Pier Drive East Boston, MA 02128 QUARRY PLACE AT TUCKAHOE 64 Midland Place Tuckahoe, NY 10707 R I V E R H O U S E 9 AT PORT IMPERIAL 900 Avenue at Port Imperial Weehawken, NJ 07086 RIVERHOUSE 11 AT PORT IMPERIAL 1100 Avenue at Port Imperial Weehawken, NJ 07086 RIVERPARK AT HARRISON 201 Dey Street Harrison, NJ 07029 RIVERTRACE AT PORT IMPERIAL 11 Ave. at Port Imperial West New York, NJ 07093 SABLE 200 Greene Street Jersey City, NJ 07310 SOHO LOFTS 273 16th Street Jersey City, NJ 07310 STATION HOUSE 701 2nd St NE Washington, DC 20002 THE UPTON AT SHORT HILLS 1 Fineran Way Short Hills, NJ 07078 145 Front Street in Worcester, MA, and Signature Place in Morris Plains, NJ, sold in July 2025. The James in Park Ridge, NJ, sold in August 2025. |
| CORPORATE PRESENTATION, SEPTEMBER 2, 2025 | 36 Definitions AV E R A G E E F F E CT I V E M O N T H LY R E N T P E R H O M E represents the average effective rent (net of concessions) for in-place leases and the market rent for vacant homes. BLENDED NET RENTAL GROWTH RATE combines new lease and renewal lease growth rates. New lease growth rate refers to the difference in rent a new occupant of a unit is paying compared to the rent the unit’s previous occupant was paying on a net effective basis. Renewal lease growth rate refers to the increase or decrease in monthly rent in a renewed lease compared to the previous lease on a net effective basis. CORE FFO AND ADJUSTED FFO (“AFFO”) Core FFO is defined as FFO, as adjusted for certain items to facilitate comparative measurement of the Company’s performance over time. Core FFO is presented solely as supplemental disclosure that the Company’s management believes provides useful information to investors and analysts of its results, after adjusting for certain items to facilitate comparability of its performance from period to period. Core FFO is a non-GAAP financial measure that is not intended to represent cash flow and is not indicative of cash flows provided by operating activities as determined in accordance with GAAP. As there is not a generally accepted definition established for Core FFO, the Company’s Core FFO may not be comparable to the Core FFO reported by other REITs. A reconciliation of net income per share to Core FFO and Adjusted FFO in dollars and per share are included in the financial tables accompanying our quarterly and annual filings. N E T D E BT-TO-E B I T D A (N O R M A L I Z E D) Adjusted Earnings Before Interest, Tax, Depreciation and Amortization (Normalized) (Adjusted EBTIDA (Normalized)): The Company defines Adjusted EBITDA (Normalized) as Adjusted EBITDA, adjusted to reflect the effects of non-recurring property transactions. In the case of acquisition properties, Adjusted EBITDA (Normalized) would be calculated based on Adjusted EBITDA plus the Company’s income (loss) for its ownership period annualized and included on a trailing twelve month basis. In the case of disposition properties, Adjusted EBITDA (Normalized) would be calculated based on Adjusted EBITDA minus the disposition property’s actual income (loss) on a trailing twelve-month basis. In the case of joint venture transaction properties whereby the Company acquires a controlling interest and subsequently consolidates the acquired asset, Adjusted EBITDA (Normalized) would be calculated based on Adjusted EBITDA plus the actual income (loss) on a trailing twelve-month basis in proportion to the Company’s economic interests in the joint venture as of the reporting date, minus recurring joint venture distributions (the Company’s practice for EBITDA recognition for joint ventures). The Company presents Adjusted EBITDA (Normalized) because the Company believes that Adjusted EBITDA (Normalized) provides a more appropriate denominator for its calculation of the Net Debt-to-EBITDA ratio, as it reflects the leverage profile of the Company as of the reporting date. Adjusted EBITDA (Normalized) should not be considered as an alternative to net income (determined in accordance with GAAP), as an indication of the Company’s financial performance, as an alternative to net cash flows from operating activities (determined in accordance with GAAP) or as a measure of the Company’s liquidity. NET OPERATING INCOME (NOI) represents total revenues less total operating expenses, as reconciled to net income above. The Company considers NOI to be a meaningful non-GAAP financial measure for making decisions and assessing unlevered performance of its property types and markets as it relates to total return on assets, as opposed to levered return on equity. As properties are considered for sale and acquisition based on NOI estimates and projections, the Company utilizes this measure to make investment decisions, as well as compare the performance of its assets to those of its peers. NOI should not be considered a substitute for net income, and the Company’s use of NOI may not be comparable to similarly titled measures used by other companies. The Company calculates NOI before any allocations to non-controlling interests, as those interests do not affect the overall performance of the individual assets being measured and assessed. ORA™ score is an aggregate compilation of a property’s ratings across various review sites. Each month, J Turner Research monitors the online ratings of properties nationwide. Using a statistical model, a single score based on a scale of 0 to 100 is assigned to each property. SAME STORE includes properties that were owned for the entirety of the years being compared and exclude properties under redevelopment or development and properties acquired, sold or classified as held for sale during the years being compared. |
| Thank You |