| Corporate Presentation JUNE 2, 2025 |
| CORPORATE PRESENTATION, JUNE 2, 2025 | 2 THIS OPERATING AND FIN ANCI AL DATA SHOULD BE READ IN CONNECTION W IT H O U R Q U A RT E R LY R E P O RT O N F O R M 1 0-Q F O R T H E Q U A RT E R E N D E D MARCH 31, 2025. Statements made in this presentation may be forward-looking statements within the mean-ing of Section 21E of the Securities Exchange Act of 1934, as amended. Such forward-look-ing statements are intended to be covered by the safe harbor provisions for forward-looking statements contained in Section 21E of such act. Such forward-looking statements relate to, without limitation, our future economic performance, plans and objectives for future operations and projections of revenue and other financial items. Forward-looking statements can be iden-tified by the use of words such as “may,” “will,” “plan,” “potential,” “projected,” “should,” “ex-pect,” “anticipate,” “estimate,” “target,” “continue” or comparable terminology. Forward-looking statements are inherently subject to certain risks, trends and uncertainties, many of which we cannot predict with accuracy and some of which we might not even anticipate. Although we believe that the expectations reflected in such forward-looking statements are based upon reasonable assumptions at the time made, we can give no assurance that such expectations will be achieved. Future events and actual results, financial and otherwise, may differ materi-ally from the results discussed in the forward-looking statements. Readers are cautioned not to place undue reliance on these forward-looking statements and are advised to consider the factors listed above together with the additional factors under the heading “Disclosure Regard-ing Forward-Looking Statements” and “Risk Factors” in our annual reports on Form 10-K, as may be supplemented or amended by our quarterly reports on Form 10-Q, which are incorpo-rated herein by reference. We assume no obligation to update or supplement forward-looking statements that become untrue because of subsequent events, new information or otherwise. Forward-Looking Statements Forward-Looking Statements |
| CORPORATE PRESENTATION, JUNE 2, 2025 | 3 Our Vision To continuously innovate and transform residential living by creating exceptional spaces where residents thrive and feel truly at home, while positively impacting the communities we serve. Our Mission To deliver comprehensive residential solutions that blend luxury, energy efficiency and thoughtful design. Through our commitment to excellence in development and management, we create lasting value for our residents while fostering vibrant, connected communities. Overview |
| Veris At-A-Glance CORPORATE PRESENTATION, JUNE 2, 2025 Overview | 4 93.9%2,3 OCCUPANCY RATE $333,664 4.4% 4 AVERAGE HOUSEHOLD INCOME PER UNIT BLENDED NET RENTAL GROWTH RATE Q2 QTD 10 Years 7,491 1 AVERAGE AGE OF PROPERTY APARTMENT UNITS 1. The Metropolitan at 40 Park, which sold in April, comprised 130 units. As of March 31, 2025, Veris had 22 residential buildings and 7,621 apartment units. 2. Average as of May 22, 2025. 3. 95.4% excluding Liberty Towers. 4. Blended net rental growth rate YTD through May 22 was 3.0%. 3.2% 21 1 RESIDENTIAL BUILDINGS 12.9% AV E R AG E R E NT-TO-I N C O M E RATIO 2025 NOI GROWTH YTD YOY |

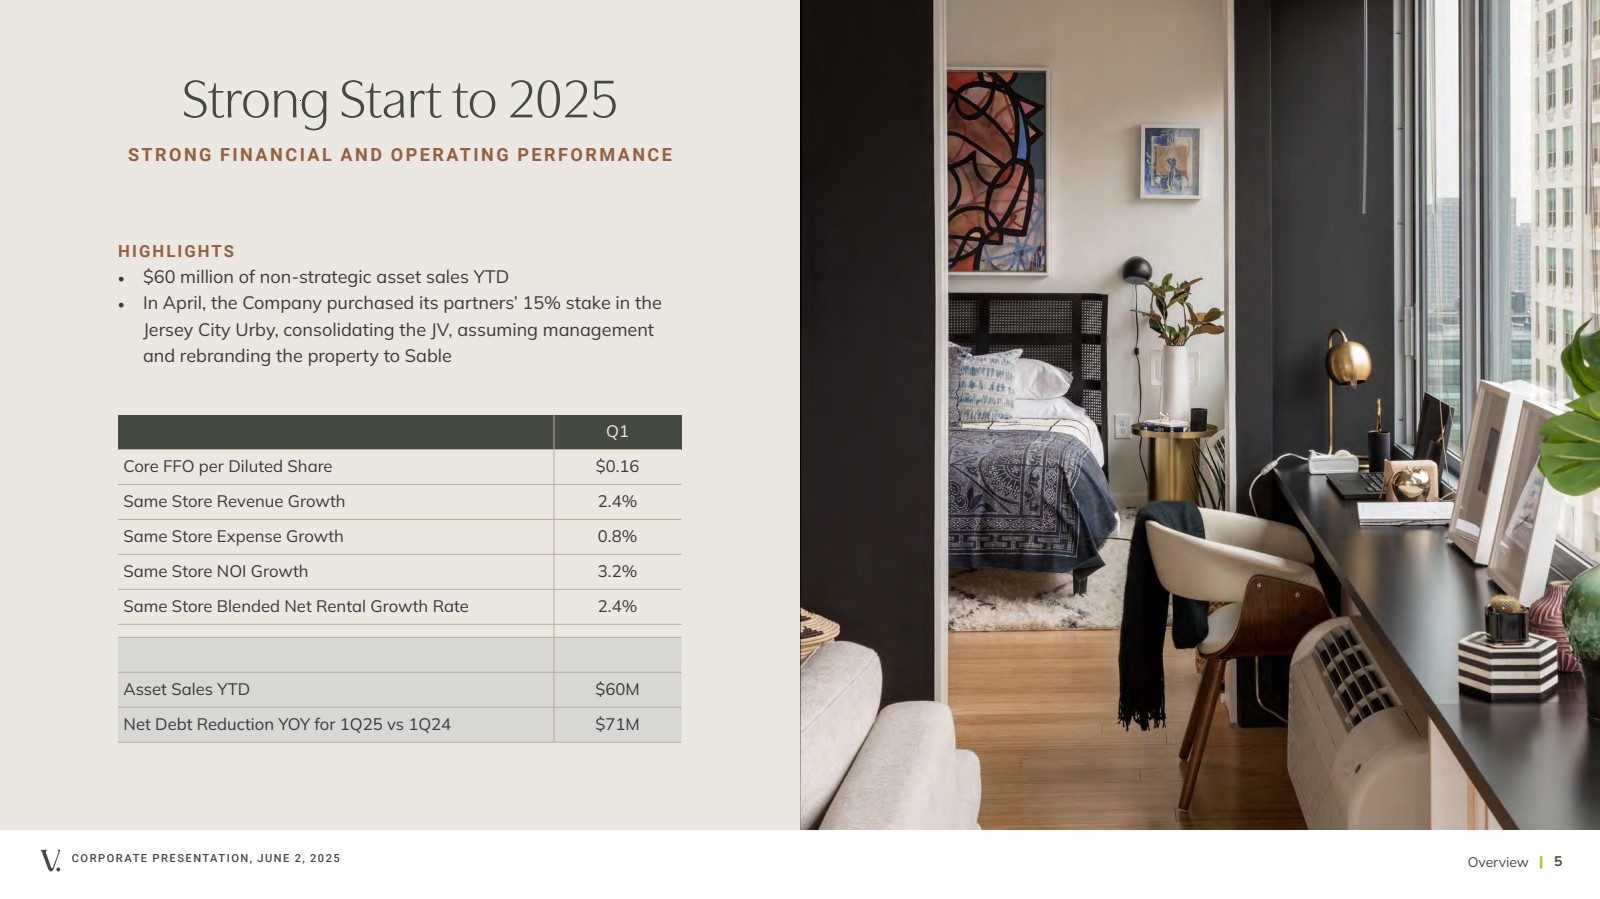
| CORPORATE PRESENTATION, JUNE 2, 2025 | 5 Strong Start to 2025 Overview HIGHLIGHTS • $60 million of non-strategic asset sales YTD • In April, the Company purchased its partners’ 15% stake in the Jersey City Urby, consolidating the JV, assuming management and rebranding the property to Sable Q1 Core FFO per Diluted Share $0.16 Same Store Revenue Growth 2.4% Same Store Expense Growth 0.8% Same Store NOI Growth 3.2% Same Store Blended Net Rental Growth Rate 2.4% Asset Sales YTD $60M Net Debt Reduction YOY for 1Q25 vs 1Q24 $71M STRONG FINANCIAL AND OPERATING PERFORMANCE |
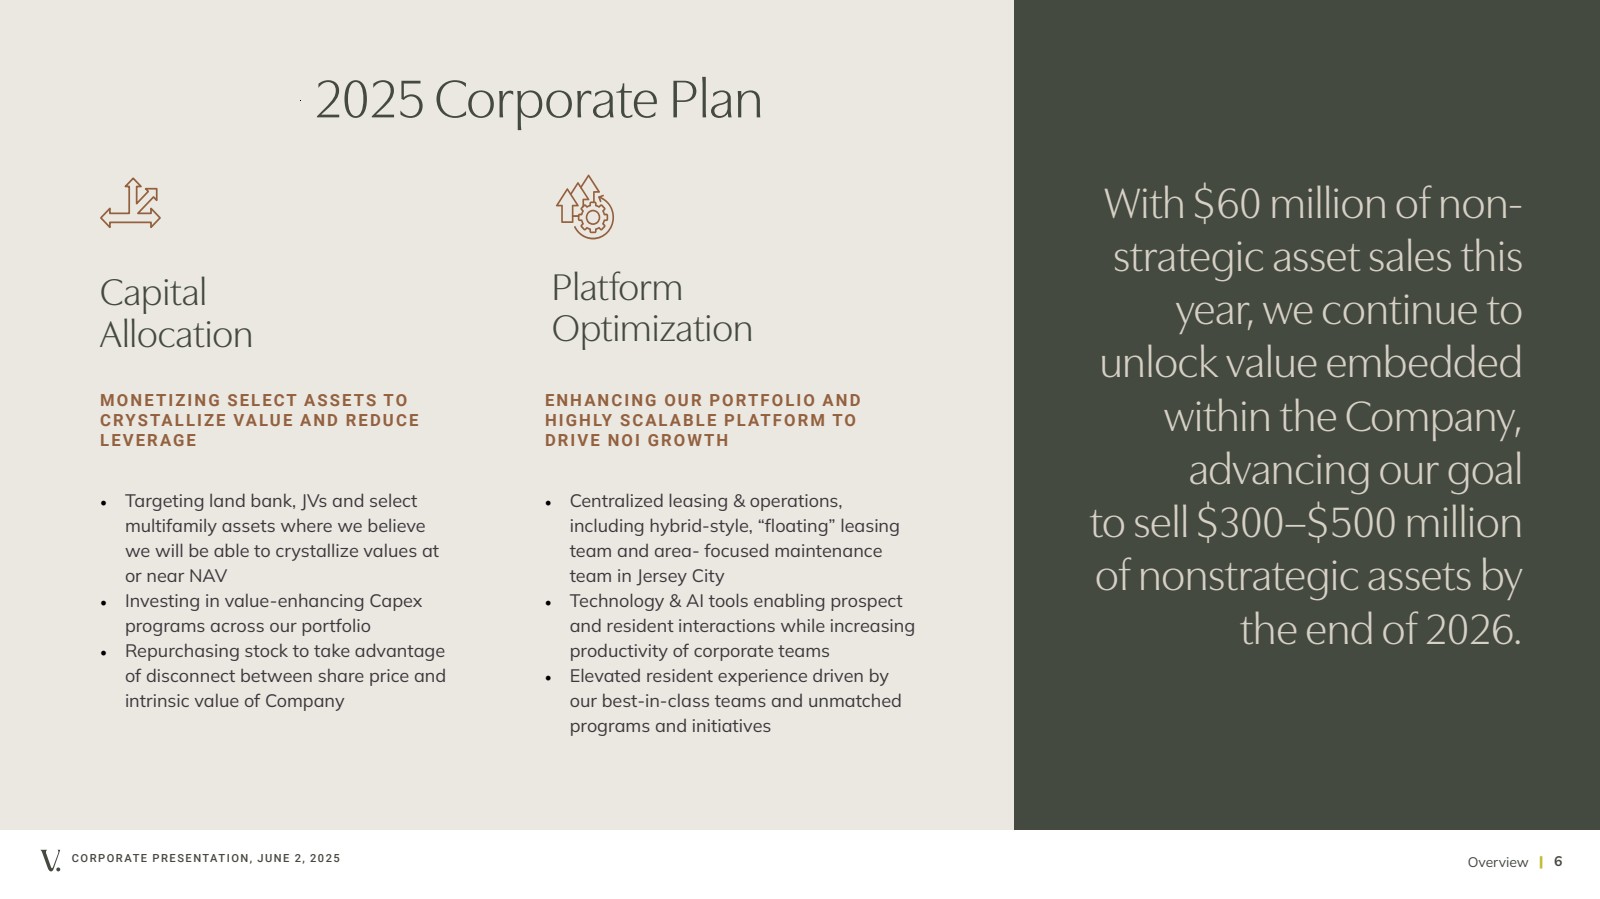
| CORPORATE PRESENTATION, JUNE 2, 2025 | 6 2025 Corporate Plan Platform Optimization Capital Allocation Overview • Targeting land bank, JVs and select multifamily assets where we believe we will be able to crystallize values at or near NAV • Investing in value-enhancing Capex programs across our portfolio • Repurchasing stock to take advantage of disconnect between share price and intrinsic value of Company With $60 million of non-strategic asset sales this year, we continue to unlock value embedded within the Company, advancing our goal to sell $300–$500 million of nonstrategic assets by the end of 2026. ENHANCING OUR PORTFOLIO AND H I G H LY S C A L A B L E P L AT F O R M TO DRIVE NOI GROWTH MONETIZING SELECT ASSETS TO CRYSTALLIZE VALUE AND REDUCE LEVERAGE • Centralized leasing & operations, including hybrid-style, “floating” leasing team and area- focused maintenance team in Jersey City • Technology & AI tools enabling prospect and resident interactions while increasing productivity of corporate teams • Elevated resident experience driven by our best-in-class teams and unmatched programs and initiatives |
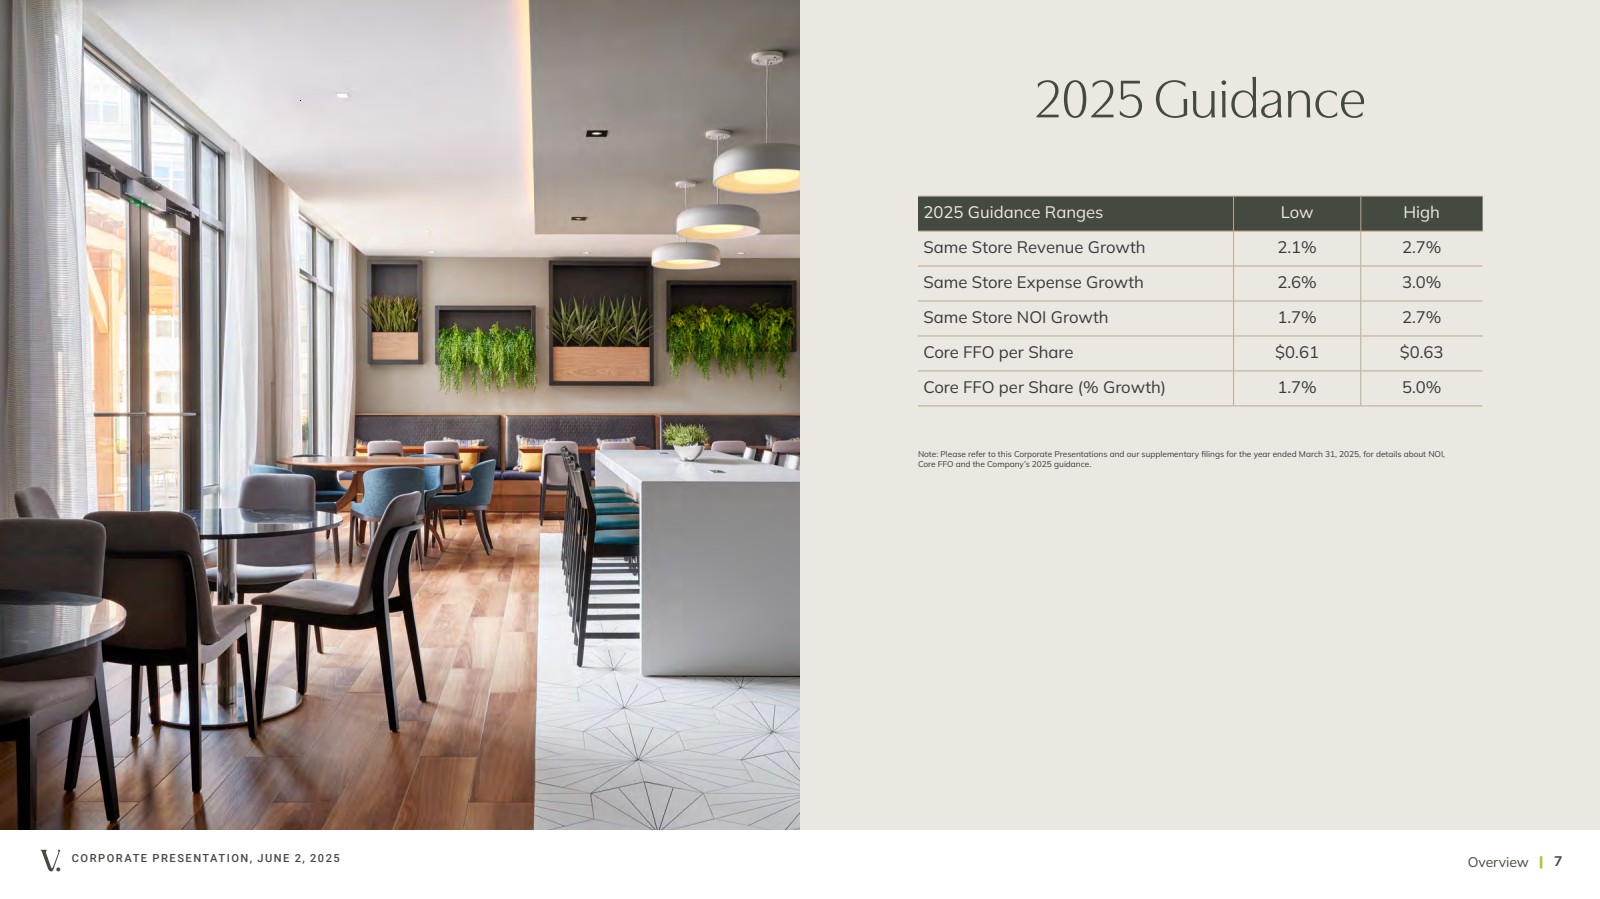
| CORPORATE PRESENTATION, JUNE 2, 2025 Overview | 7 2025 Guidance 2025 Guidance Ranges Low High Same Store Revenue Growth 2.1% 2.7% Same Store Expense Growth 2.6% 3.0% Same Store NOI Growth 1.7% 2.7% Core FFO per Share $0.61 $0.63 Core FFO per Share (% Growth) 1.7% 5.0% Note: Please refer to this Corporate Presentations and our supplementary filings for the year ended March 31, 2025, for details about NOI, Core FFO and the Company’s 2025 guidance. |
| CORPORATE PRESENTATION, JUNE 2, 2025 | 8 Our Vision Our Vision |

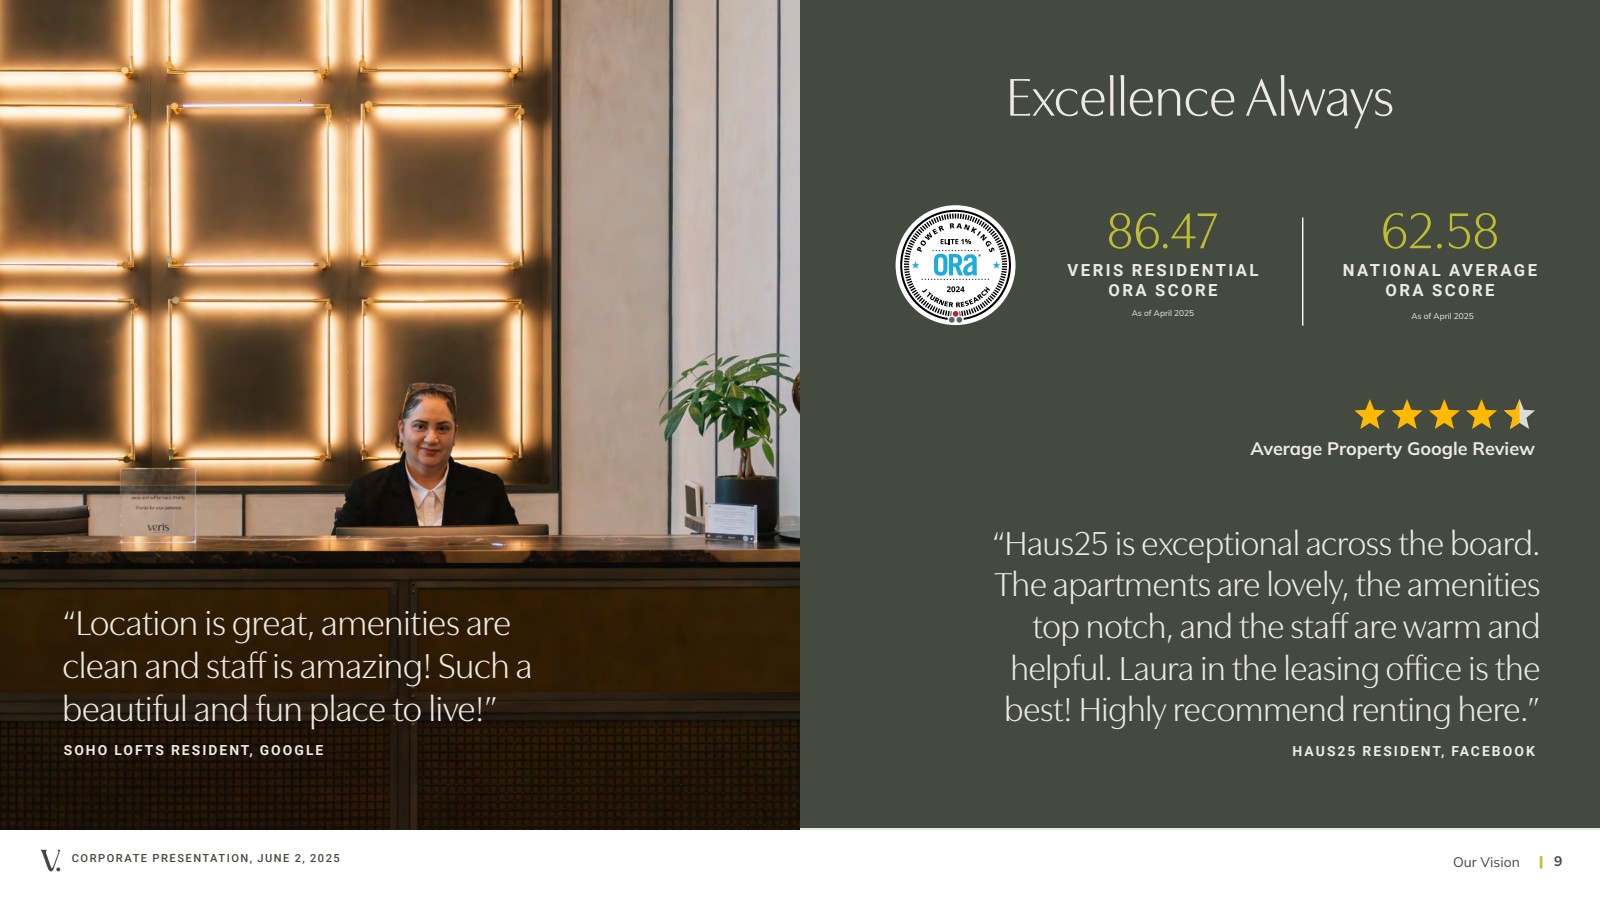
| CORPORATE PRESENTATION, JUNE 2, 2025 | 9 Excellence Always As of April 2025 Average Property Google Review 86.47 VERIS RESIDENTIAL ORA SCORE 62.58 NATIONAL AVERAGE ORA SCORE As of April 2025 “Haus25 is exceptional across the board. The apartments are lovely, the amenities top notch, and the staff are warm and helpful. Laura in the leasing office is the best! Highly recommend renting here.” H A U S 2 5 R E S I D E N T, FA C E B O O K “Location is great, amenities are clean and staff is amazing! Such a beautiful and fun place to live!” S O H O LO F T S R E S I D E N T, G O O G L E Our Vision |
| CORPORATE PRESENTATION, JUNE 2, 2025 | 10 Our Competitive Advantage Class A Portfolio Newest Portfolio | Unparalleled Amenity Offering Highest Average Rent & Growth Rate Desirable Northeast Markets with Limited New Supply Leading Operating Platform Vertically Integrated & Highly Scalable | Customer Experience Focused Innovative Use of Technology & AI Significant Capital Allocation Opportunities to Drive Growth Unconsolidated Joint Ventures | Landbank | Value-Add Programs Experienced Team Management with Proven Track Record Seasoned Board | Best-in-Class Governance Focused on the Creation and Crystallization of Shareholder Value Our Vision |

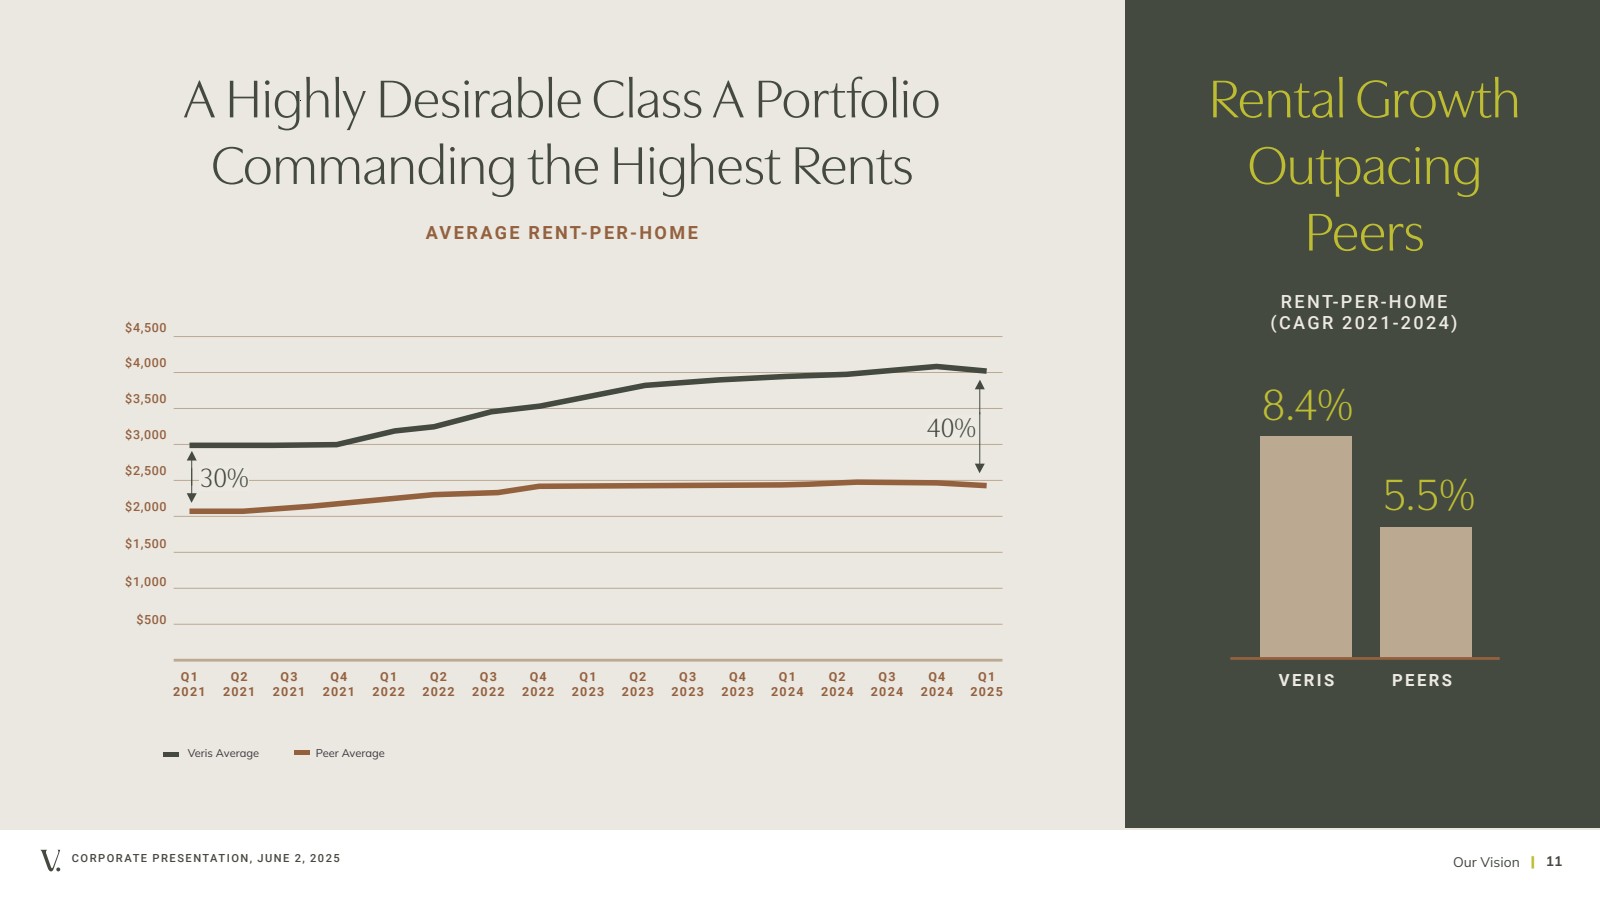
| CORPORATE PRESENTATION, JUNE 2, 2025 | 11 A Highly Desirable Class A Portfolio Commanding the Highest Rents AV E R A G E R E NT-P E R-H O M E 8.4% 5.5% Rental Growth Outpacing Peers VERIS PEERS R E NT-P E R-H O M E (CAGR 2021-2024) Q1 2021 Q2 2021 Q3 2021 Q4 2021 Q1 2022 Q2 2022 Q3 2022 Q4 2022 Q1 2023 Q2 2023 Q3 2023 Q4 2023 Q1 2024 Q2 2024 Q3 2024 Q4 2024 Our Vision $500 $1,000 $1,500 $2,000 $2,500 $3,000 $3,500 $4,000 $4,500 Veris Average Peer Average 30% 40% Q1 2025 |
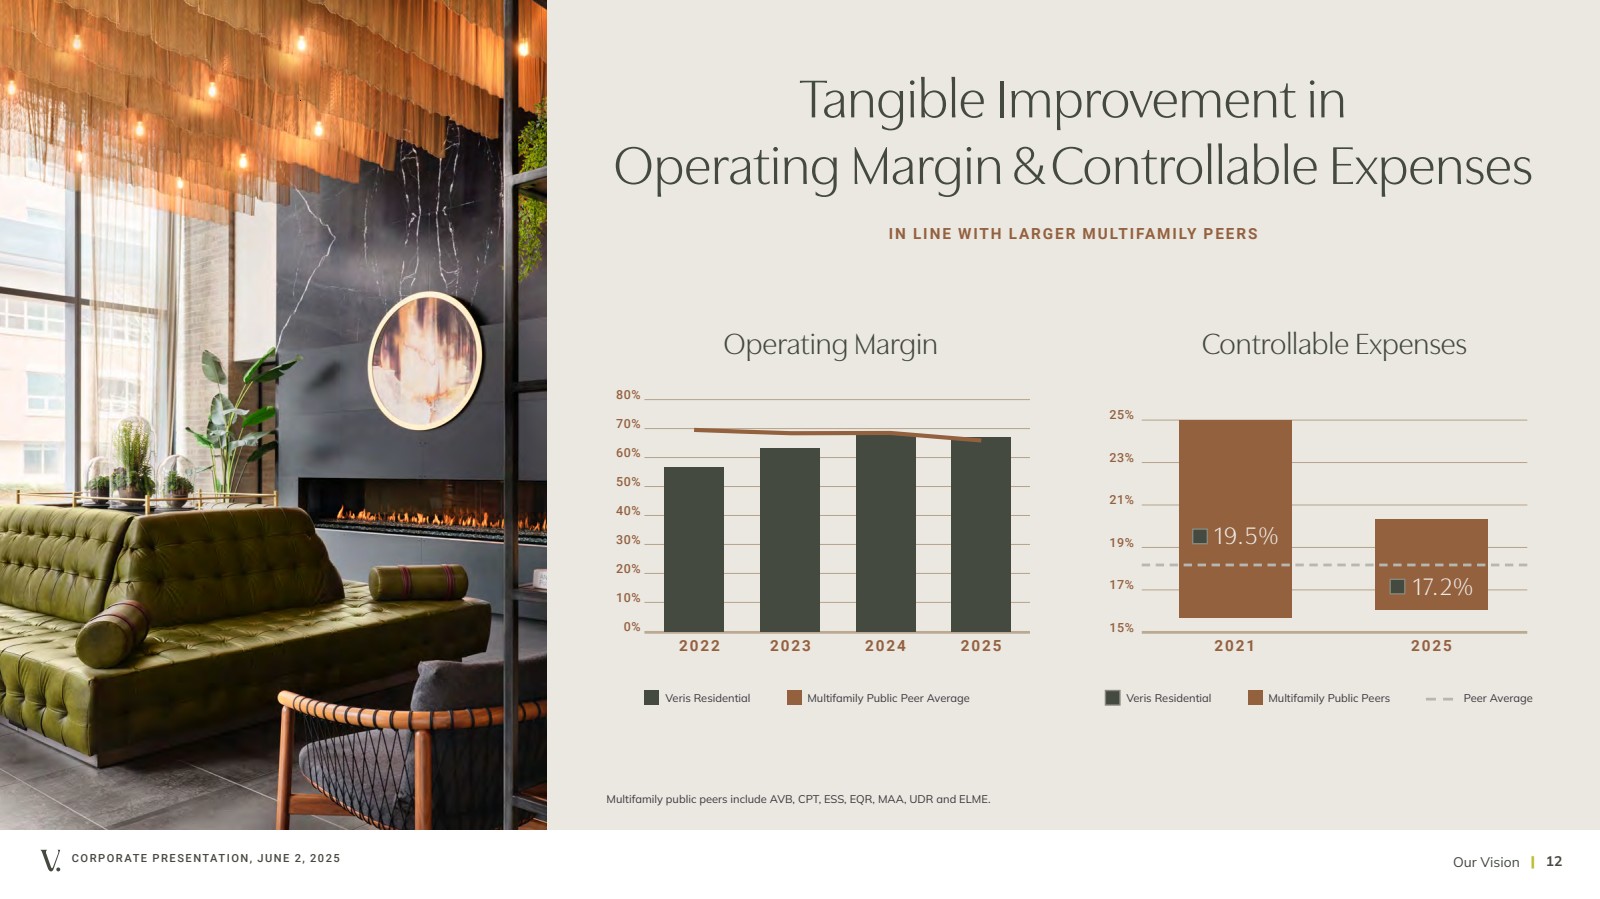
| I N L I N E W IT H L A R G E R M U LT I FA M I LY P E E R S Operating Margin Veris Residential Multifamily Public Peer Average 2022 2023 2025 15% 17% 19% 21% 23% 25% 2021 19.5% 17.2% 2025 Veris Residential Multifamily Public Peers Controllable Expenses Peer Average CORPORATE PRESENTATION, JUNE 2, 2025 | 12 10% 20% 30% 40% 50% 60% 70% 80% Tangible Improvement in Operating Margin & Controllable Expenses Our Vision 0% 2024 Multifamily public peers include AVB, CPT, ESS, EQR, MAA, UDR and ELME. |
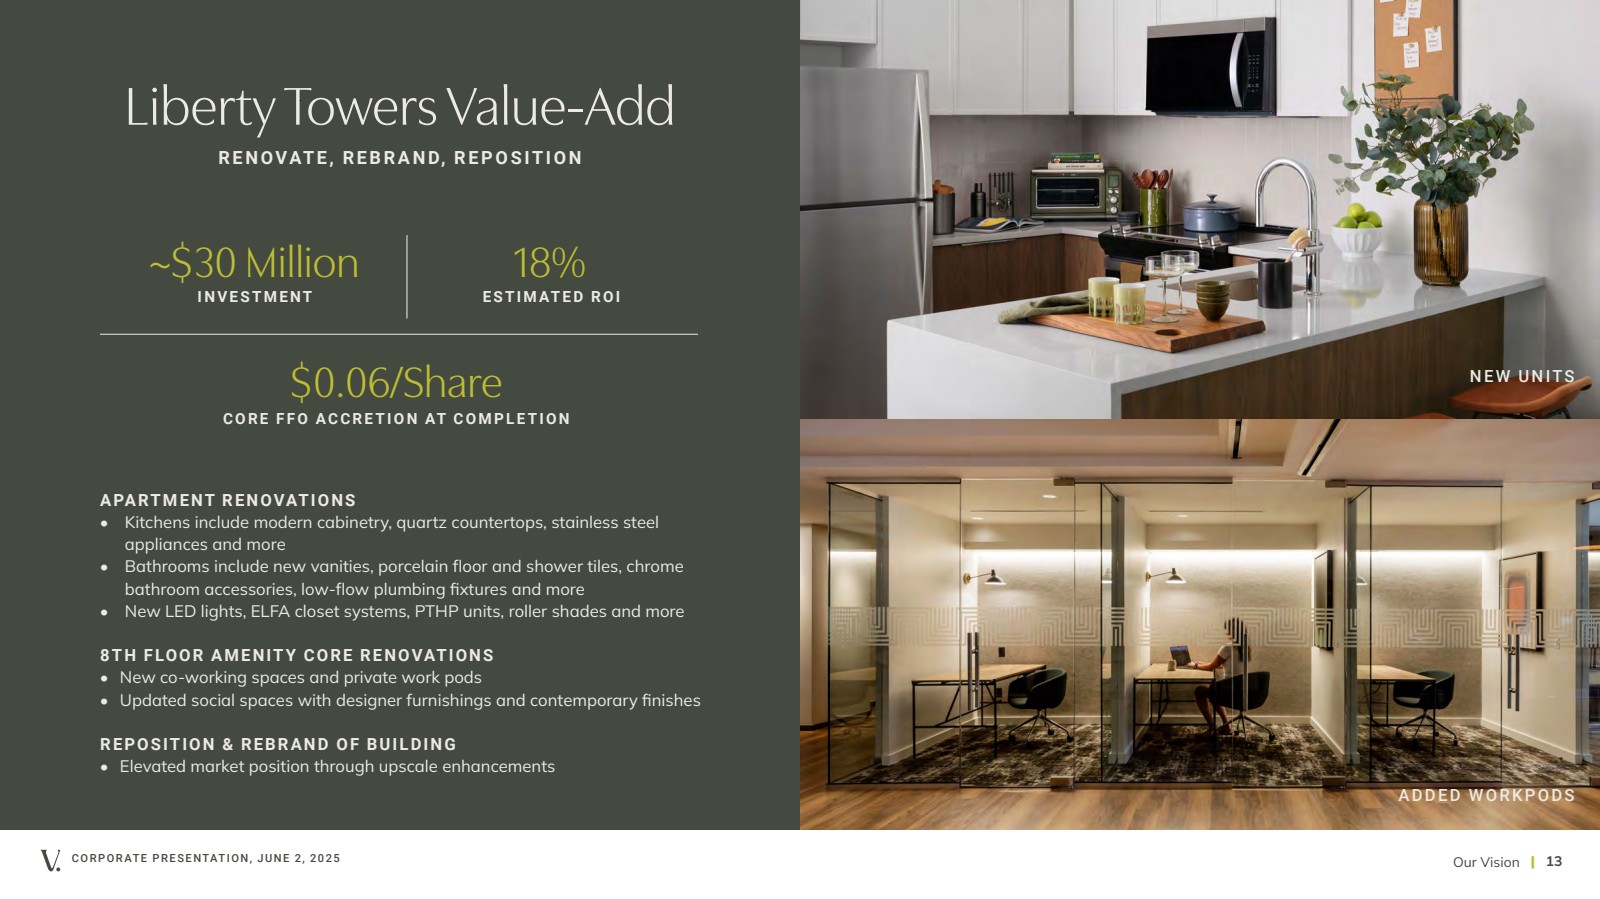
| CORPORATE PRESENTATION, JUNE 2, 2025 | 13 RENOVATE, REBRAND, REPOSITION Liberty Towers Value-Add ~$30 Million INVESTMENT 18% ESTIMATED ROI $0.06/Share CORE FFO ACCRETION AT COMPLETION APARTMENT RENOVATIONS • Kitchens include modern cabinetry, quartz countertops, stainless steel appliances and more • Bathrooms include new vanities, porcelain floor and shower tiles, chrome bathroom accessories, low-flow plumbing fixtures and more • New LED lights, ELFA closet systems, PTHP units, roller shades and more 8TH FLOOR AMENITY CORE RENOVATIONS • New co-working spaces and private work pods • Updated social spaces with designer furnishings and contemporary finishes REPOSITION & REBRAND OF BUILDING • Elevated market position through upscale enhancements Our Vision NEW UNITS ADDED WORKPODS |
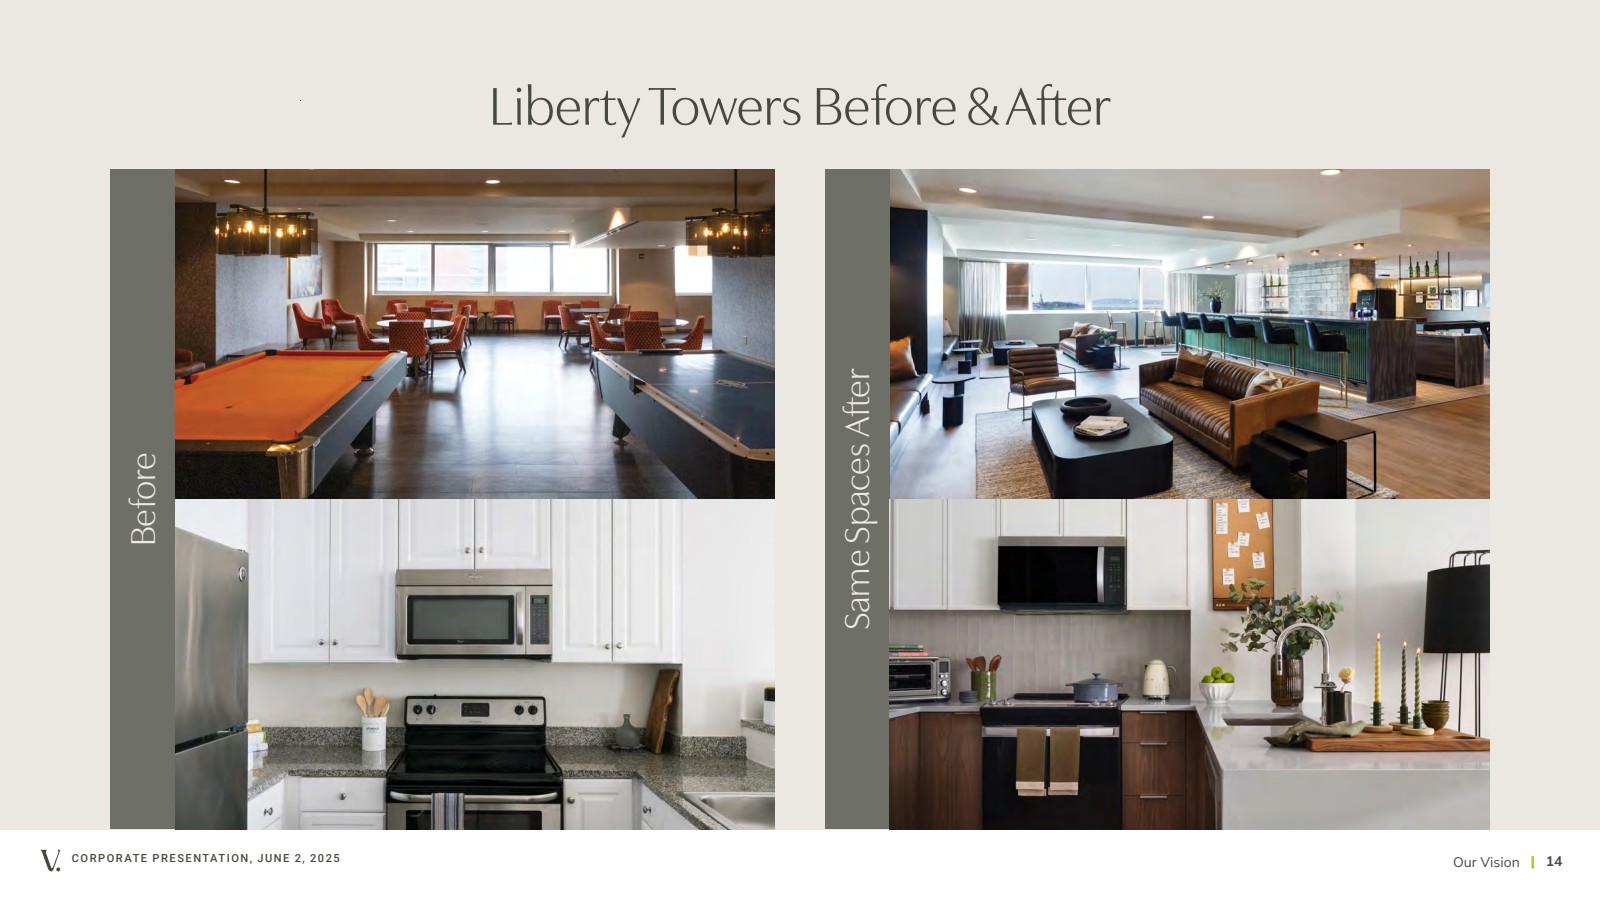
| CORPORATE PRESENTATION, JUNE 2, 2025 | 14 Liberty Towers Before & After Our Vision Before Same Spaces After |
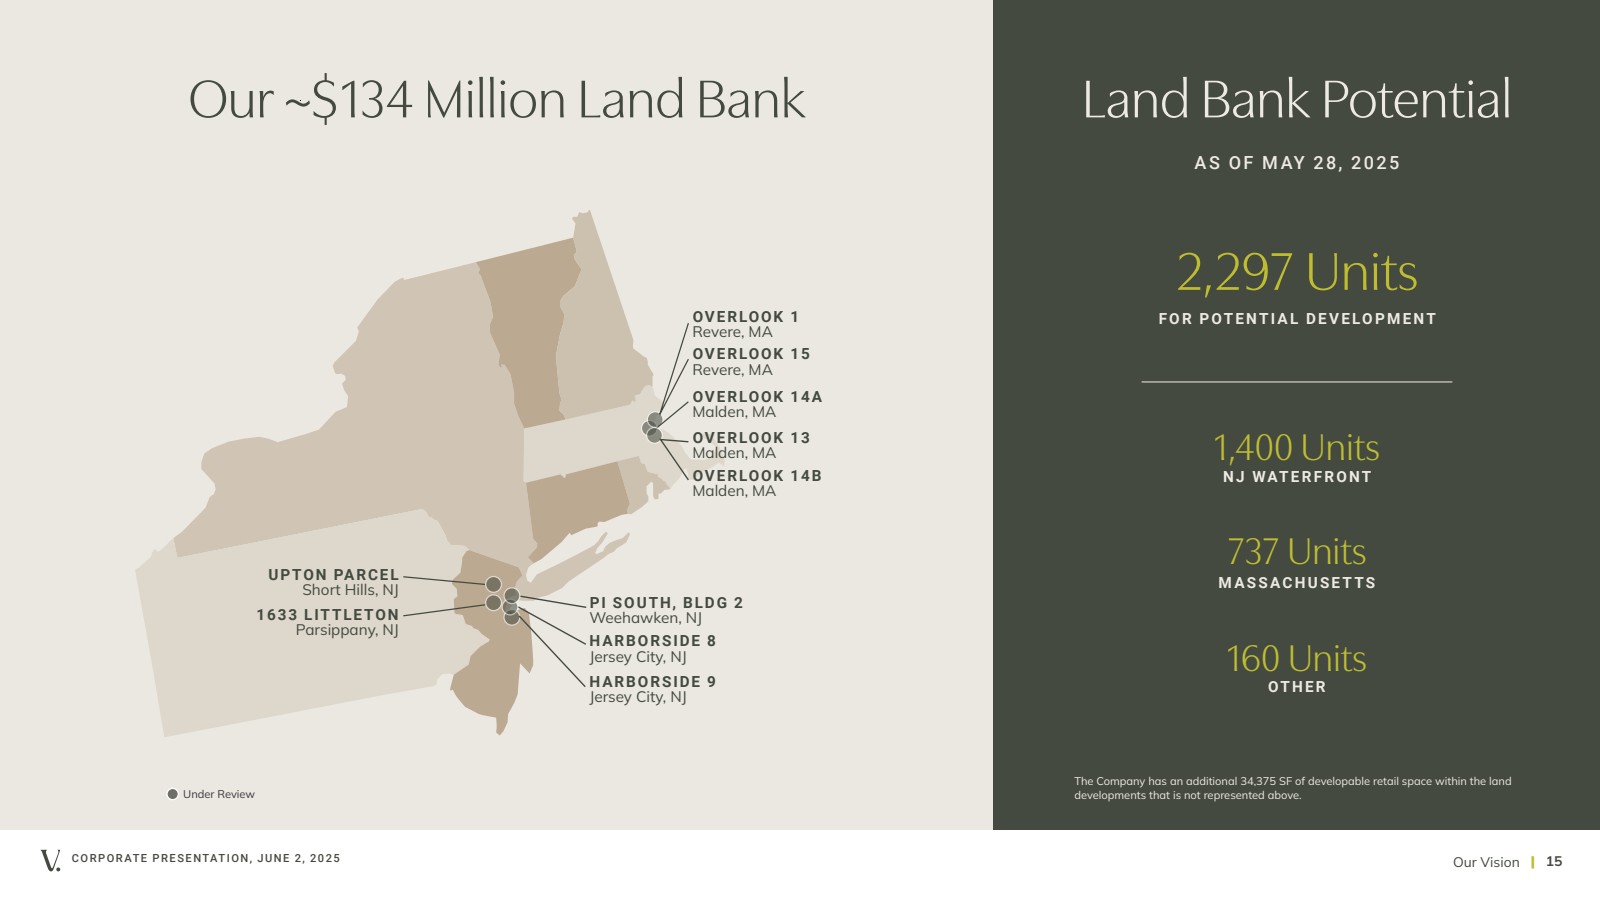
| CORPORATE PRESENTATION, JUNE 2, 2025 | 15 Land Bank Potential HARBORSIDE 8 Jersey City, NJ 2,297 Units FOR POTENTIAL DEVELOPMENT 1,400 Units NJ WATERFRONT 737 Units MASSACHUSETTS Under Review 1633 LITTLETON Parsippany, NJ UPTON PARCEL Short Hills, NJ OVERLOOK 1 Revere, MA OVERLOOK 15 Revere, MA OVERLOOK 14A Malden, MA OVERLOOK 13 Malden, MA OVERLOOK 14B Malden, MA HARBORSIDE 9 Jersey City, NJ The Company has an additional 34,375 SF of developable retail space within the land developments that is not represented above. Our Vision PI SOUTH, BLDG 2 Weehawken, NJ Our ~$134 Million Land Bank AS OF MAY 28, 2025 160 Units OTHER |
| CORPORATE PRESENTATION, JUNE 2, 2025 | 16 Introducing Our Vision Technology without people is just circuits and code—but people partnered with technology forms the foundation for sustainable value creation. Prism, powered by people + tech, is our overarching approach to purposeful technology implementation, focused on solutions that drive measurable returns rather than innovation for innovation’s sake. We use technology to amplify our human talent, transforming operational friction points into opportunities while ensuring our technology evolves with the needs of our communities and the residents who inhabit them. |

| CORPORATE PRESENTATION, JUNE 2, 2025 | 17 Market Overview Market Overview |

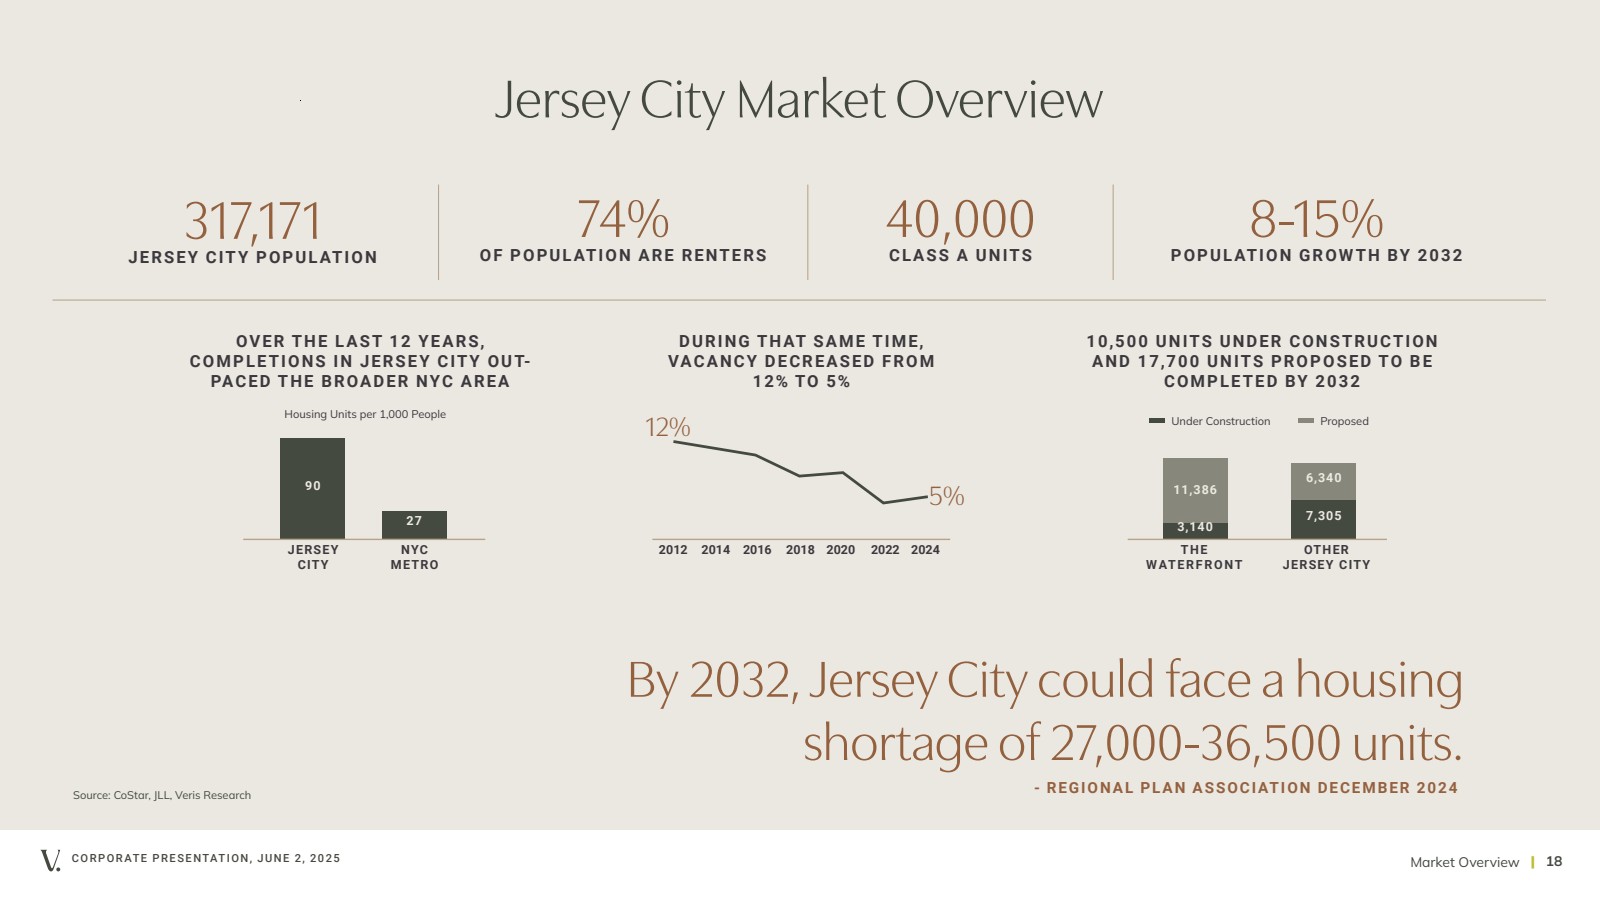
| Under Construction Proposed Housing Units per 1,000 People CORPORATE PRESENTATION, JUNE 2, 2025 | 18 Jersey City Market Overview 8-15% POPULATION GROWTH BY 2032 74% 40,000 OF POPULATION ARE RENTERS CLASS A UNITS 317,171 JERSEY CITY POPULATION By 2032, Jersey City could face a housing shortage of 27,000-36,500 units. 27 90 JERSEY CITY NYC METRO OVER THE LAST 12 YEARS, COMPLETIONS IN JERSEY CITY OUT-PACED THE BROADER NYC AREA 3,140 11,386 7,305 6,340 THE WATERFRONT OTHER JERSEY CITY 10,500 UNITS UNDER CONSTRUCTION AND 17,700 UNITS PROPOSED TO BE COMPLETED BY 2032 DURING THAT SAME TIME, VACANCY DECREASED FROM 12% TO 5% 2012 2014 2016 2018 2020 2022 2024 5% 12% Source: CoStar, JLL, Veris Research Market Overview - REGIONAL PLAN ASSOCIATION DECEMBER 2024 |
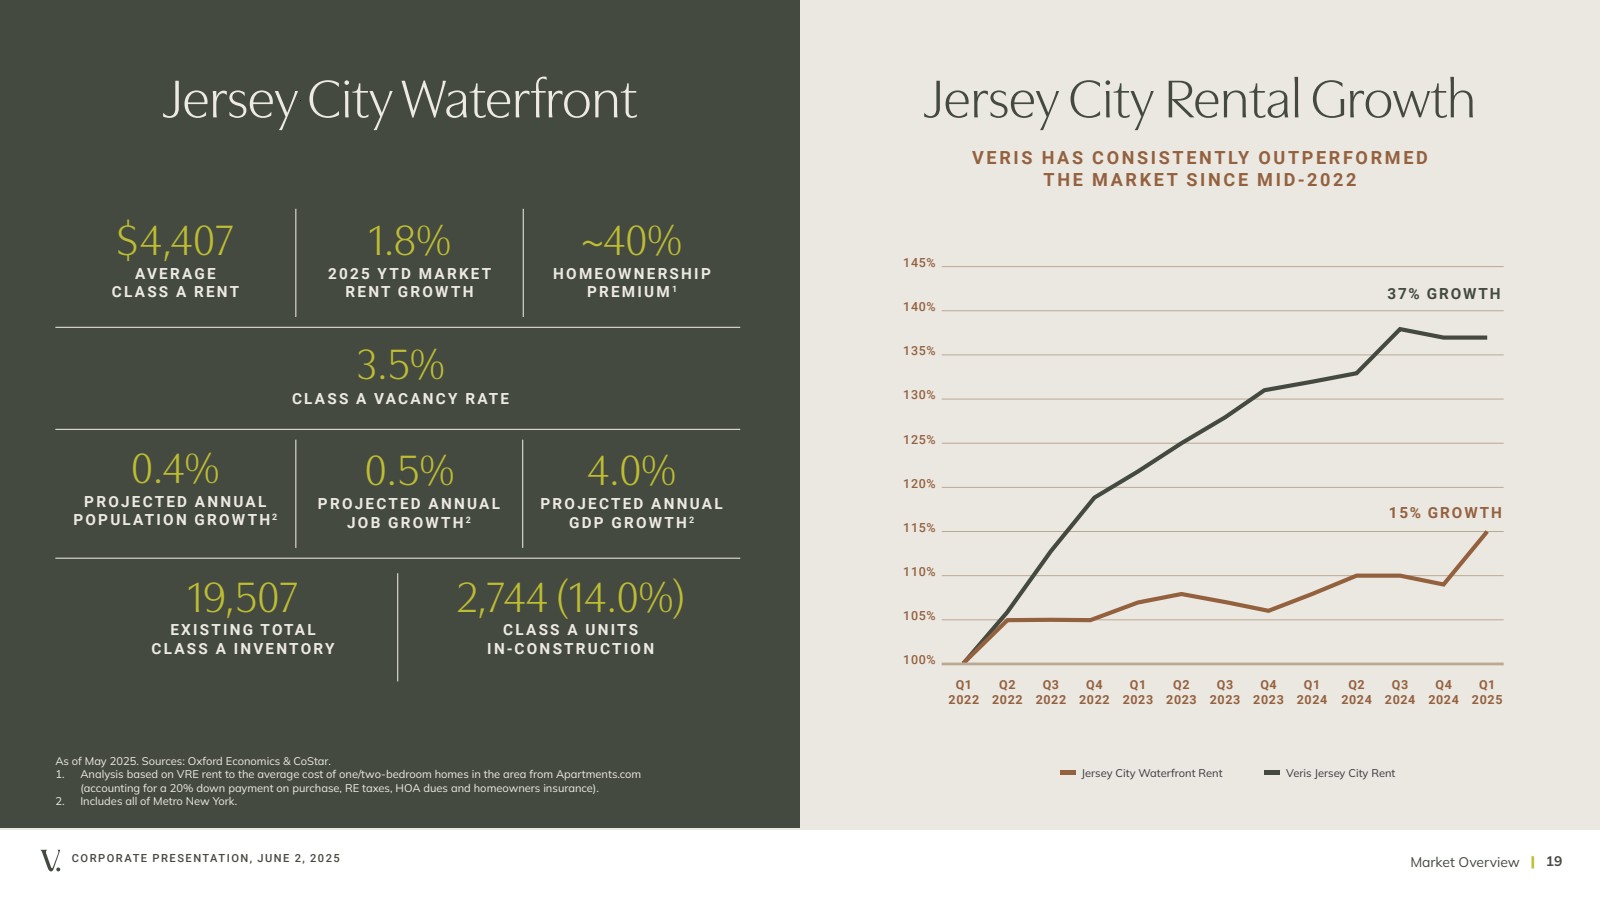
| CORPORATE PRESENTATION, JUNE 2, 2025 | 19 Jersey City Waterfront 19,507 EXISTING TOTAL CLASS A INVENTORY 3.5% CLASS A VACANCY RATE $4,407 AVERAGE CLASS A RENT ~40% HOMEOWNERSHIP PREMIUM1 0.4% PROJECTED ANNUAL POPULATION GROWTH2 0.5% PROJECTED ANNUAL JOB GROWTH2 4.0% PROJECTED ANNUAL GDP GROWTH2 2,744 (14.0%) CLASS A UNITS IN-CONSTRUCTION As of May 2025. Sources: Oxford Economics & CoStar. 1. Analysis based on VRE rent to the average cost of one/two-bedroom homes in the area from Apartments.com (accounting for a 20% down payment on purchase, RE taxes, HOA dues and homeowners insurance). 2. Includes all of Metro New York. 1.8% 2025 YTD MARKET RENT GROWTH Jersey City Rental Growth V E R I S H A S C O N S I S T E NT LY O U T P E R F O R M E D THE MARKET SINCE MID-2022 100% 105% 110% 115% 120% 125% 130% 135% 140% 145% Q1 2022 Q2 2022 Q3 2022 Q4 2022 Q1 2023 Q2 2023 Q3 2023 Q4 2023 Q1 2024 Q2 2024 Q3 2024 Q4 2024 Jersey City Waterfront Rent Portfolio Veris Jersey City Rent 37% GROWTH 15% GROWTH Market Overview Q1 2025 |
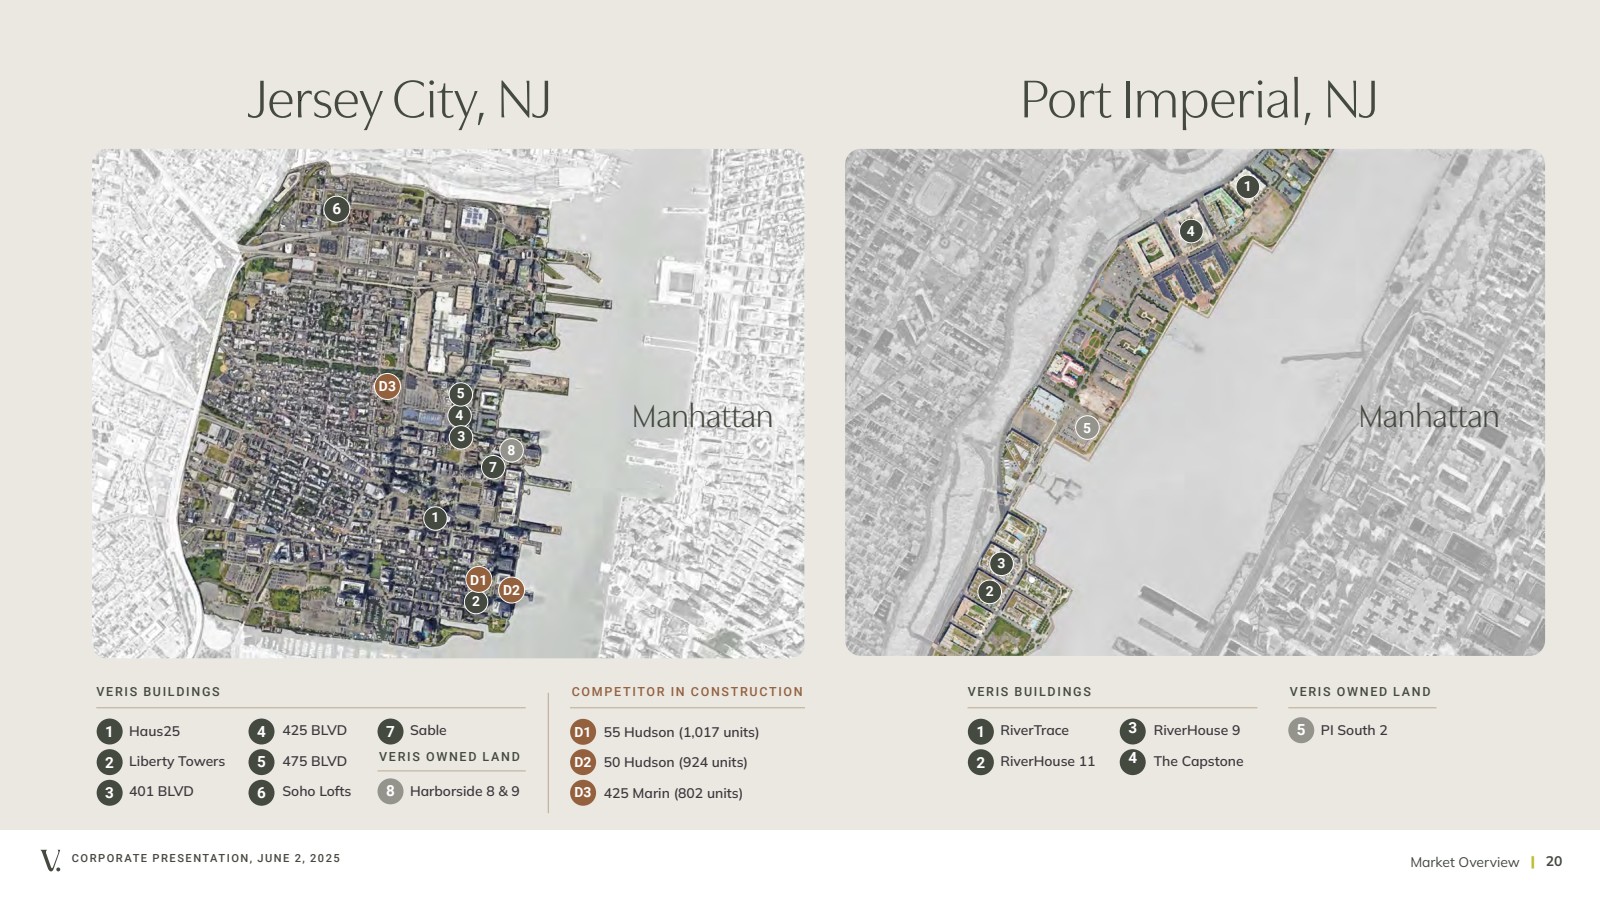
| CORPORATE PRESENTATION, JUNE 2, 2025 | 20 Manhattan Haus25 Liberty Towers 401 BLVD 425 BLVD 8 Harborside 8 & 9 1 2 4 5 3 475 BLVD Soho Lofts 6 Sable 7 8 VERIS BUILDINGS D1 55 Hudson (1,017 units) 50 Hudson (924 units) 425 Marin (802 units) VERIS OWNED LAND COMPETITOR IN CONSTRUCTION D2 D3 D2 D1 D3 1 2 3 4 5 Manhattan 1 7 2 3 4 5 6 Jersey City, NJ Port Imperial, NJ RiverTrace RiverHouse 11 RiverHouse 9 The Capstone VERIS BUILDINGS VERIS OWNED LAND 1 2 3 4 5 PI South 2 Market Overview |
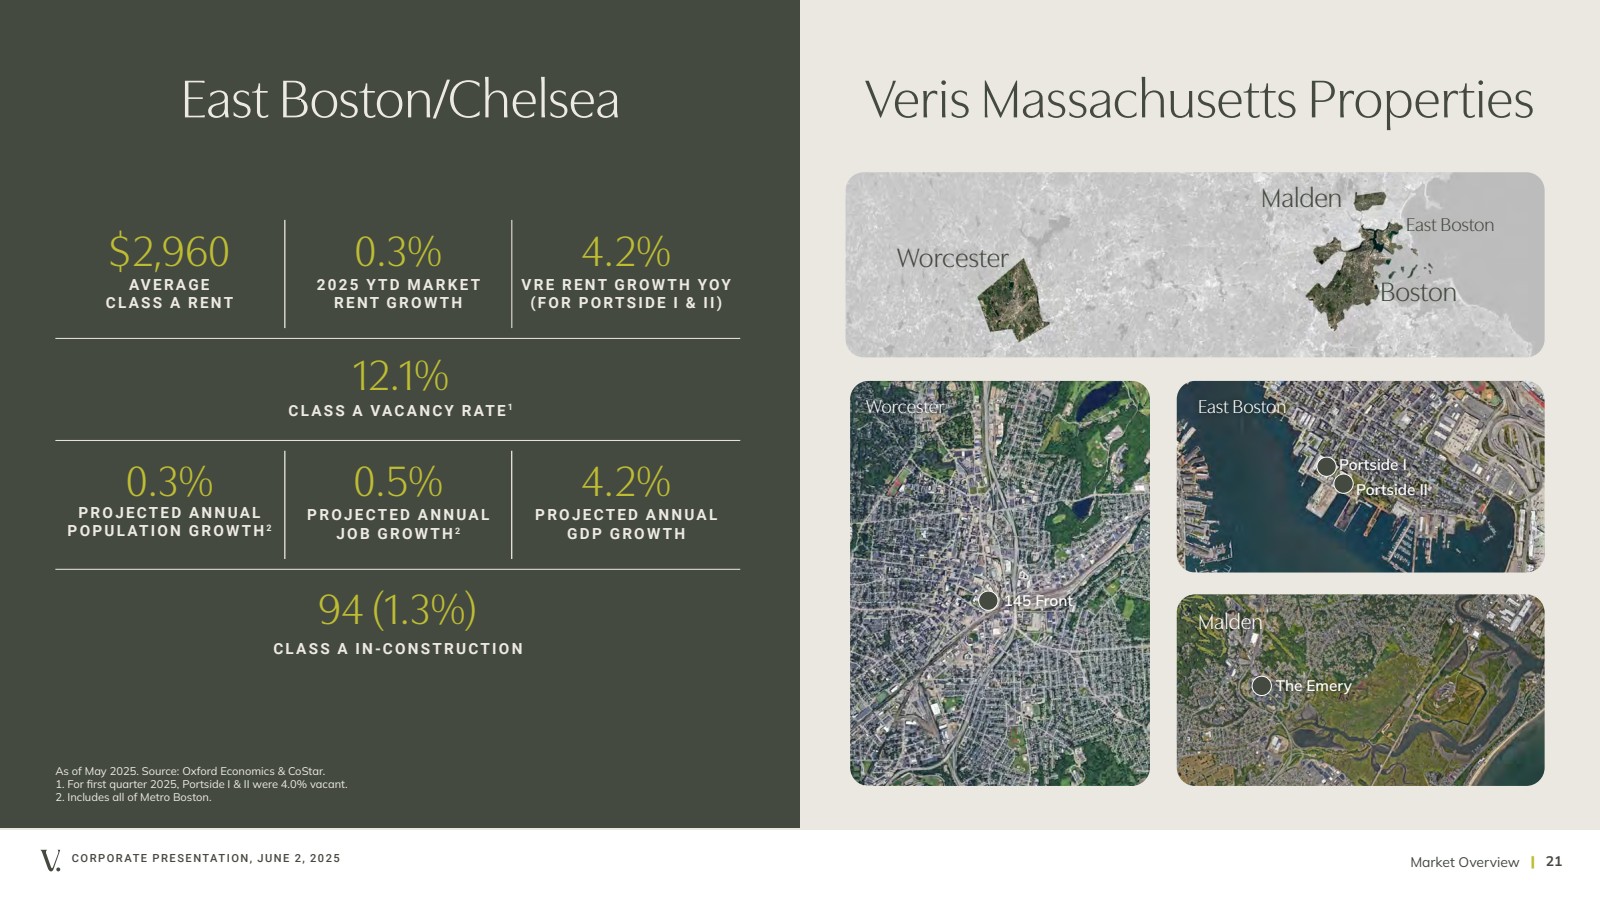
| CORPORATE PRESENTATION, JUNE 2, 2025 | 21 East Boston/Chelsea 12.1% CLASS A VACANCY RATE 1 $2,960 AVERAGE CLASS A RENT 0.3% PROJECTED ANNUAL POPULATION GROWTH2 0.5% PROJECTED ANNUAL JOB GROWTH2 4.2% PROJECTED ANNUAL GDP GROWTH 94 (1.3%) CLASS A IN-CONSTRUCTION As of May 2025. Source: Oxford Economics & CoStar. 1. For first quarter 2025, Portside I & II were 4.0% vacant. 2. Includes all of Metro Boston. Veris Massachusetts Properties Market Overview Worcester Boston Malden East Boston The Emery Malden East Boston Portside I Portside II 145 Front Worcester 4.2% VRE RENT GROWTH YOY (FOR PORTSIDE I & II) 0.3% 2025 YTD MARKET RENT GROWTH |
| CORPORATE PRESENTATION, JUNE 2, 2025 | 22 Corporate Responsibility Corporate Responsibility |
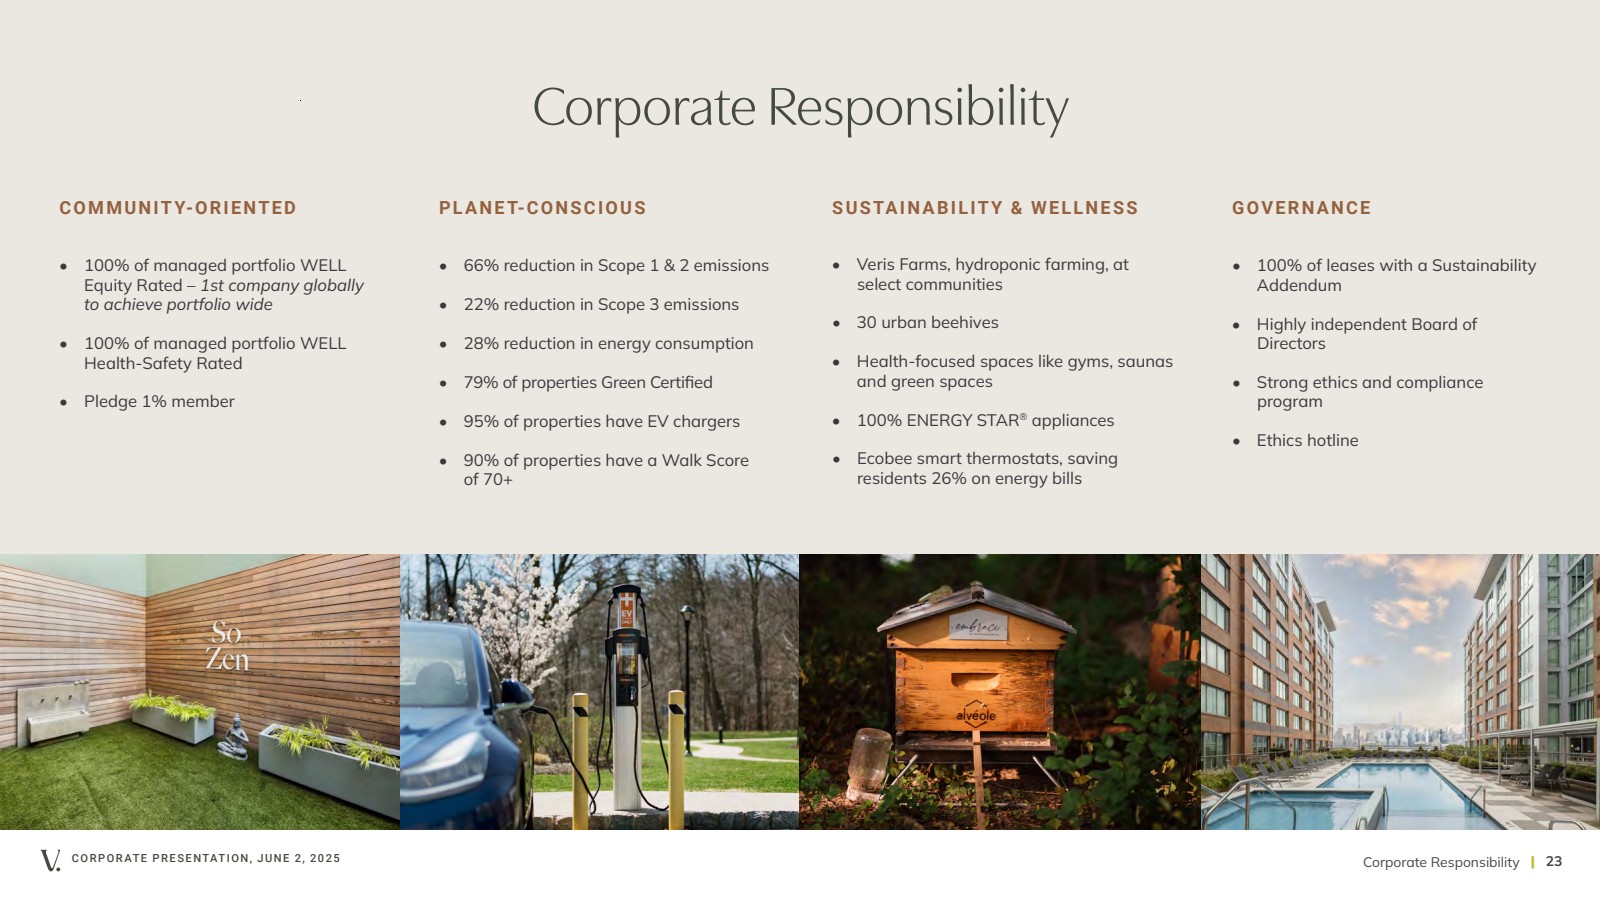
| CORPORATE PRESENTATION, JUNE 2, 2025 | 23 SUSTAINABILITY & WELLNESS GOVERNANCE • 66% reduction in Scope 1 & 2 emissions • 22% reduction in Scope 3 emissions • 28% reduction in energy consumption • 79% of properties Green Certified • 95% of properties have EV chargers • 90% of properties have a Walk Score of 70+ • 100% of managed portfolio WELL Equity Rated – 1st company globally to achieve portfolio wide • 100% of managed portfolio WELL Health-Safety Rated • Pledge 1% member • 100% of leases with a Sustainability Addendum • Highly independent Board of Directors • Strong ethics and compliance program • Ethics hotline • Veris Farms, hydroponic farming, at select communities • 30 urban beehives • Health-focused spaces like gyms, saunas and green spaces • 100% ENERGY STAR® appliances • Ecobee smart thermostats, saving residents 26% on energy bills Corporate Responsibility COMMUNITY-ORIENTED P L A N E T-C O N S C I O U S Corporate Responsibility |
| CORPORATE PRESENTATION, JUNE 2, 2025 | 24 Our Values EXCELLENCE ALWAYS FORWARD-THINKING Our properties are part of wider communities, and we recognize our responsibility to those around us. By putting our residents and employees first, we ensure exceptional living and working experiences that create long-term value. We pioneer innovative solutions that transform residential living and create resilient communities. Life in a Veris Residential community promises excellence at every turn. Our tailor-made programs assure consistent, best-in-class service from move-in to move-out. PEOPLE FIRST COMMUNITY IMPACT Corporate Responsibility |

| CORPORATE PRESENTATION, JUNE 2, 2025 | 25 Ancillary Information Ancillary Information |

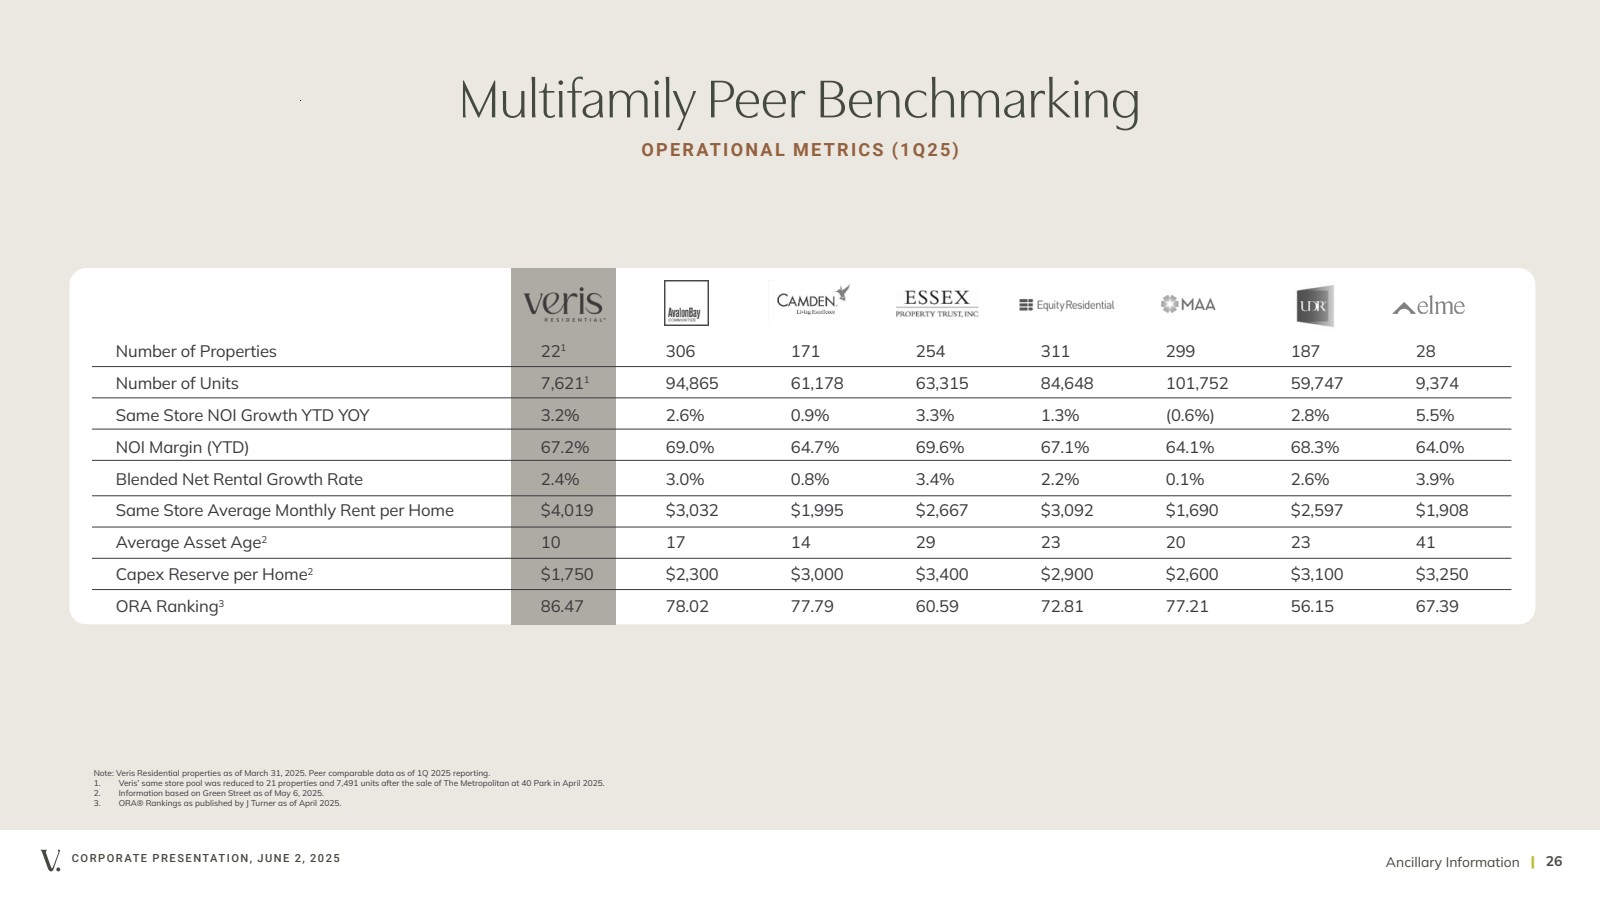
| CORPORATE PRESENTATION, JUNE 2, 2025 | 26 Multifamily Peer Benchmarking OPERATIONAL METRICS (1Q25) Number of Properties 221 306 171 254 311 299 187 28 Number of Units 7,6211 94,865 61,178 63,315 84,648 101,752 59,747 9,374 Same Store NOI Growth YTD YOY 3.2% 2.6% 0.9% 3.3% 1.3% (0.6%) 2.8% 5.5% NOI Margin (YTD) 67.2% 69.0% 64.7% 69.6% 67.1% 64.1% 68.3% 64.0% Blended Net Rental Growth Rate 2.4% 3.0% 0.8% 3.4% 2.2% 0.1% 2.6% 3.9% Same Store Average Monthly Rent per Home $4,019 $3,032 $1,995 $2,667 $3,092 $1,690 $2,597 $1,908 Average Asset Age2 10 17 14 29 23 20 23 41 Capex Reserve per Home2 $1,750 $2,300 $3,000 $3,400 $2,900 $2,600 $3,100 $3,250 ORA Ranking3 86.47 78.02 77.79 60.59 72.81 77.21 56.15 67.39 Note: Veris Residential properties as of March 31, 2025. Peer comparable data as of 1Q 2025 reporting. 1. Veris’ same store pool was reduced to 21 properties and 7,491 units after the sale of The Metropolitan at 40 Park in April 2025. 2. Information based on Green Street as of May 6, 2025. 3. ORA® Rankings as published by J Turner as of April 2025. Ancillary Information |
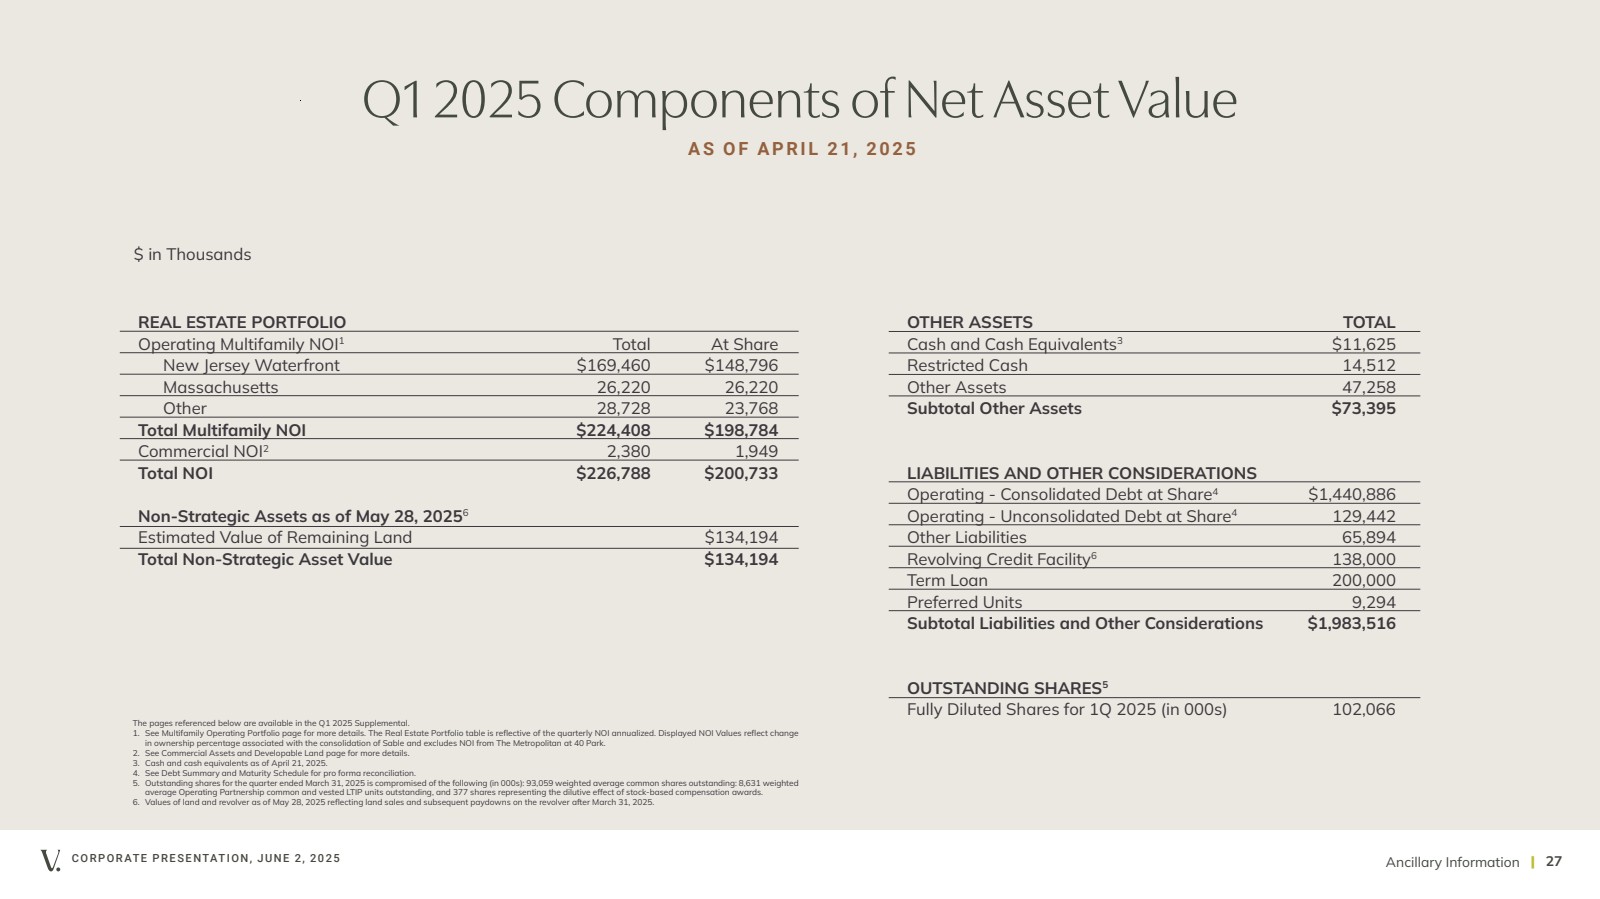
| Ancillary Information CORPORATE PRESENTATION, JUNE 2, 2025 | 27 Q1 2025 Components of Net Asset Value REAL ESTATE PORTFOLIO Operating Multifamily NOI1 Total At Share New Jersey Waterfront $169,460 $148,796 Massachusetts 26,220 26,220 Other 28,728 23,768 Total Multifamily NOI $224,408 $198,784 Commercial NOI2 2,380 1,949 Total NOI $226,788 $200,733 Non-Strategic Assets as of May 28, 20256 Estimated Value of Remaining Land $134,194 Total Non-Strategic Asset Value $134,194 OTHER ASSETS TOTAL Cash and Cash Equivalents3 $11,625 Restricted Cash 14,512 Other Assets 47,258 Subtotal Other Assets $73,395 LIABILITIES AND OTHER CONSIDERATIONS Operating - Consolidated Debt at Share4 $1,440,886 Operating - Unconsolidated Debt at Share4 129,442 Other Liabilities 65,894 Revolving Credit Facility6 138,000 Term Loan 200,000 Preferred Units 9,294 Subtotal Liabilities and Other Considerations $1,983,516 OUTSTANDING SHARES5 Fully Diluted Shares for 1Q 2025 (in 000s) 102,066 The pages referenced below are available in the Q1 2025 Supplemental. 1. See Multifamily Operating Portfolio page for more details. The Real Estate Portfolio table is reflective of the quarterly NOI annualized. Displayed NOI Values reflect change in ownership percentage associated with the consolidation of Sable and excludes NOI from The Metropolitan at 40 Park. 2. See Commercial Assets and Developable Land page for more details. 3. Cash and cash equivalents as of April 21, 2025. 4. See Debt Summary and Maturity Schedule for pro forma reconciliation. 5. Outstanding shares for the quarter ended March 31, 2025 is compromised of the following (in 000s): 93,059 weighted average common shares outstanding: 8,631 weighted average Operating Partnership common and vested LTIP units outstanding, and 377 shares representing the dilutive effect of stock-based compensation awards. 6. Values of land and revolver as of May 28, 2025 reflecting land sales and subsequent paydowns on the revolver after March 31, 2025. $ in Thousands AS OF APRIL 21, 2025 |
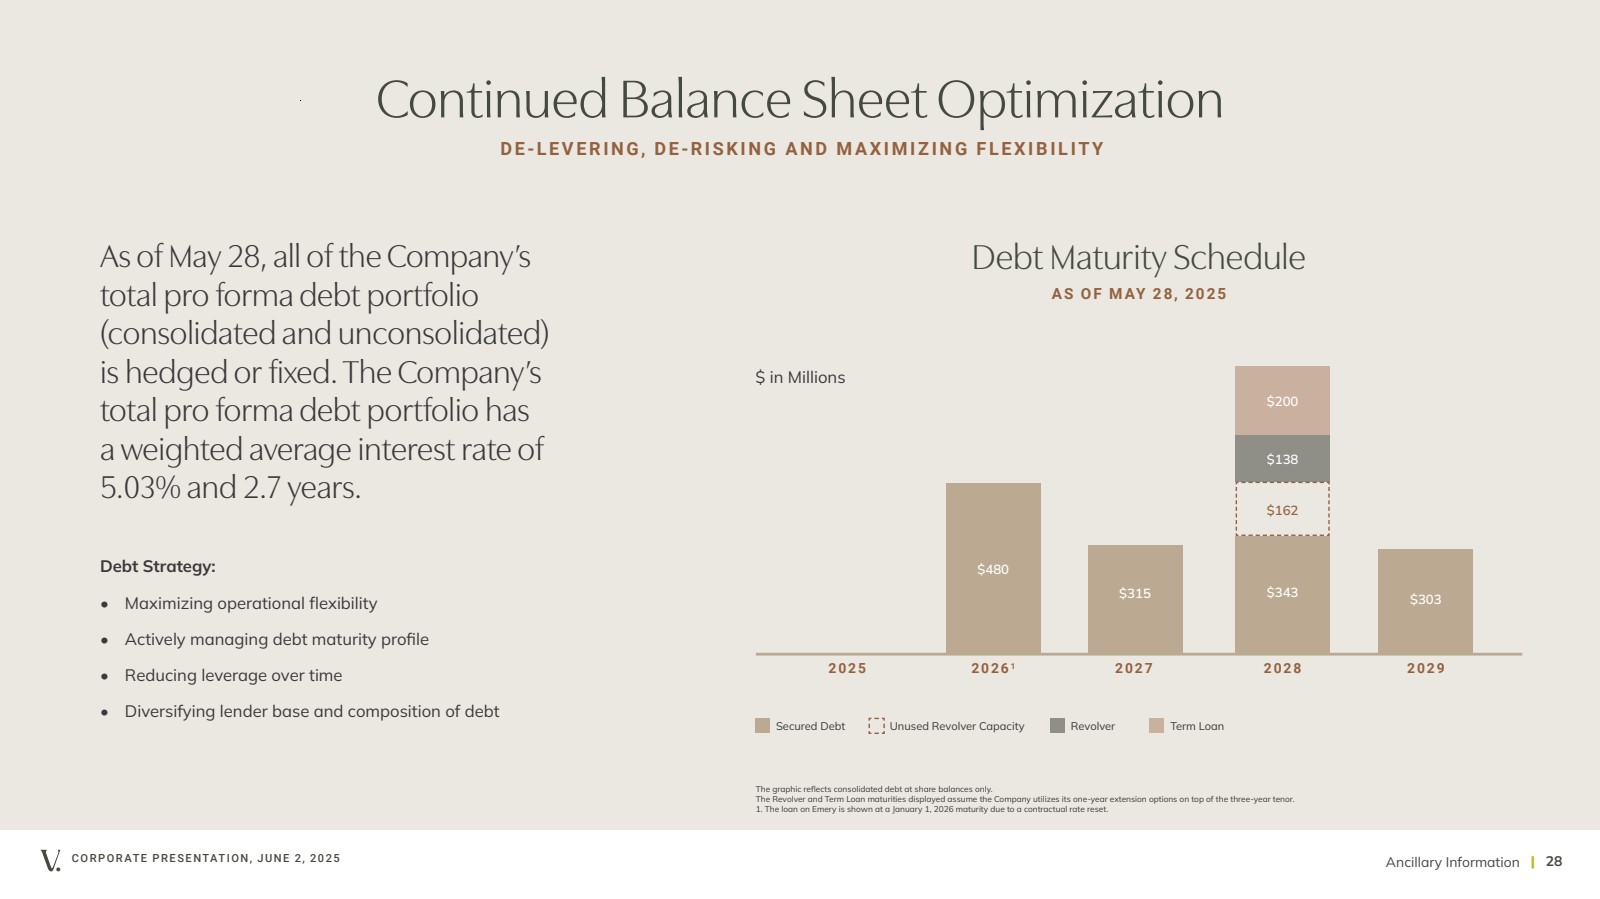
| Ancillary Information CORPORATE PRESENTATION, JUNE 2, 2025 | 28 Continued Balance Sheet Optimization Debt Strategy: • Maximizing operational flexibility • Actively managing debt maturity profile • Reducing leverage over time • Diversifying lender base and composition of debt Debt Maturity Schedule AS OF MAY 28, 2025 Secured Debt Unused Revolver Capacity Revolver $480 $315 $343 $162 2025 20261 2027 2028 2029 Term Loan DE-LEVERING, DE-RISKING AND MAXIMIZING FLEXIBILITY The graphic reflects consolidated debt at share balances only. The Revolver and Term Loan maturities displayed assume the Company utilizes its one-year extension options on top of the three-year tenor. 1. The loan on Emery is shown at a January 1, 2026 maturity due to a contractual rate reset. As of May 28, all of the Company’s total pro forma debt portfolio (consolidated and unconsolidated) is hedged or fixed. The Company’s total pro forma debt portfolio has a weighted average interest rate of 5.03% and 2.7 years. $303 $138 $200 $ in Millions |
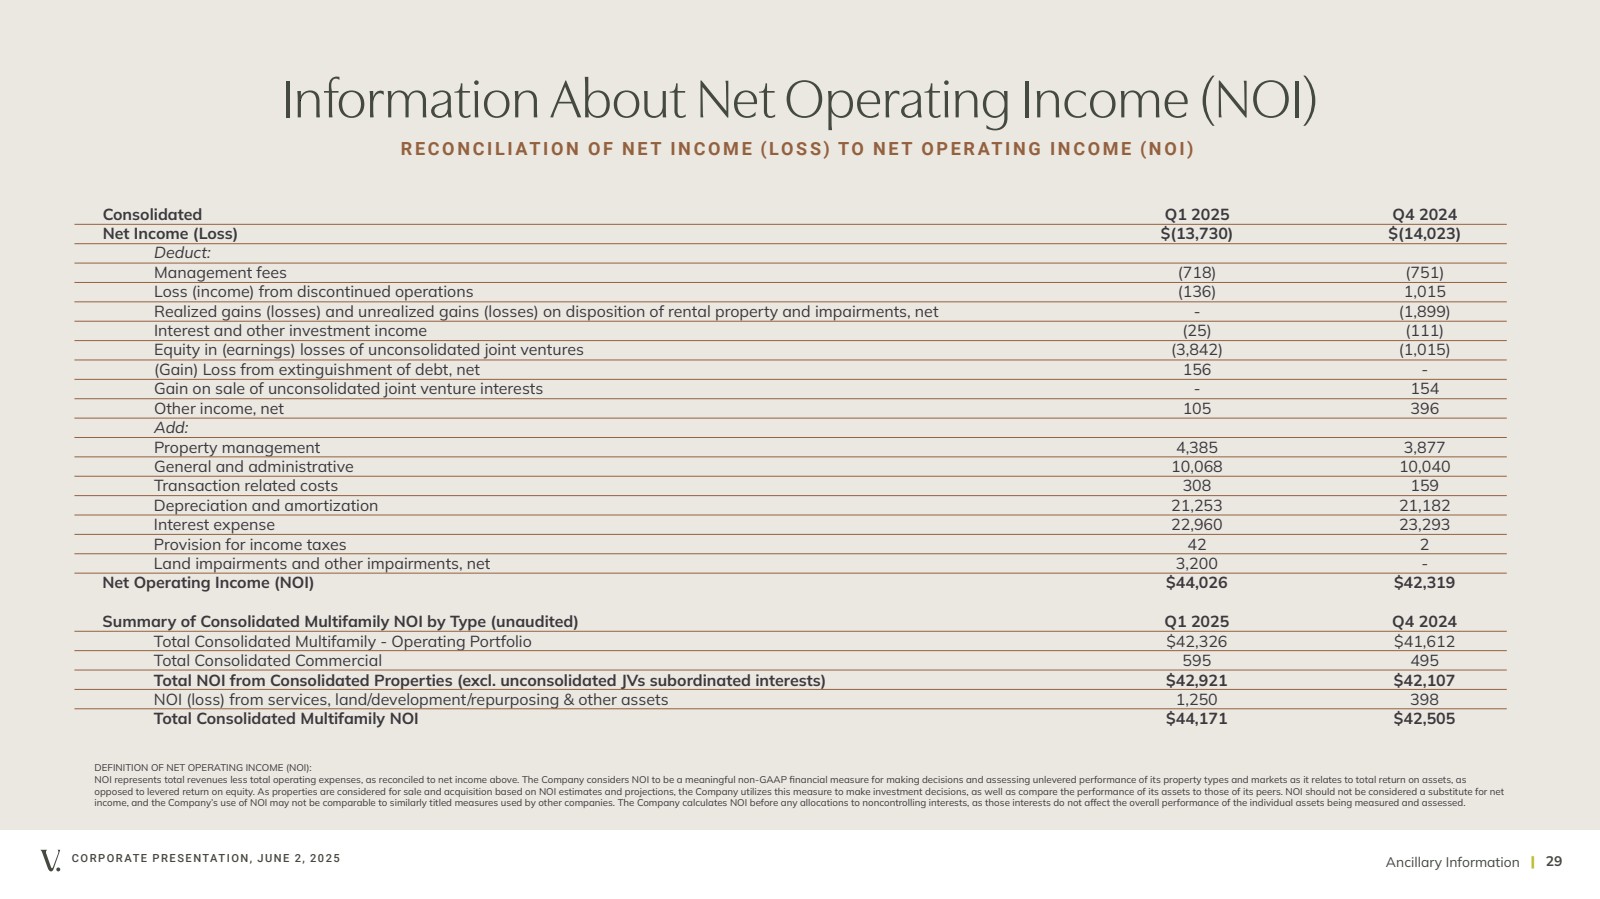
| Consolidated Q1 2025 Q4 2024 Net Income (Loss) $(13,730) $(14,023) Deduct: Management fees (718) (751) Loss (income) from discontinued operations (136) 1,015 Realized gains (losses) and unrealized gains (losses) on disposition of rental property and impairments, net - (1,899) Interest and other investment income (25) (111) Equity in (earnings) losses of unconsolidated joint ventures (3,842) (1,015) (Gain) Loss from extinguishment of debt, net 156 - Gain on sale of unconsolidated joint venture interests - 154 Other income, net 105 396 Add: Property management 4,385 3,877 General and administrative 10,068 10,040 Transaction related costs 308 159 Depreciation and amortization 21,253 21,182 Interest expense 22,960 23,293 Provision for income taxes 42 2 Land impairments and other impairments, net 3,200 - Net Operating Income (NOI) $44,026 $42,319 Summary of Consolidated Multifamily NOI by Type (unaudited) Q1 2025 Q4 2024 Total Consolidated Multifamily - Operating Portfolio $42,326 $41,612 Total Consolidated Commercial 595 495 Total NOI from Consolidated Properties (excl. unconsolidated JVs subordinated interests) $42,921 $42,107 NOI (loss) from services, land/development/repurposing & other assets 1,250 398 Total Consolidated Multifamily NOI $44,171 $42,505 Ancillary Information CORPORATE PRESENTATION, JUNE 2, 2025 | 29 DEFINITION OF NET OPERATING INCOME (NOI): NOI represents total revenues less total operating expenses, as reconciled to net income above. The Company considers NOI to be a meaningful non-GAAP financial measure for making decisions and assessing unlevered performance of its property types and markets as it relates to total return on assets, as opposed to levered return on equity. As properties are considered for sale and acquisition based on NOI estimates and projections, the Company utilizes this measure to make investment decisions, as well as compare the performance of its assets to those of its peers. NOI should not be considered a substitute for net income, and the Company’s use of NOI may not be comparable to similarly titled measures used by other companies. The Company calculates NOI before any allocations to noncontrolling interests, as those interests do not affect the overall performance of the individual assets being measured and assessed. Information About Net Operating Income (NOI) RECONCILIATION OF NET INCOME (LOSS) TO NET OPERATING INCOME (NOI) |
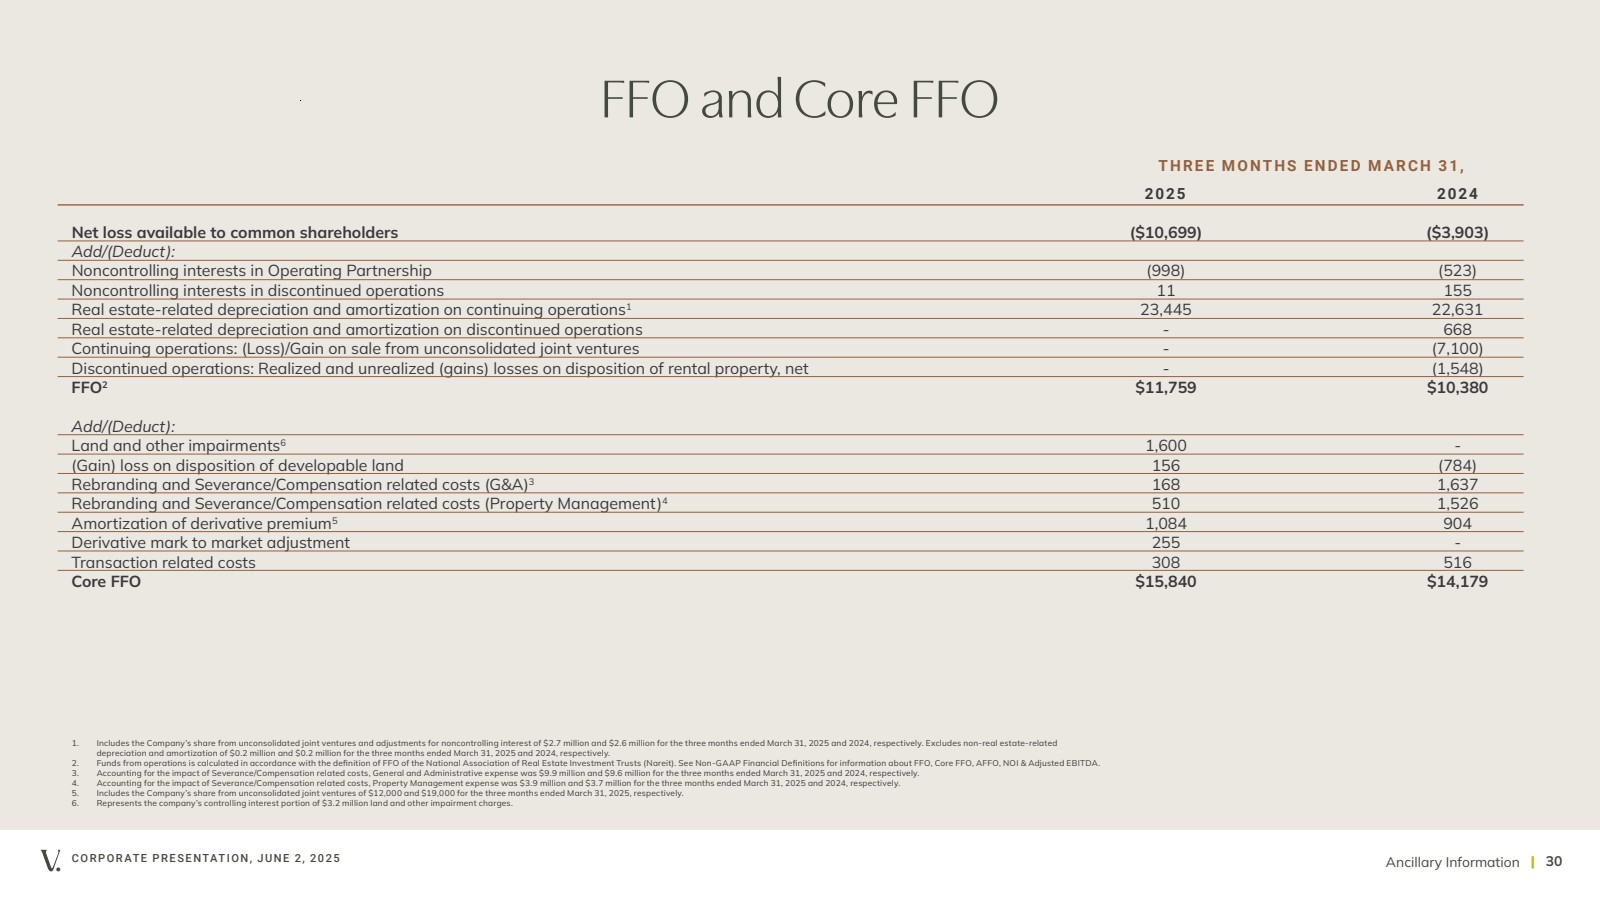
| Ancillary Information CORPORATE PRESENTATION, JUNE 2, 2025 | 30 2025 2024 Net loss available to common shareholders ($10,699) ($3,903) Add/(Deduct): Noncontrolling interests in Operating Partnership (998) (523) Noncontrolling interests in discontinued operations 11 155 Real estate-related depreciation and amortization on continuing operations1 23,445 22,631 Real estate-related depreciation and amortization on discontinued operations - 668 Continuing operations: (Loss)/Gain on sale from unconsolidated joint ventures - (7,100) Discontinued operations: Realized and unrealized (gains) losses on disposition of rental property, net - (1,548) FFO2 $11,759 $10,380 Add/(Deduct): Land and other impairments6 1,600 - (Gain) loss on disposition of developable land 156 (784) Rebranding and Severance/Compensation related costs (G&A)3 168 1,637 Rebranding and Severance/Compensation related costs (Property Management)4 510 1,526 Amortization of derivative premium5 1,084 904 Derivative mark to market adjustment 255 - Transaction related costs 308 516 Core FFO $15,840 $14,179 FFO and Core FFO 1. Includes the Company’s share from unconsolidated joint ventures and adjustments for noncontrolling interest of $2.7 million and $2.6 million for the three months ended March 31, 2025 and 2024, respectively. Excludes non-real estate-related depreciation and amortization of $0.2 million and $0.2 million for the three months ended March 31, 2025 and 2024, respectively. 2. Funds from operations is calculated in accordance with the definition of FFO of the National Association of Real Estate Investment Trusts (Nareit). See Non-GAAP Financial Definitions for information about FFO, Core FFO, AFFO, NOI & Adjusted EBITDA. 3. Accounting for the impact of Severance/Compensation related costs, General and Administrative expense was $9.9 million and $9.6 million for the three months ended March 31, 2025 and 2024, respectively. 4. Accounting for the impact of Severance/Compensation related costs, Property Management expense was $3.9 million and $3.7 million for the three months ended March 31, 2025 and 2024, respectively. 5. Includes the Company’s share from unconsolidated joint ventures of $12,000 and $19,000 for the three months ended March 31, 2025, respectively. 6. Represents the company’s controlling interest portion of $3.2 million land and other impairment charges. THREE MONTHS ENDED MARCH 31, |
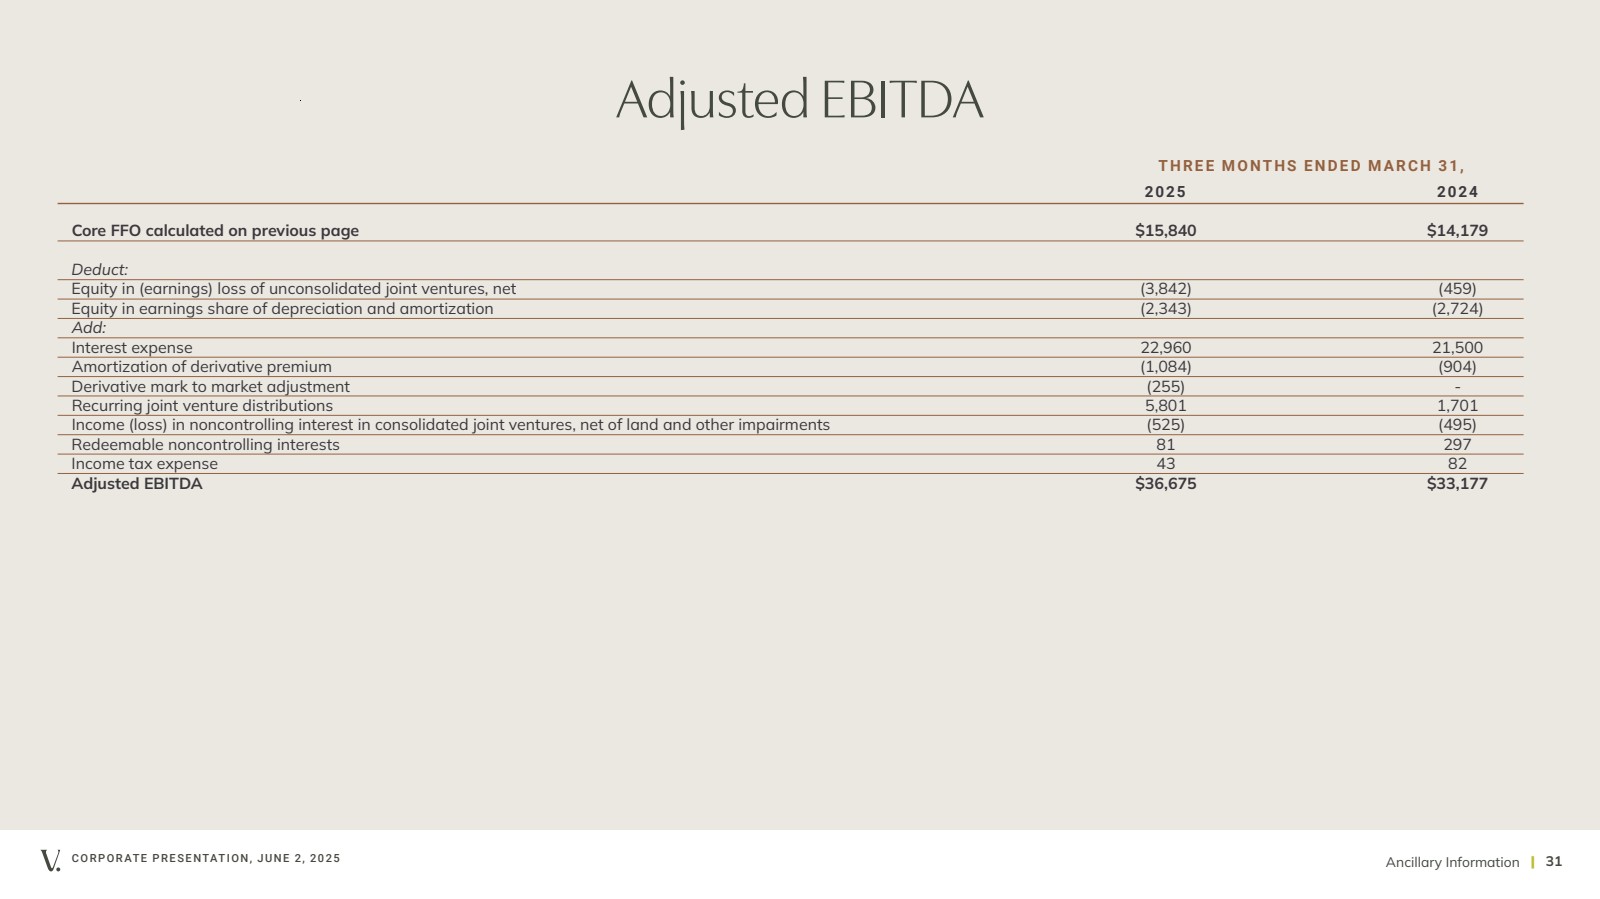
| Ancillary Information CORPORATE PRESENTATION, JUNE 2, 2025 | 31 2025 2024 Core FFO calculated on previous page $15,840 $14,179 Deduct: Equity in (earnings) loss of unconsolidated joint ventures, net (3,842) (459) Equity in earnings share of depreciation and amortization (2,343) (2,724) Add: Interest expense 22,960 21,500 Amortization of derivative premium (1,084) (904) Derivative mark to market adjustment (255) - Recurring joint venture distributions 5,801 1,701 Income (loss) in noncontrolling interest in consolidated joint ventures, net of land and other impairments (525) (495) Redeemable noncontrolling interests 81 297 Income tax expense 43 82 Adjusted EBITDA $36,675 $33,177 Adjusted EBITDA THREE MONTHS ENDED MARCH 31, |
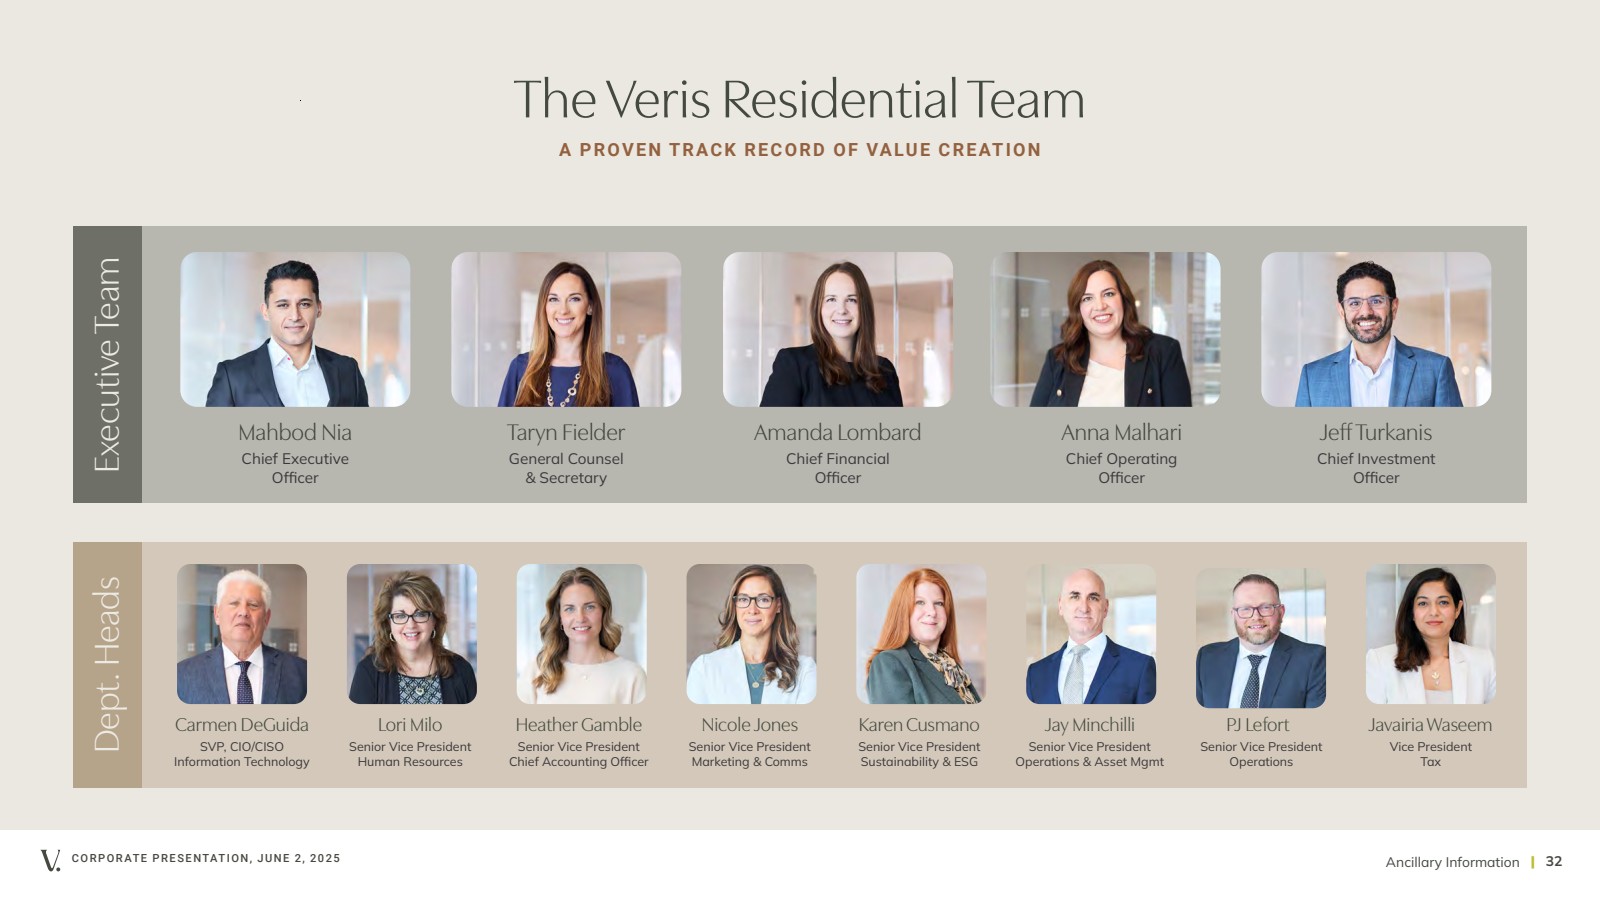
| CORPORATE PRESENTATION, JUNE 2, 2025 | 32 The Veris Residential Team Executive Team Dept. Heads Mahbod Nia Taryn Fielder Amanda Lombard Anna Malhari Jeff Turkanis Chief Executive Officer General Counsel & Secretary Chief Financial Officer Chief Operating Officer Chief Investment Officer Carmen DeGuida Lori Milo Karen Cusmano PJ Lefort SVP, CIO/CISO Information Technology Senior Vice President Human Resources Senior Vice President Sustainability & ESG Senior Vice President Operations Senior Vice President Operations & Asset Mgmt Nicole Jones Senior Vice President Marketing & Comms Jay Minchilli Javairia Waseem Vice President Tax A PROVEN TRACK RECORD OF VALUE CREATION Ancillary Information Heather Gamble Senior Vice President Chief Accounting Officer |
| Ancillary Information CORPORATE PRESENTATION, JUNE 2, 2025 | 33 Property Directory 145 FRONT AT CITY SQUARE 145 Front Street Worcester, MA 01608 BLVD 401 401 Washington Blvd. Jersey City, NJ 07310 BLVD 425 425 Washington Blvd. Jersey City, NJ 07310 BLVD 475 475 Washington Blvd. Jersey City, NJ 07310 THE CAPSTONE AT PORT IMPERIAL 17 Avenue at Port Imperial West New York, NJ 07093 THE EMERY AT OVERLOOK RIDGE 21 Quarry Lane Malden, MA 02148 HAUS25 25 Christopher Columbus Drive Jersey City, NJ 07302 LIBERTY TOWERS 33 Hudson Street Jersey City, NJ 07302 THE JAMES 87 Madison Avenue Park Ridge, NJ 07656 PORTSIDE AT EAST PIER 40 East Pier Drive East Boston, MA 02128 PORTSIDE II AT EAST PIER 40 East Pier Drive East Boston, MA 02128 QUARRY PLACE AT TUCKAHOE 64 Midland Place Tuckahoe, NY 10707 RIVERHOUSE 9 900 Avenue at Port Imperial Weehawken, NJ 07086 RIVERHOUSE 11 1100 Avenue at Port Imperial Weehawken, NJ 07086 RIVERPARK AT HARRISON 201 Dey Street Harrison, NJ 07029 RIVERTRACE AT PORT IMPERIAL 11 Ave. at Port Imperial West New York, NJ 07093 SABLE 200 Greene Street Jersey City, NJ 07310 SIGNATURE PLACE 250 Johnson Road Morris Plains, NJ 07950 SOHO LOFTS 273 16th Street Jersey City, NJ 07310 STATION HOUSE 701 2nd St NE Washington, DC 20002 THE UPTON AT SHORT HILLS 1 Fineran Way Short Hills, NJ 07078 |
| CORPORATE PRESENTATION, JUNE 2, 2025 | 34 Definitions AV E R AG E E F F E CT I V E M O NT H LY R E NT P E R H O M E represents the average effective rent (net of concessions) for in-place leases and the market rent for vacant homes. CORE FFO AND ADJUSTED FFO (“AFFO”) Core FFO is defined as FFO, as adjusted for certain items to facilitate comparative measurement of the Company’s performance over time. Core FFO is presented solely as supplemental disclosure that the Company’s management believes provides useful information to investors and analysts of its results, after adjusting for certain items to facilitate comparability of its performance from period to period. Core FFO is a non-GAAP financial measures that is not intended to represent cash flow and is not indicative of cash flows provided by operating activities as determined in accordance with GAAP. As there is not a generally accepted definition established for Core FFO, the Company’s Core FFO may not be comparable to the Core FFO reported by other REITs. A reconciliation of net income per share to Core FFO and Adjusted FFO in dollars and per share are included in the financial tables accompanying our quarterly and annual filings. BLENDED NET RENTAL GROWTH RATE combines new lease and renewal lease growth rates. New lease growth rate refers to the difference in rent a new occupant of a unit is paying compared to the rent the unit’s previous occupant was paying on a net effective basis. Renewal lease growth rate refers to the increase or decrease in monthly rent in a renewed lease compared to the previous lease on a net effective basis. NET DEBT/EBITDA The Company defines Adjusted EBITDA as Core FFO, plus interest expense, plus income tax expense, plus income (loss) in noncontrolling interest in consolidated joint ventures and plus adjustments to reflect the entity’s share of Adjusted EBITDA of unconsolidated joint ventures. The Company presents Adjusted EBITDA because the Company believes that Adjusted EBITDA, along with cash flow from operating activities, investing activities and financing activities, provides investors with an additional indicator of the Company’s ability to incur and service debt. Adjusted EBITDA should not be considered as an alternative to net income (determined in accordance with GAAP), as an indication of the Company’s financial performance, as an alternative to net cash flows from operating activities (determined in accordance with GAAP) or as a measure of the Company’s liquidity. NET OPERATING INCOME (NOI) represents total revenues less total operating expenses, as reconciled to net income above. The Company considers NOI to be a meaningful non-GAAP financial measure for making decisions and assessing unlevered performance of its property types and markets as it relates to total return on assets, as opposed to levered return on equity. As properties are considered for sale and acquisition based on NOI estimates and projections, the Company utilizes this measure to make investment decisions, as well as compare the performance of its assets to those of its peers. NOI should not be considered a substitute for net income, and the Company’s use of NOI may not be comparable to similarly titled measures used by other companies. The Company calculates NOI before any allocations to non-controlling interests, as those interests do not affect the overall performance of the individual assets being measured and assessed. ORA™ score is an aggregate compilation of a property’s ratings across various review sites. Each month, J Turner Research monitors the online ratings of properties nationwide. Using a statistical model, a single score based on a scale of 0 to 100 is assigned to each property. SAME STORE includes properties that were owned for the entirety of the years being compared and exclude properties under redevelopment or development and properties acquired, sold or classified as held for sale during the years being compared. Ancillary Information |
| Thank You |