| CORPORATE PRESENTATION, SEPTEMBER 6, 2023 | 1 Overview | Portfolio | ESG | Appendix S E R V I N G P R O P E RT I E S , P E O P L E , A N D T H E P L A N E T. Corporate Presentation SEPTEMBER 6, 2023 |

| | 2 Overview | Portfolio | ESG | Appendix CORPORATE PRESENTATION, SEPTEMBER 6, 2023 This Operating and Financial Data should be read in connection with our Quarterly Report on Form 10-Q for the quarter ended June 30, 2023. Statements made in this presentation may be forward-looking statements within the meaning of Section 21E of the Securities Exchange Act of 1934, as amended. Such for-ward-looking statements are intended to be covered by the safe harbor provisions for forward-looking statements contained in Section 21E of such act. Such forward-look-ing statements relate to, without limitation, our future economic performance, plans and objectives for future operations and projections of revenue and other financial items. Forward-looking statements can be identified by the use of words such as “may,” “will,” “plan,” “potential,” “projected,” “should,” “expect,” “anticipate,” “estimate,” “target,” “continue” or comparable terminology. Forward-looking statements are inherently subject to certain risks, trends and uncertainties, many of which we cannot predict with accuracy and some of which we might not even anticipate. Although we believe that the expectations reflected in such forward-looking statements are based upon reasonable assumptions at the time made, we can give no assurance that such expectations will be achieved. Future events and actual results, financial and otherwise, may differ materially from the results discussed in the forward-looking statements. Readers are cautioned not to place undue reliance on these forward-looking statements and are advised to consider the factors listed above together with the additional factors under the heading “Disclosure Regarding Forward-Looking Statements” and “Risk Factors” in our annual reports on Form 10-K, as may be supplemented or amended by our quarterly reports on Form 10-Q, which are incorporated herein by reference. We assume no obligation to update or supplement forward-looking statements that become untrue because of subsequent events, new information or otherwise. OVERVIEW FORWARD-LOOKING STATEMENTS |
| CORPORATE PRESENTATION, SEPTEMBER 6, 2023 | 3 Overview | Portfolio | ESG | Appendix OVERVIEW Haus25, Jersey City, NJ Overview THE QUARTER IN REVIEW |

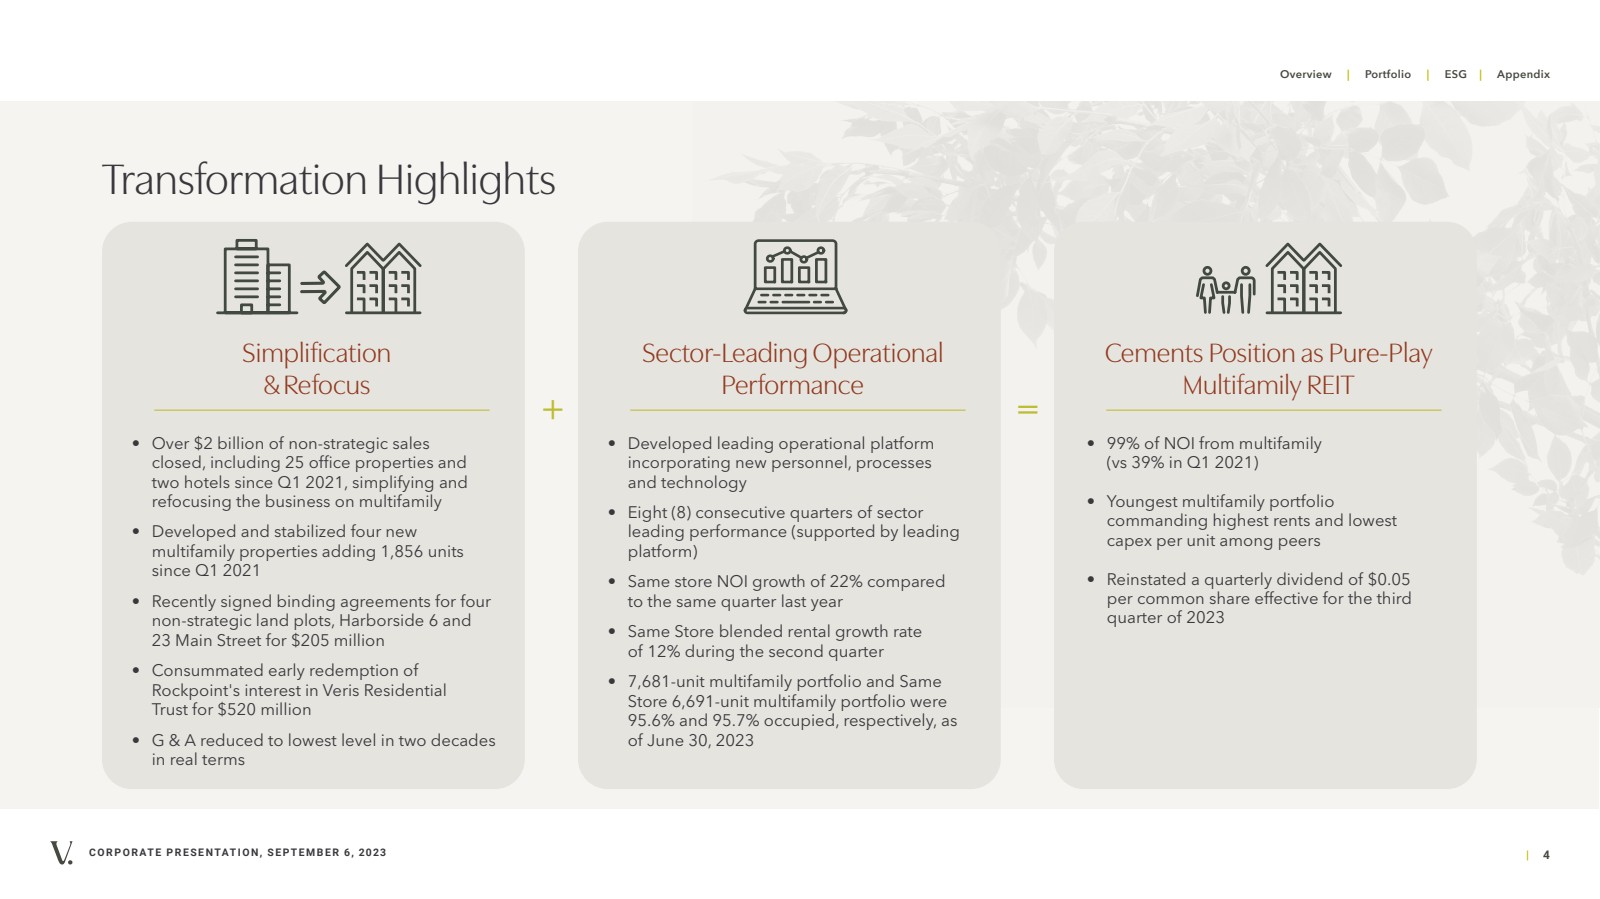
| | 4 Overview | Portfolio | ESG | Appendix CORPORATE PRESENTATION, SEPTEMBER 6, 2023 Cements Position as Pure-Play Multifamily REIT • 99% of NOI from multifamily (vs 39% in Q1 2021) • Youngest multifamily portfolio commanding highest rents and lowest capex per unit among peers • Reinstated a quarterly dividend of $0.05 per common share effective for the third quarter of 2023 Transformation Highlights Simplification & Refocus • Over $2 billion of non-strategic sales closed, including 25 office properties and two hotels since Q1 2021, simplifying and refocusing the business on multifamily • Developed and stabilized four new multifamily properties adding 1,856 units since Q1 2021 • Recently signed binding agreements for four non-strategic land plots, Harborside 6 and 23 Main Street for $205 million • Consummated early redemption of Rockpoint's interest in Veris Residential Trust for $520 million • G & A reduced to lowest level in two decades in real terms Sector-Leading Operational Performance • Developed leading operational platform incorporating new personnel, processes and technology • Eight (8) consecutive quarters of sector leading performance (supported by leading platform) • Same store NOI growth of 22% compared to the same quarter last year • Same Store blended rental growth rate of 12% during the second quarter • 7,681-unit multifamily portfolio and Same Store 6,691-unit multifamily portfolio were 95.6% and 95.7% occupied, respectively, as of June 30, 2023 + = |
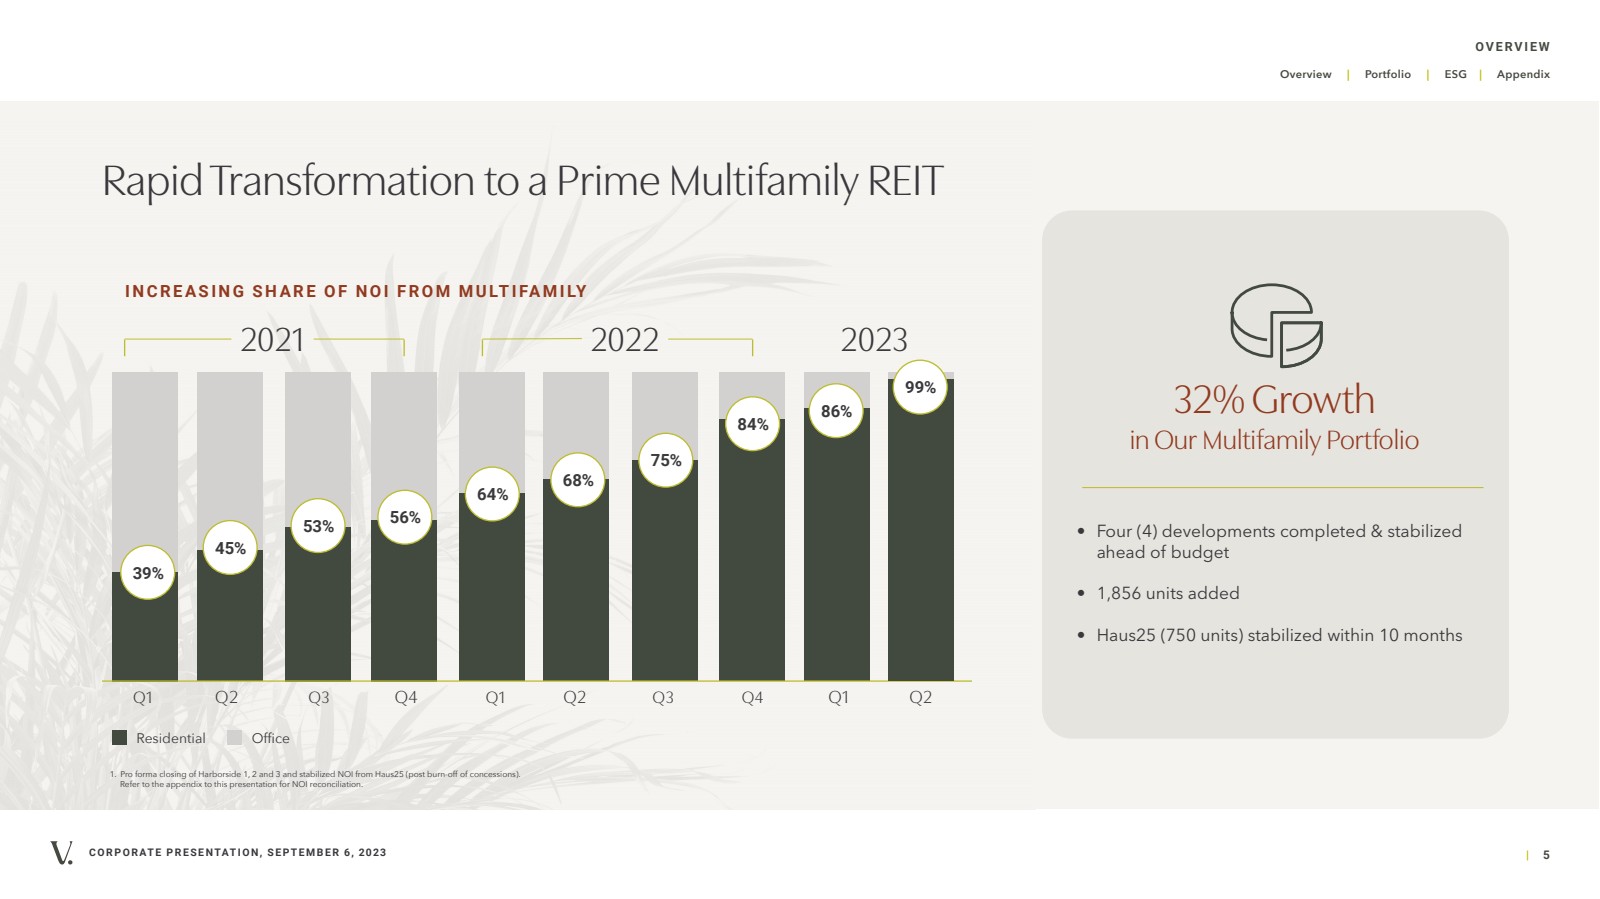
| | 5 Overview | Portfolio | ESG | Appendix CORPORATE PRESENTATION, SEPTEMBER 6, 2023 Rapid Transformation to a Prime Multifamily REIT OVERVIEW 1. Pro forma closing of Harborside 1, 2 and 3 and stabilized NOI from Haus25 (post burn-off of concessions). Refer to the appendix to this presentation for NOI reconciliation. Residential Office 39% 45% 53% 56% 64% 68% 75% 86% Q1 Q2 Q3 Q4 Q1 Q2 Q3 Q1 84% 2023 Q4 2021 2022 I N C R E A S I N G S H A R E O F N O I F R O M M U LT I FA M I LY 99% Q2 32% Growth in Our Multifamily Portfolio • Four (4) developments completed & stabilized ahead of budget • 1,856 units added • Haus25 (750 units) stabilized within 10 months |
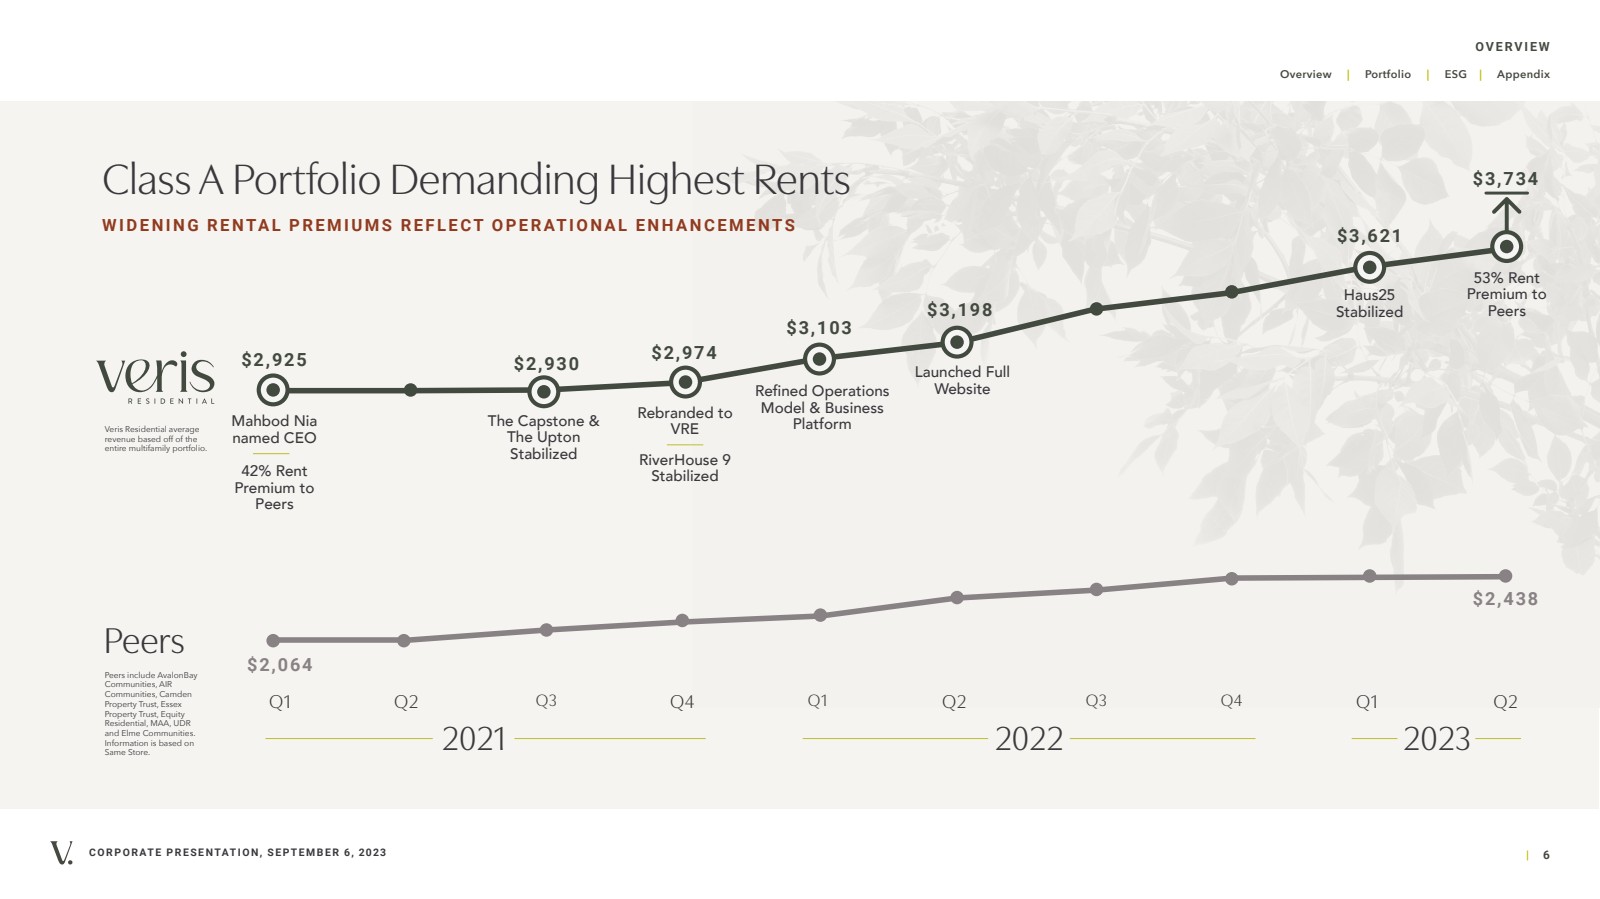
| | 6 Overview | Portfolio | ESG | Appendix CORPORATE PRESENTATION, SEPTEMBER 6, 2023 Class A Portfolio Demanding Highest Rents OVERVIEW Q1 Q2 Q3 Q4 Q1 Q2 Q3 Q4 Q1 Q2 2021 2022 2023 Peers include AvalonBay Communities, AIR Communities, Camden Property Trust, Essex Property Trust, Equity Residential, MAA, UDR and Elme Communities. Information is based on Same Store. Peers WIDENING RENTAL PREMIUMS REFLECT OPERATIONAL ENHANCEMENTS Veris Residential average revenue based off of the entire multifamily portfolio. $2,974 $2,925 $3,734 $2,064 $2,438 Rebranded to VRE RiverHouse 9 Stabilized Refined Operations Model & Business Platform Launched Full Website Haus25 Stabilized $3,103 $3,198 $3,621 53% Rent Premium to Peers $2,930 The Capstone & The Upton Stabilized Mahbod Nia named CEO 42% Rent Premium to Peers |
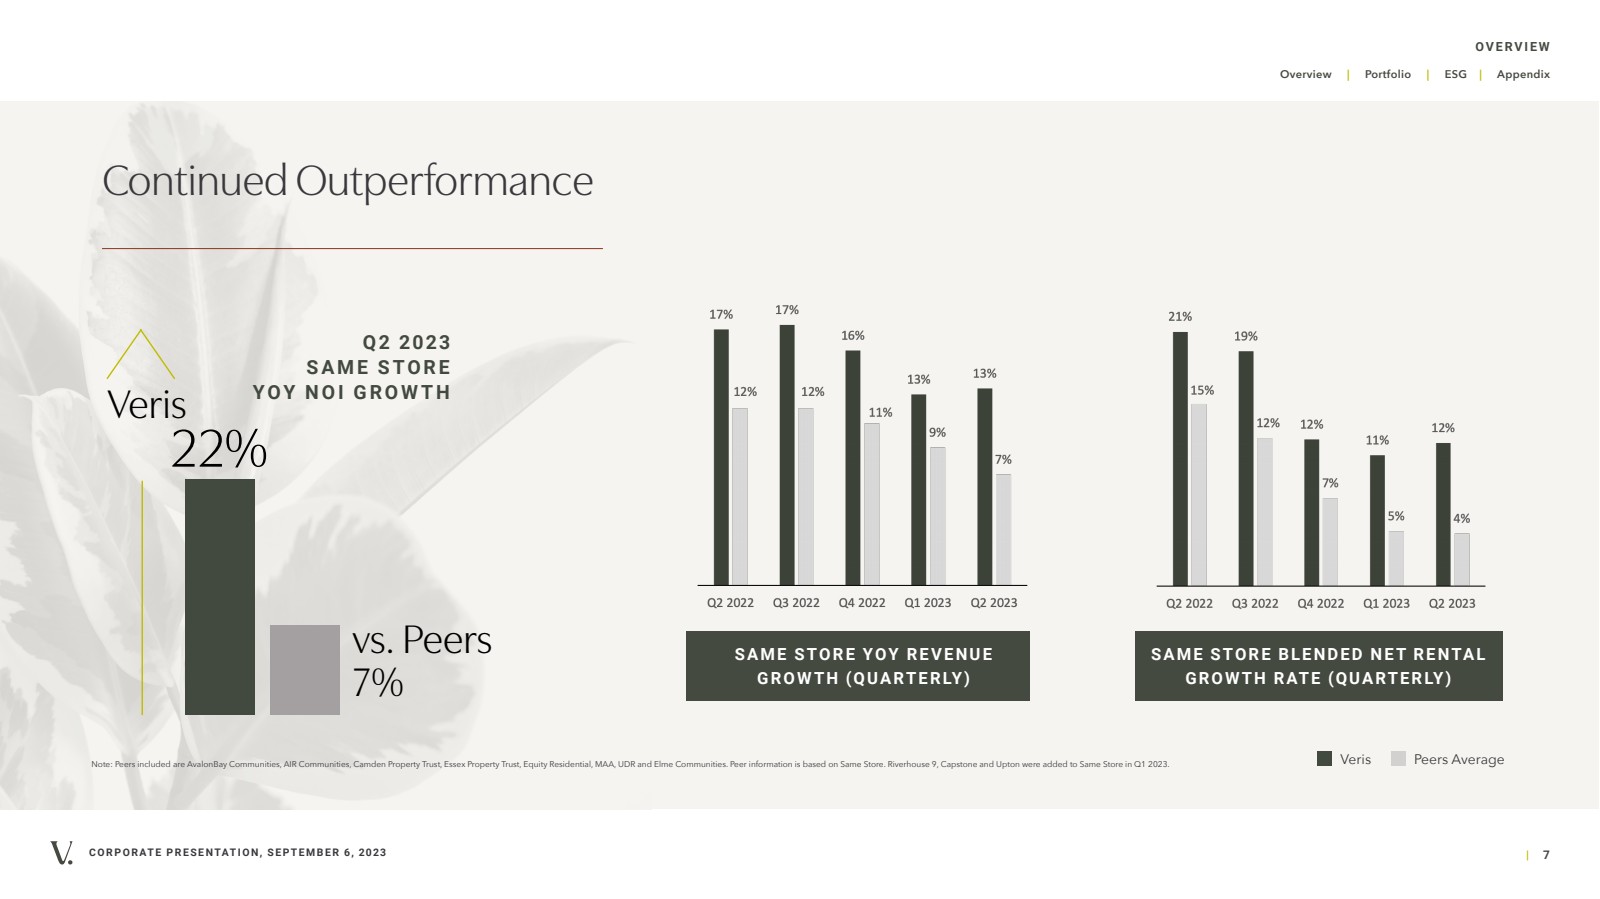
| | 7 Overview | Portfolio | ESG | Appendix CORPORATE PRESENTATION, SEPTEMBER 6, 2023 Continued Outperformance OVERVIEW Note: Peers included are AvalonBay Communities, AIR Communities, Camden Property Trust, Essex Property Trust, Equity Residential, MAA, UDR and Elme Communities. Peer information is based on Same Store. Riverhouse 9, Capstone and Upton were added to Same Store in Q1 2023. Veris 22% Q2 2023 S A M E S TO R E YOY NOI GROWTH SAME STORE YOY REVENUE G R O W T H (Q UA RT E R LY) SAME STORE BLENDED NET RENTAL G R O W T H R AT E (Q UA RT E R LY) vs. Peers 7% Veris Peers Average |
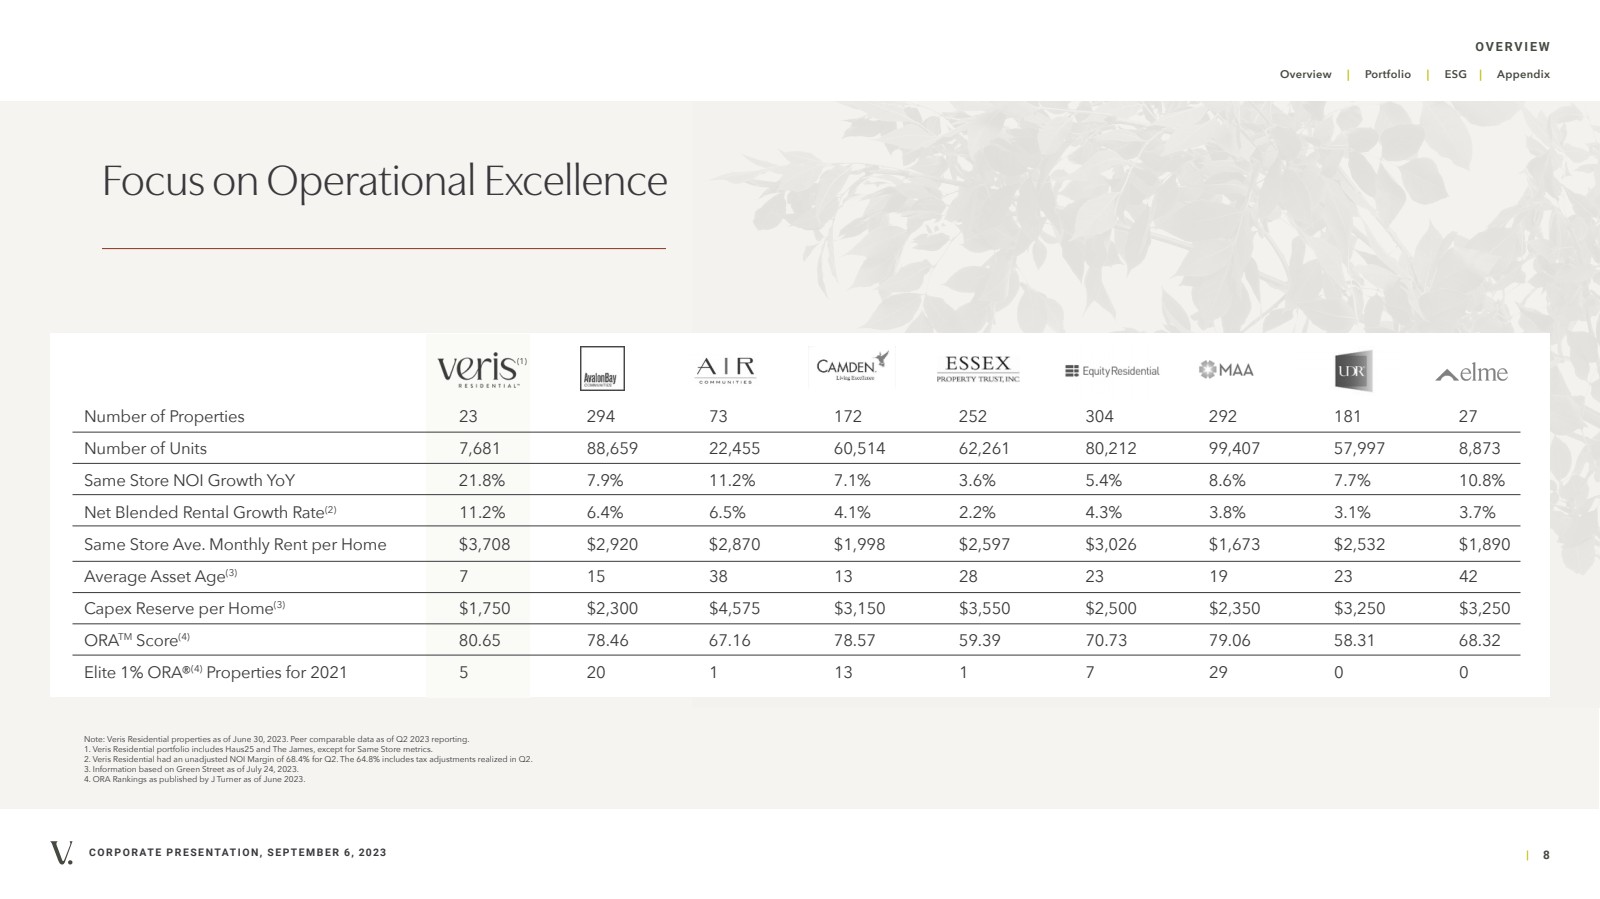
| | 8 Overview | Portfolio | ESG | Appendix CORPORATE PRESENTATION, SEPTEMBER 6, 2023 Focus on Operational Excellence OVERVIEW Number of Properties 23 294 73 172 252 304 292 181 27 Number of Units 7,681 88,659 22,455 60,514 62,261 80,212 99,407 57,997 8,873 Same Store NOI Growth YoY 21.8% 7.9% 11.2% 7.1% 3.6% 5.4% 8.6% 7.7% 10.8% Net Blended Rental Growth Rate(2) 11.2% 6.4% 6.5% 4.1% 2.2% 4.3% 3.8% 3.1% 3.7% Same Store Ave. Monthly Rent per Home $3,708 $2,920 $2,870 $1,998 $2,597 $3,026 $1,673 $2,532 $1,890 Average Asset Age(3) 7 15 38 13 28 23 19 23 42 Capex Reserve per Home(3) $1,750 $2,300 $4,575 $3,150 $3,550 $2,500 $2,350 $3,250 $3,250 ORATM Score(4) 80.65 78.46 67.16 78.57 59.39 70.73 79.06 58.31 68.32 Elite 1% ORA®(4) Properties for 2021 5 20 1 13 1 7 29 0 0 Note: Veris Residential properties as of June 30, 2023. Peer comparable data as of Q2 2023 reporting. 1. Veris Residential portfolio includes Haus25 and The James, except for Same Store metrics. 2. Veris Residential had an unadjusted NOI Margin of 68.4% for Q2. The 64.8% includes tax adjustments realized in Q2. 3. Information based on Green Street as of July 24, 2023. 4. ORA Rankings as published by J Turner as of June 2023. (1) |
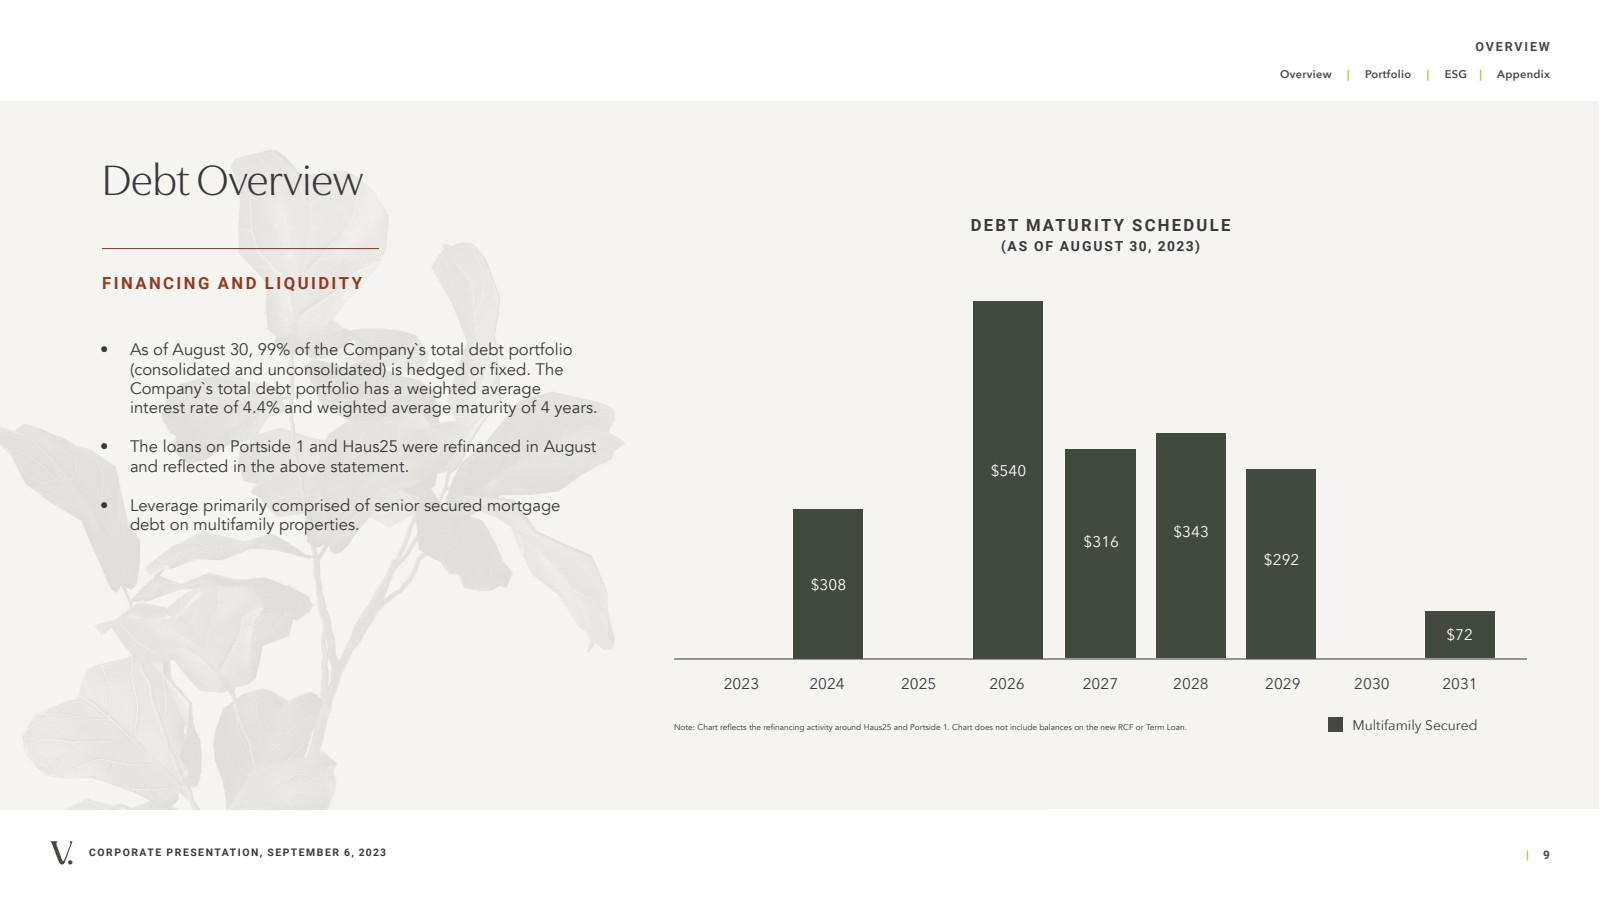
| | 9 Overview | Portfolio | ESG | Appendix CORPORATE PRESENTATION, SEPTEMBER 6, 2023 Debt Overview FINANCING AND LIQUIDITY OVERVIEW • As of August 30, 99% of the Company`s total debt portfolio (consolidated and unconsolidated) is hedged or fixed. The Company`s total debt portfolio has a weighted average interest rate of 4.4% and weighted average maturity of 4 years. • The loans on Portside 1 and Haus25 were refinanced in August and reflected in the above statement. • Leverage primarily comprised of senior secured mortgage debt on multifamily properties. DEBT MATURITY SCHEDULE (AS OF AUGUST 30, 2023) Note: Chart reflects the refinancing activity around Haus25 and Portside 1. Chart does not include balances on the new RCF or Term Loan. Multifamily Secured 2023 2024 2025 2026 2027 2028 2029 2030 2031 $308 $540 $316 $292 $72 $343 |
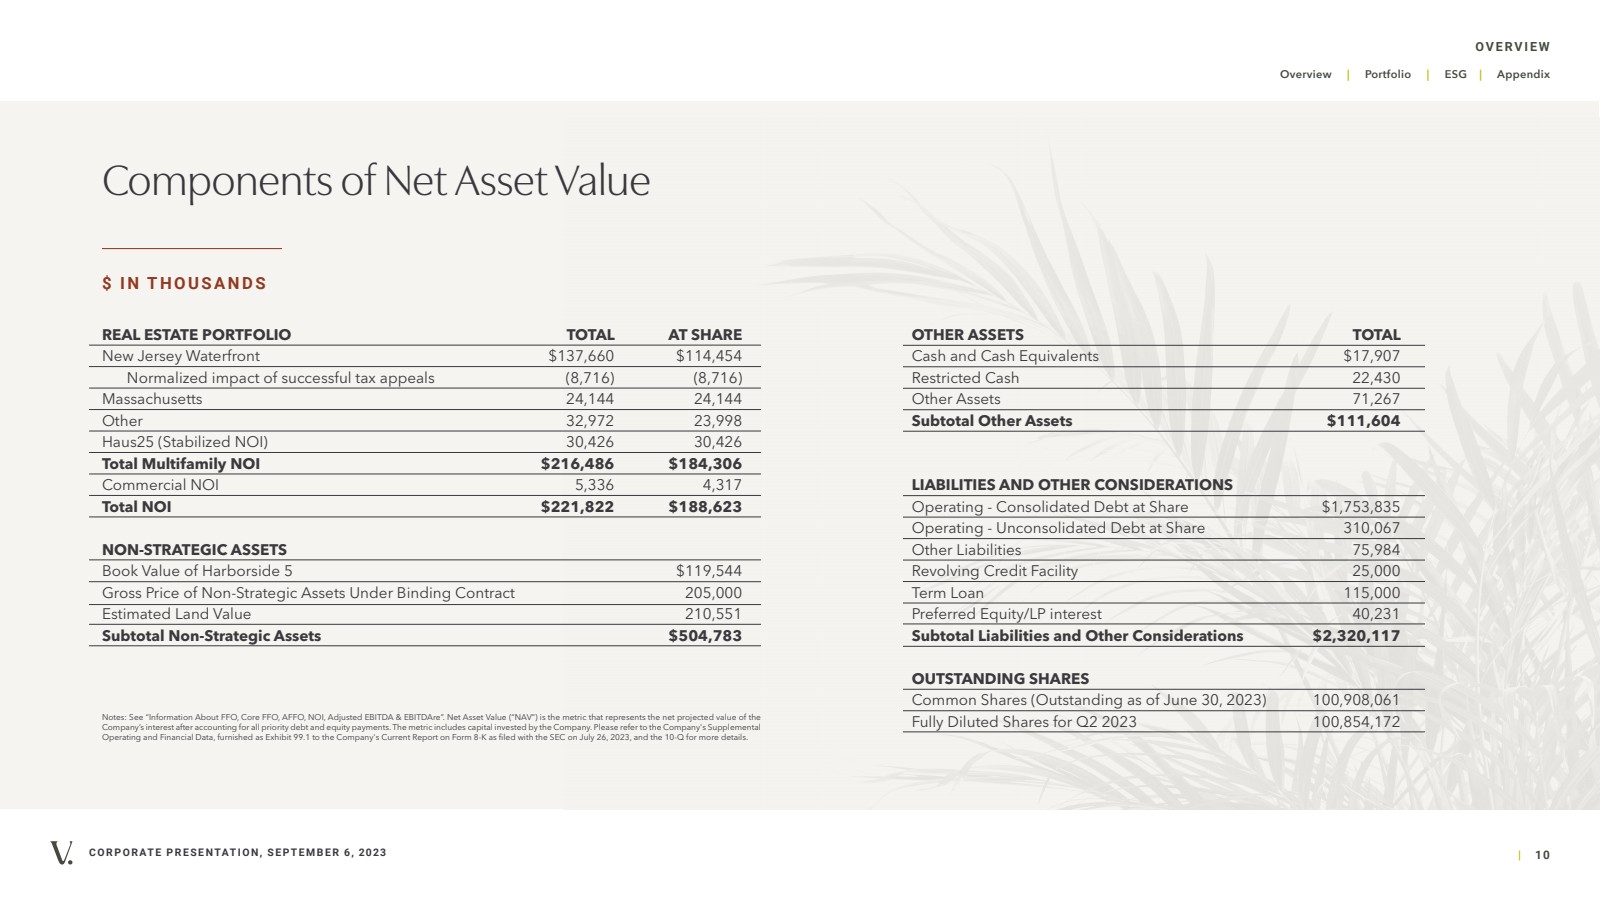
| | 10 Overview | Portfolio | ESG | Appendix CORPORATE PRESENTATION, SEPTEMBER 6, 2023 OVERVIEW Components of Net Asset Value REAL ESTATE PORTFOLIO TOTAL AT SHARE New Jersey Waterfront $137,660 $114,454 Normalized impact of successful tax appeals (8,716) (8,716) Massachusetts 24,144 24,144 Other 32,972 23,998 Haus25 (Stabilized NOI) 30,426 30,426 Total Multifamily NOI $216,486 $184,306 Commercial NOI 5,336 4,317 Total NOI $221,822 $188,623 NON-STRATEGIC ASSETS Book Value of Harborside 5 $119,544 Gross Price of Non-Strategic Assets Under Binding Contract 205,000 Estimated Land Value 210,551 Subtotal Non-Strategic Assets $504,783 OTHER ASSETS TOTAL Cash and Cash Equivalents $17,907 Restricted Cash 22,430 Other Assets 71,267 Subtotal Other Assets $111,604 LIABILITIES AND OTHER CONSIDERATIONS Operating - Consolidated Debt at Share $1,753,835 Operating - Unconsolidated Debt at Share 310,067 Other Liabilities 75,984 Revolving Credit Facility 25,000 Term Loan 115,000 Preferred Equity/LP interest 40,231 Subtotal Liabilities and Other Considerations $2,320,117 OUTSTANDING SHARES Common Shares (Outstanding as of June 30, 2023) 100,908,061 Fully Diluted Shares for Q2 2023 100,854,172 $ IN THOUSANDS Notes: See “Information About FFO, Core FFO, AFFO, NOI, Adjusted EBITDA & EBITDAre”. Net Asset Value (“NAV”) is the metric that represents the net projected value of the Company’s interest after accounting for all priority debt and equity payments. The metric includes capital invested by the Company. Please refer to the Company's Supplemental Operating and Financial Data, furnished as Exhibit 99.1 to the Company's Current Report on Form 8-K as filed with the SEC on July 26, 2023, and the 10-Q for more details. |
| CORPORATE PRESENTATION, SEPTEMBER 6, 2023 | 11 Overview | Portfolio | ESG | Appendix RiverHouse 11, Weehawken, NJ PORTFOLIO Portfolio WHERE PROGRESS COMES TO LIFE |

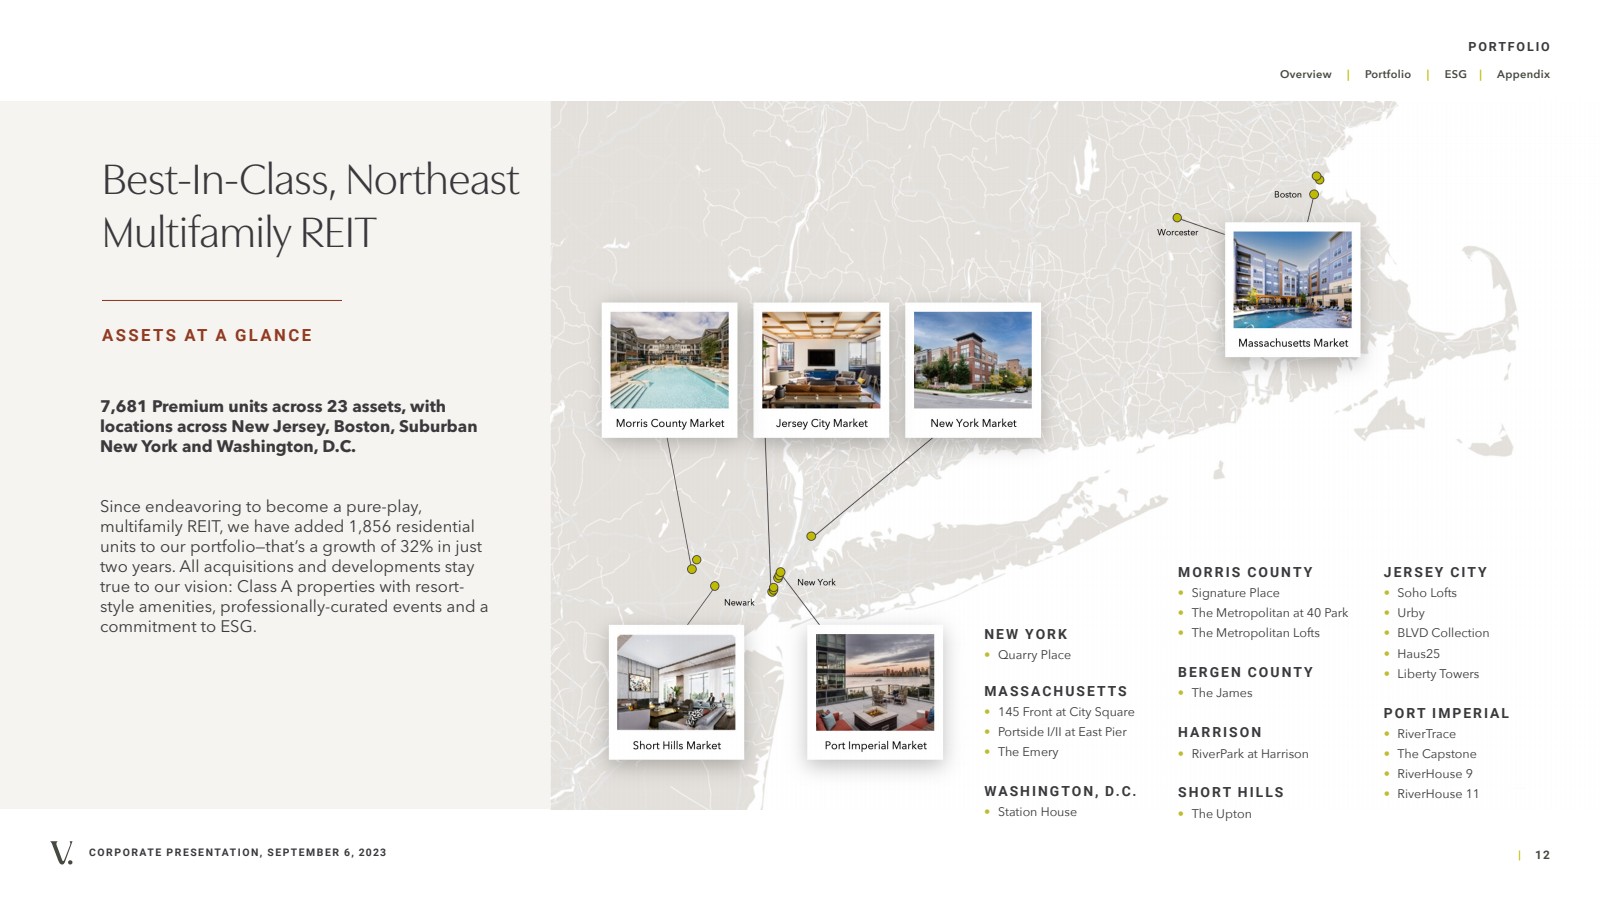
| CORPORATE PRESENTATION, SEPTEMBER 6, 2023 | 12 Overview | Portfolio | ESG | Appendix Best-In-Class, Northeast Multifamily REIT ASSETS AT A GLANCE MORRIS COUNTY • Signature Place • The Metropolitan at 40 Park • The Metropolitan Lofts BERGEN COUNTY • The James HARRISON • RiverPark at Harrison SHORT HILLS • The Upton JERSEY CITY • Soho Lofts • Urby • BLVD Collection • Haus25 • Liberty Towers PORT IMPERIAL • RiverTrace • The Capstone • RiverHouse 9 • RiverHouse 11 NEW YORK • Quarry Place MASSACHUSETTS • 145 Front at City Square • Portside I/II at East Pier • The Emery WASHINGTON, D.C. • Station House 7,681 Premium units across 23 assets, with locations across New Jersey, Boston, Suburban New York and Washington, D.C. Since endeavoring to become a pure-play, multifamily REIT, we have added 1,856 residential units to our portfolio—that’s a growth of 32% in just two years. All acquisitions and developments stay true to our vision: Class A properties with resort-style amenities, professionally-curated events and a commitment to ESG. PORTFOLIO |
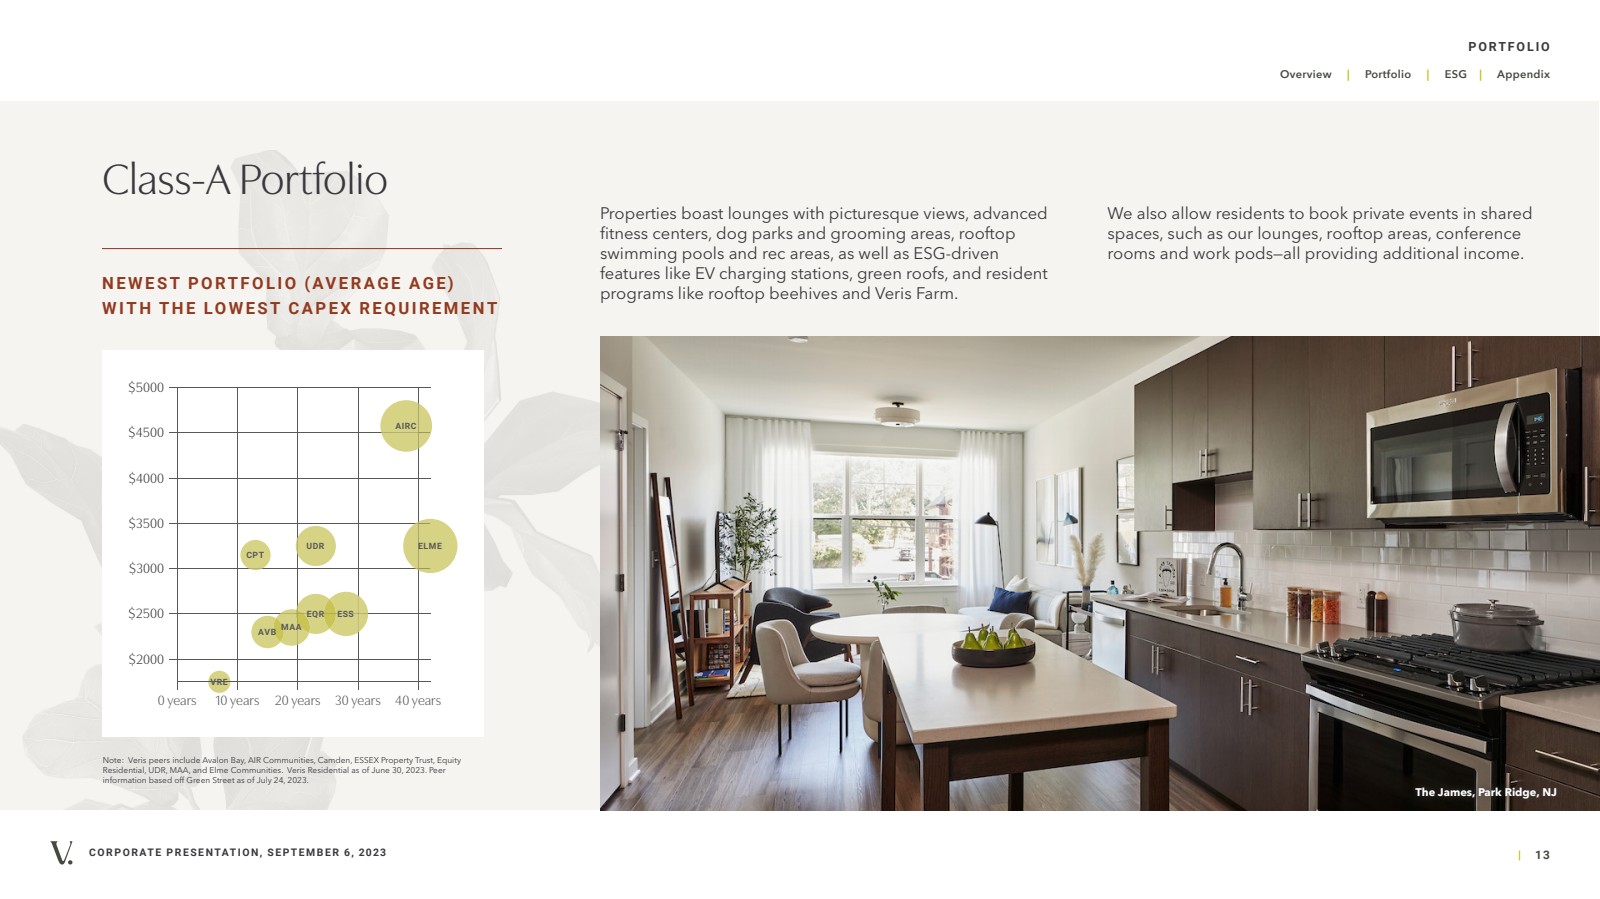
| | 13 Overview | Portfolio | ESG | Appendix CORPORATE PRESENTATION, SEPTEMBER 6, 2023 Class-A Portfolio Properties boast lounges with picturesque views, advanced fitness centers, dog parks and grooming areas, rooftop swimming pools and rec areas, as well as ESG-driven features like EV charging stations, green roofs, and resident programs like rooftop beehives and Veris Farm. Note: Veris peers include Avalon Bay, AIR Communities, Camden, ESSEX Property Trust, Equity Residential, UDR, MAA, and Elme Communities. Veris Residential as of June 30, 2023. Peer information based off Green Street as of July 24, 2023. N E W E S T P O RT F O L I O ( AV E R A G E A G E ) WITH THE LOWEST CAPEX REQUIREMENT The James, Park Ridge, NJ We also allow residents to book private events in shared spaces, such as our lounges, rooftop areas, conference rooms and work pods—all providing additional income. PORTFOLIO 0 years 10 years 20 years 30 years 40 years $2000 $2500 $3000 $3500 $4000 $4500 $5000 ELME AIRC EQR ESS UDR MAA AVB CPT VRE |
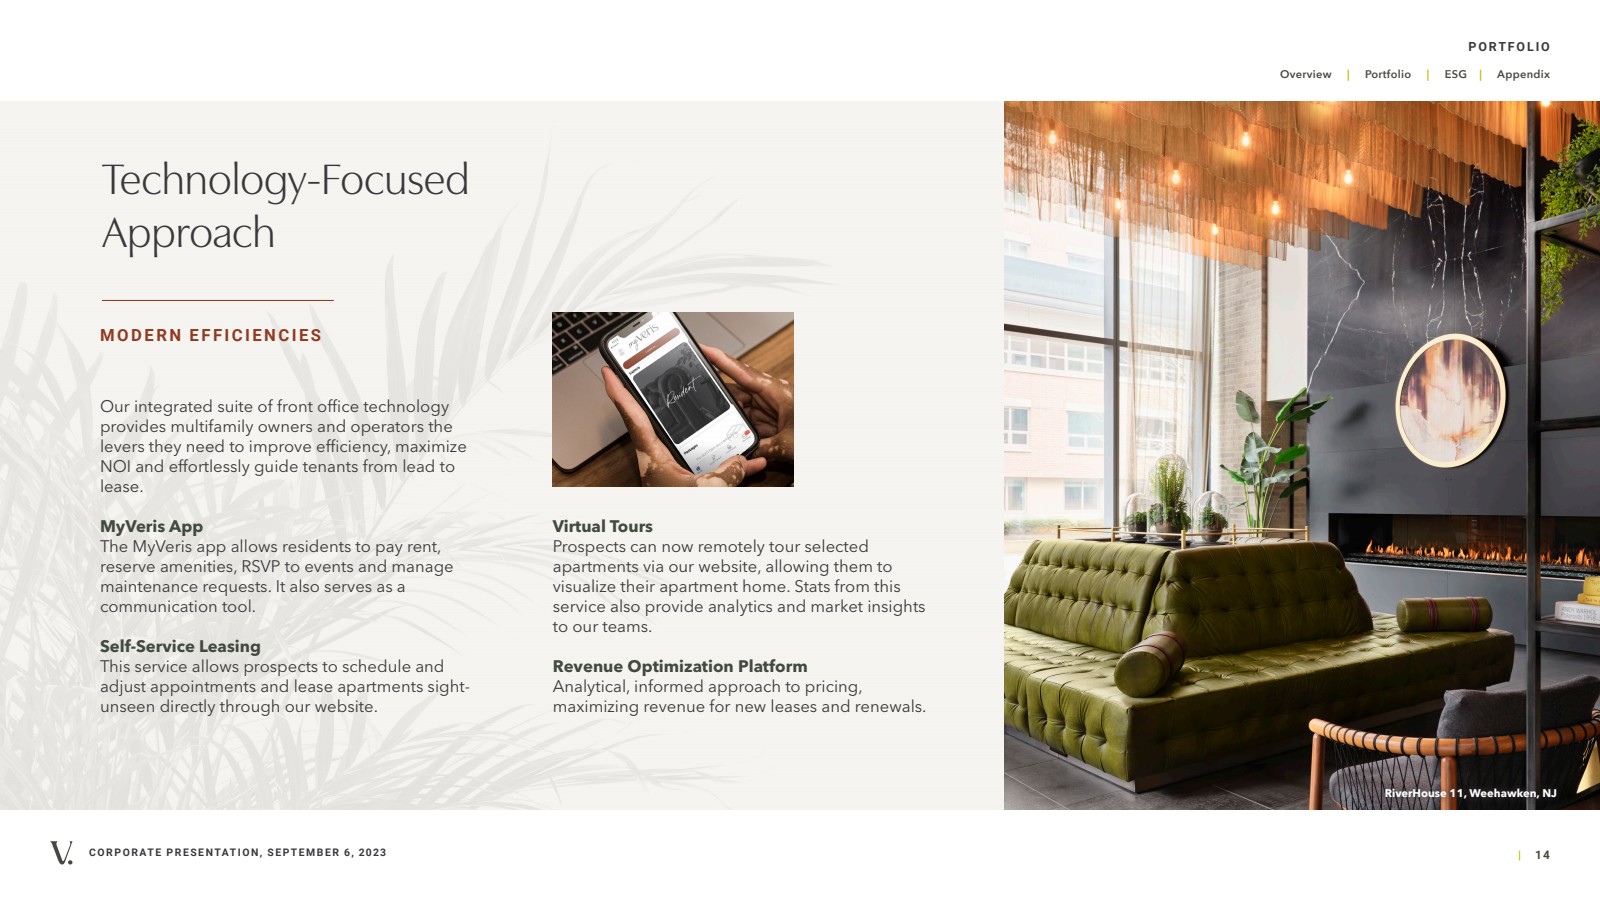
| | 14 Overview | Portfolio | ESG | Appendix CORPORATE PRESENTATION, SEPTEMBER 6, 2023 Our integrated suite of front office technology provides multifamily owners and operators the levers they need to improve efficiency, maximize NOI and effortlessly guide tenants from lead to lease. MyVeris App The MyVeris app allows residents to pay rent, reserve amenities, RSVP to events and manage maintenance requests. It also serves as a communication tool. Self-Service Leasing This service allows prospects to schedule and adjust appointments and lease apartments sight-unseen directly through our website. Technology-Focused Approach M O D E R N E F F I C I E N C I E S Virtual Tours Prospects can now remotely tour selected apartments via our website, allowing them to visualize their apartment home. Stats from this service also provide analytics and market insights to our teams. Revenue Optimization Platform Analytical, informed approach to pricing, maximizing revenue for new leases and renewals. RiverHouse 11, Weehawken, NJ PORTFOLIO |
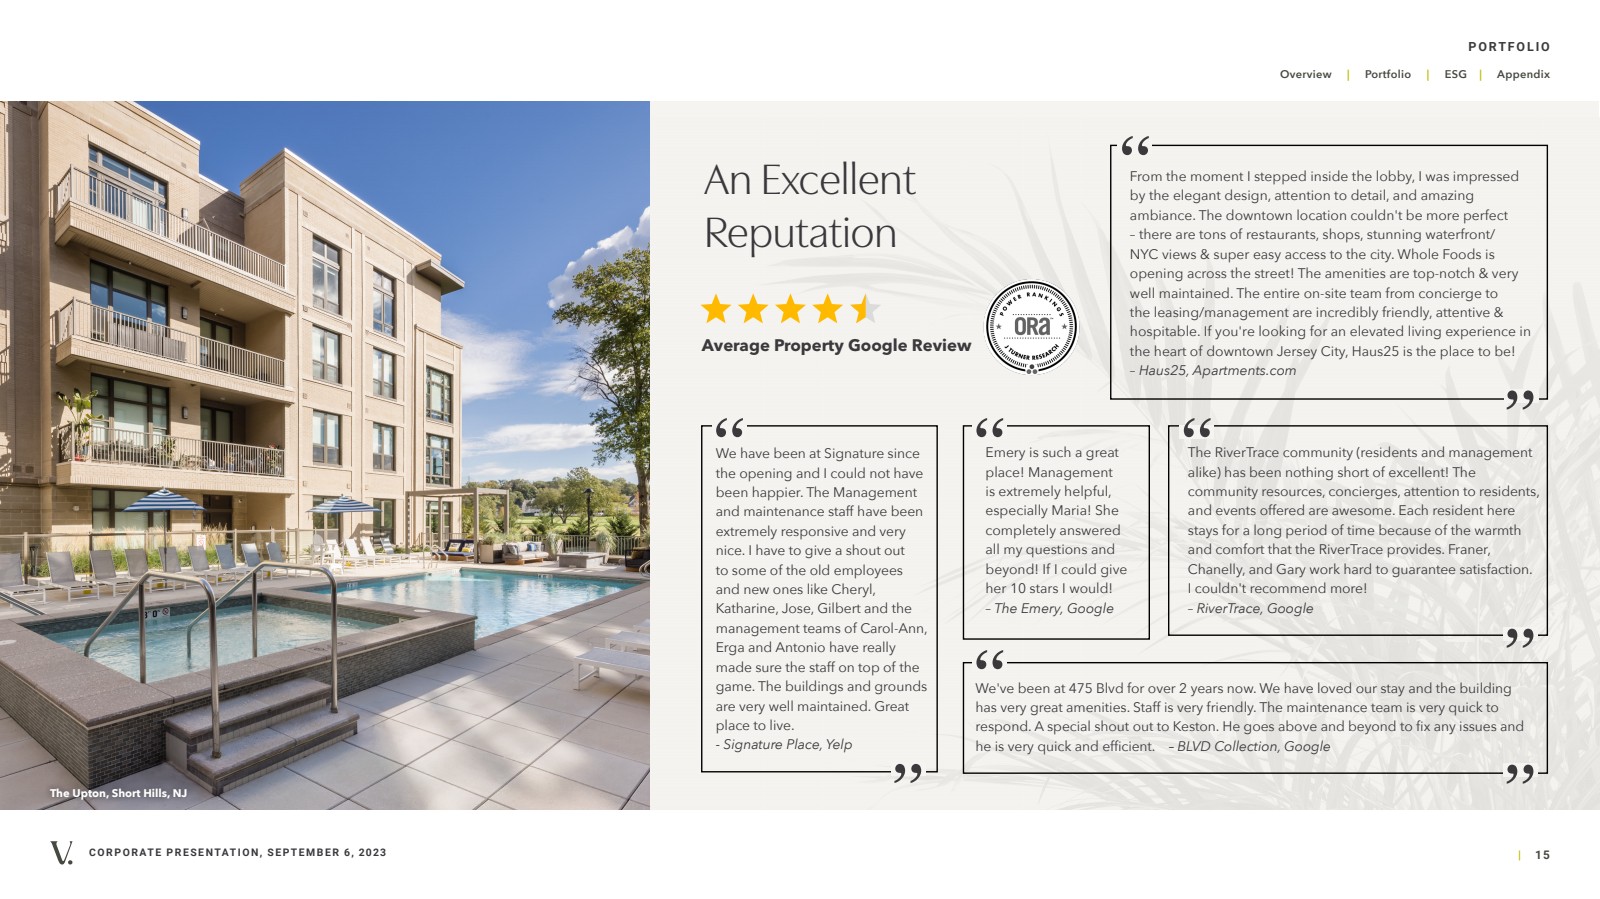
| | 15 Overview | Portfolio | ESG | Appendix CORPORATE PRESENTATION, SEPTEMBER 6, 2023 The Upton, Short Hills, NJ PORTFOLIO An Excellent Reputation Average Property Google Review We have been at Signature since the opening and I could not have been happier. The Management and maintenance staff have been extremely responsive and very nice. I have to give a shout out to some of the old employees and new ones like Cheryl, Katharine, Jose, Gilbert and the management teams of Carol-Ann, Erga and Antonio have really made sure the staff on top of the game. The buildings and grounds are very well maintained. Great place to live. - Signature Place, Yelp The RiverTrace community (residents and management alike) has been nothing short of excellent! The community resources, concierges, attention to residents, and events offered are awesome. Each resident here stays for a long period of time because of the warmth and comfort that the RiverTrace provides. Franer, Chanelly, and Gary work hard to guarantee satisfaction. I couldn't recommend more! – RiverTrace, Google Emery is such a great place! Management is extremely helpful, especially Maria! She completely answered all my questions and beyond! If I could give her 10 stars I would! – The Emery, Google From the moment I stepped inside the lobby, I was impressed by the elegant design, attention to detail, and amazing ambiance. The downtown location couldn't be more perfect – there are tons of restaurants, shops, stunning waterfront/ NYC views & super easy access to the city. Whole Foods is opening across the street! The amenities are top-notch & very well maintained. The entire on-site team from concierge to the leasing/management are incredibly friendly, attentive & hospitable. If you're looking for an elevated living experience in the heart of downtown Jersey City, Haus25 is the place to be! – Haus25, Apartments.com “ “ “ “ “ “ “ We've been at 475 Blvd for over 2 years now. We have loved our stay and the building has very great amenities. Staff is very friendly. The maintenance team is very quick to respond. A special shout out to Keston. He goes above and beyond to fix any issues and he is very quick and efficient. – BLVD Collection, Google “ “ |
| CORPORATE PRESENTATION, SEPTEMBER 6, 2023 | 16 Overview | Portfolio | ESG | Appendix RiverHouse 11, Weehawken, NJ PORTFOLIO Commitment to ESG P R O P E RT I E S , P E O P L E , P L A N E T. ESG |

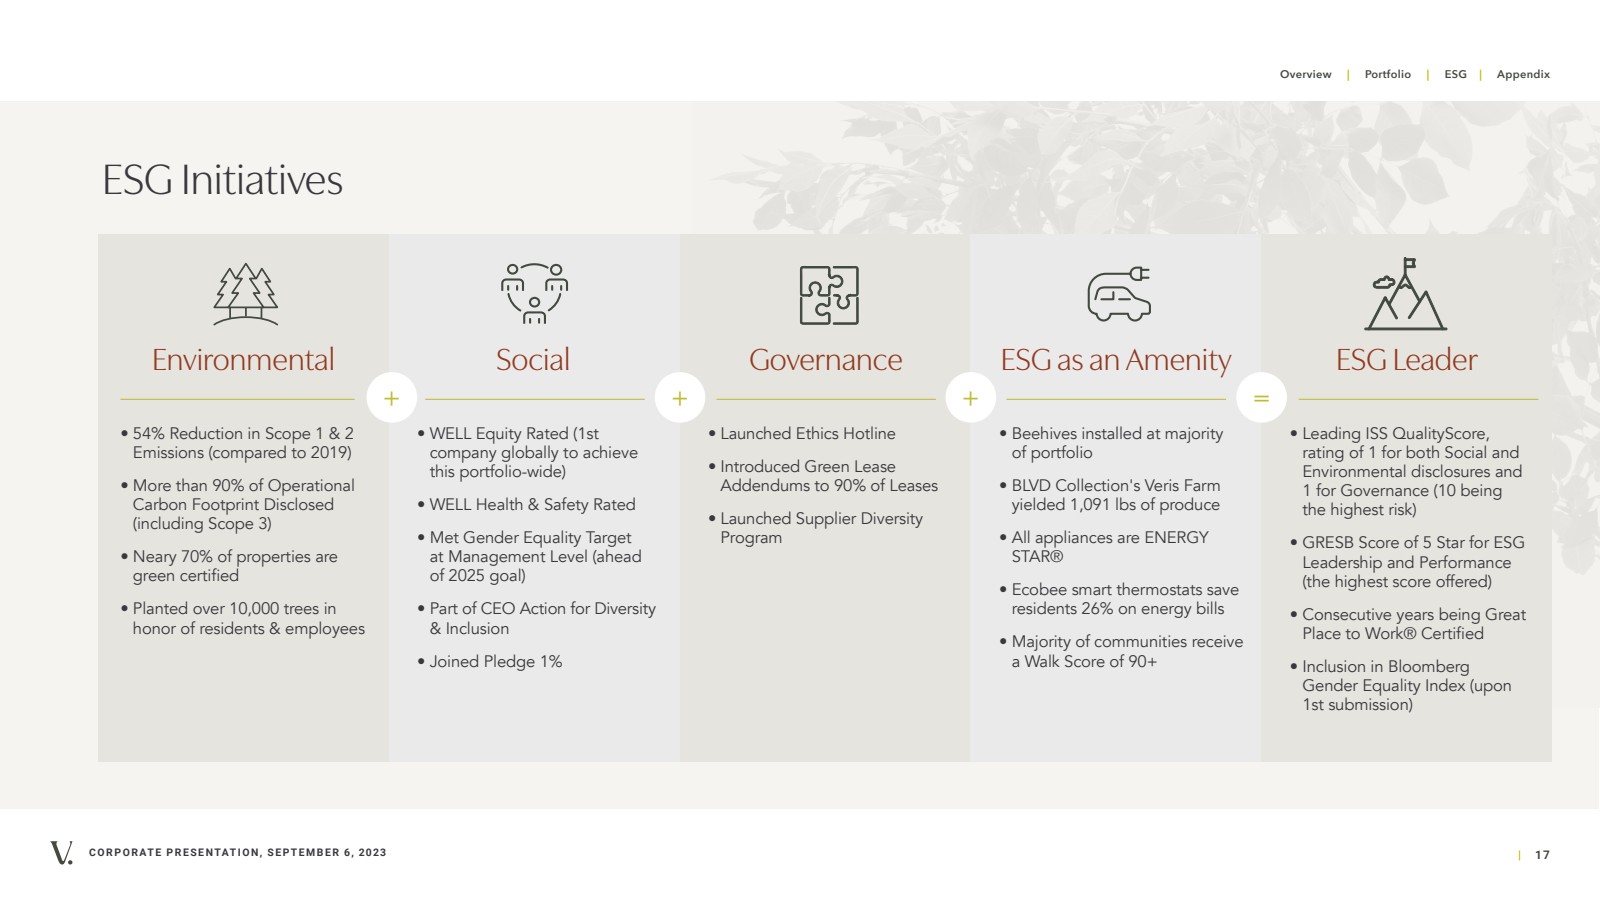
| | 17 Overview | Portfolio | ESG | Appendix CORPORATE PRESENTATION, SEPTEMBER 6, 2023 Environmental Social Governance ESG as an Amenity ESG Leader ESG Initiatives + + + = • 54% Reduction in Scope 1 & 2 Emissions (compared to 2019) • More than 90% of Operational Carbon Footprint Disclosed (including Scope 3) • Neary 70% of properties are green certified • Planted over 10,000 trees in honor of residents & employees • WELL Equity Rated (1st company globally to achieve this portfolio-wide) • WELL Health & Safety Rated • Met Gender Equality Target at Management Level (ahead of 2025 goal) • Part of CEO Action for Diversity & Inclusion • Joined Pledge 1% • Launched Ethics Hotline • Introduced Green Lease Addendums to 90% of Leases • Launched Supplier Diversity Program • Beehives installed at majority of portfolio • BLVD Collection's Veris Farm yielded 1,091 lbs of produce • All appliances are ENERGY STAR® • Ecobee smart thermostats save residents 26% on energy bills • Majority of communities receive a Walk Score of 90+ • Leading ISS QualityScore, rating of 1 for both Social and Environmental disclosures and 1 for Governance (10 being the highest risk) • GRESB Score of 5 Star for ESG Leadership and Performance (the highest score offered) • Consecutive years being Great Place to Work® Certified • Inclusion in Bloomberg Gender Equality Index (upon 1st submission) |
| CORPORATE PRESENTATION, SEPTEMBER 6, 2023 | 18 Overview | Portfolio | ESG | Appendix Portside, East Boston, MA APPENDIX ADDITIONAL CONTENT & DEFINITIONS Appendix |

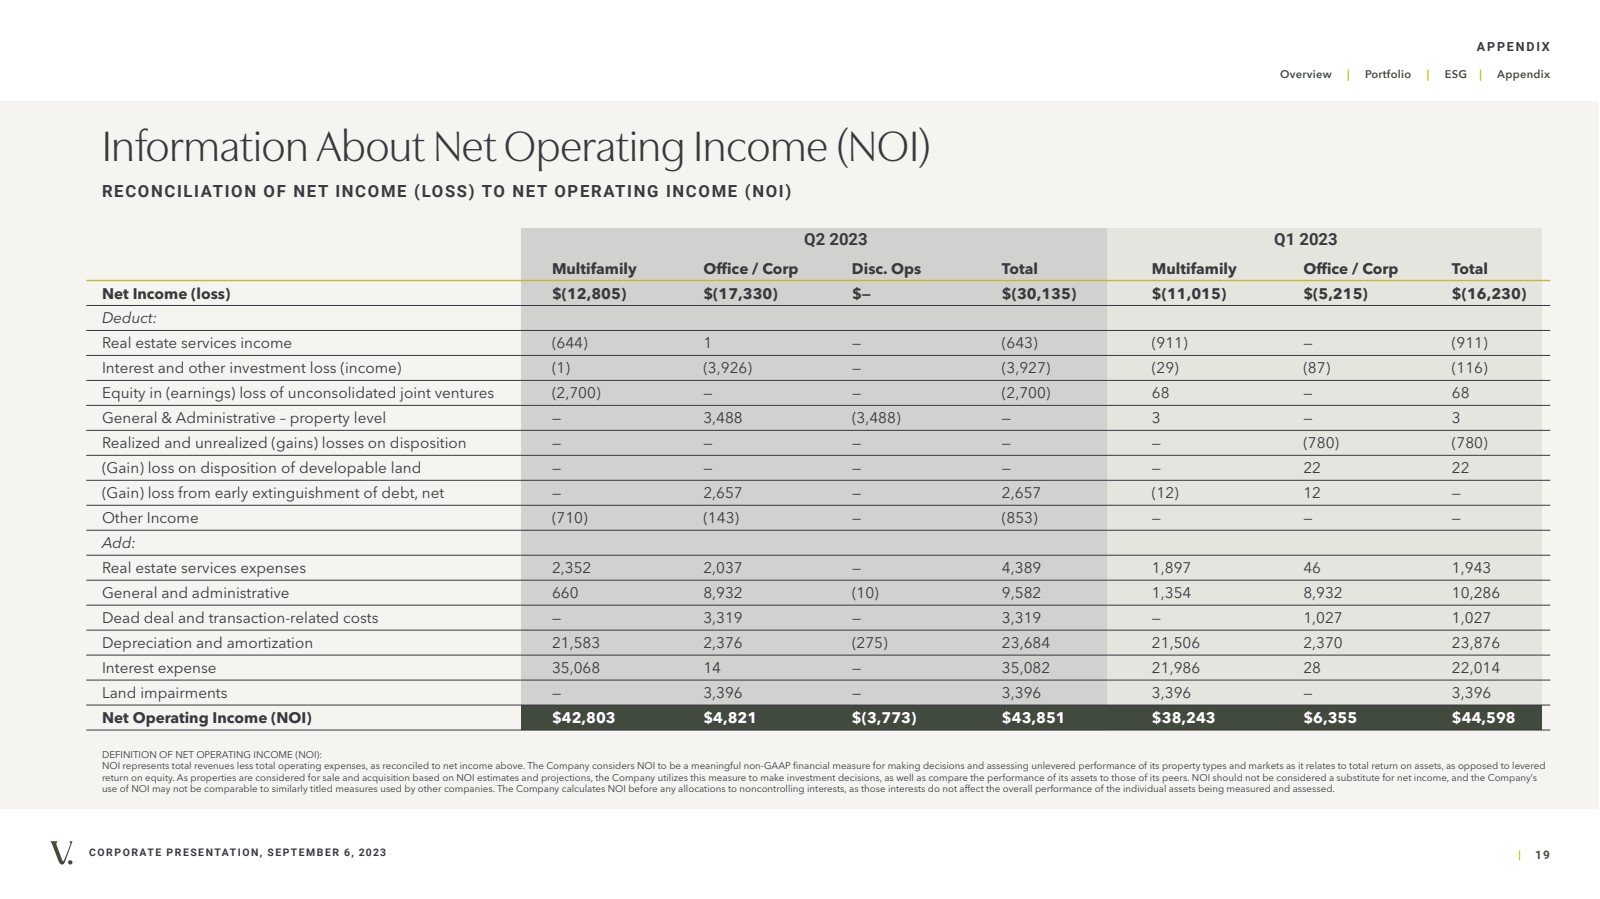
| CORPORATE PRESENTATION, SEPTEMBER 6, 2023 | 19 Overview | Portfolio | ESG | Appendix Multifamily Office / Corp Disc. Ops Total Multifamily Office / Corp Total Net Income (loss) $(12,805) $(17,330) $— $(30,135) $(11,015) $(5,215) $(16,230) Deduct: Real estate services income (644) 1 — (643) (911) — (911) Interest and other investment loss (income) (1) (3,926) — (3,927) (29) (87) (116) Equity in (earnings) loss of unconsolidated joint ventures (2,700) — — (2,700) 68 — 68 General & Administrative – property level — 3,488 (3,488) — 3 — 3 Realized and unrealized (gains) losses on disposition — — — — — (780) (780) (Gain) loss on disposition of developable land — — — — — 22 22 (Gain) loss from early extinguishment of debt, net — 2,657 — 2,657 (12) 12 — Other Income (710) (143) — (853) — — — Add: Real estate services expenses 2,352 2,037 — 4,389 1,897 46 1,943 General and administrative 660 8,932 (10) 9,582 1,354 8,932 10,286 Dead deal and transaction-related costs — 3,319 — 3,319 — 1,027 1,027 Depreciation and amortization 21,583 2,376 (275) 23,684 21,506 2,370 23,876 Interest expense 35,068 14 — 35,082 21,986 28 22,014 Land impairments — 3,396 — 3,396 3,396 — 3,396 Net Operating Income (NOI) $42,803 $4,821 $(3,773) $43,851 $38,243 $6,355 $44,598 DEFINITION OF NET OPERATING INCOME (NOI): NOI represents total revenues less total operating expenses, as reconciled to net income above. The Company considers NOI to be a meaningful non-GAAP financial measure for making decisions and assessing unlevered performance of its property types and markets as it relates to total return on assets, as opposed to levered return on equity. As properties are considered for sale and acquisition based on NOI estimates and projections, the Company utilizes this measure to make investment decisions, as well as compare the performance of its assets to those of its peers. NOI should not be considered a substitute for net income, and the Company’s use of NOI may not be comparable to similarly titled measures used by other companies. The Company calculates NOI before any allocations to noncontrolling interests, as those interests do not affect the overall performance of the individual assets being measured and assessed. Information About Net Operating Income (NOI) RECONCILIATION OF NET INCOME (LOSS) TO NET OPERATING INCOME (NOI) Q2 2023 Q1 2023 APPENDIX |
| CORPORATE PRESENTATION, SEPTEMBER 6, 2023 | 20 Overview | Portfolio | ESG | Appendix Definitions Net Blended Rental Growth Rate combines new lease and renewal lease growth rates. New lease growth rate refers to the difference in rent a new occupant of a unit is paying compared to the rent the unit’s previous occupant was paying on a net effective basis. Renewal lease growth rate refers to the increase or decrease in monthly rent in a renewed lease compared to the previous lease on a net effective basis. Average Effective Monthly Rent Per Home represents the average effective rent (net of concessions) for in-place leases and the market rent for vacant homes. ORA™ score is an aggregate compilation of a property’s ratings across various review sites. Each month, J Turner Research monitors the online ratings of more than 120,000 properties nationwide. Using a statistical model, a single score based on a scale of 0 to 100 is assigned to each property. Elite 1% ORA® Properties for 2021 is an annual ranking of the 128,000 properties assessed by ORA® nationally. The top 1% make it to the list, typically requiring a property score above 95. Same Store includes properties that were owned for the entirety of the years being compared and exclude properties under redevelopment or development and properties acquired, sold or classified as held for sale during the years being compared. APPENDIX |
| THIS PRESENTATION HAS BEEN FORMATTED FOR SCREENS. PLEASE CONSIDER THE ENVIRONMENT BEFORE PRINTING. Thank You |