| CORPORATE PRESENTATION, MARCH 3, 2023 | 1 Overview | Portfolio | ESG | Appendix S E R V I N G P R O P E RT I E S , P E O P L E , A N D T H E P L A N E T. Corporate Presentation MARCH 3, 2023 |

| | 2 Overview | Portfolio | ESG | Appendix CORPORATE PRESENTATION, MARCH 3, 2023 This Operating and Financial Data should be read in connection with our Annual Report on Form 10-K for the year ended December 31, 2022. Statements made in this presentation may be forward-looking statements within the meaning of Section 21E of the Securities Exchange Act of 1934, as amended. Such for-ward-looking statements are intended to be covered by the safe harbor provisions for forward-looking statements contained in Section 21E of such act. Such forward-look-ing statements relate to, without limitation, our future economic performance, plans and objectives for future operations and projections of revenue and other financial items. Forward-looking statements can be identified by the use of words such as “may,” “will,” “plan,” “potential,” “projected,” “should,” “expect,” “anticipate,” “estimate,” “target,” “continue” or comparable terminology. Forward-looking statements are inherently subject to certain risks, trends and uncertainties, many of which we cannot predict with accuracy and some of which we might not even anticipate. Although we believe that the expectations reflected in such forward-looking statements are based upon reasonable assumptions at the time made, we can give no assurance that such expectations will be achieved. Future events and actual results, financial and otherwise, may differ materially from the results discussed in the forward-looking statements. Readers are cautioned not to place undue reliance on these forward-looking statements and are advised to consider the factors listed above together with the additional factors under the heading “Disclosure Regarding Forward-Looking Statements” and “Risk Factors” in our annual reports on Form 10-K, as may be supplemented or amended by our quarterly reports on Form 10-Q, which are incorporated herein by reference. We assume no obligation to update or supplement forward-looking statements that become untrue because of subsequent events, new information or otherwise. OVERVIEW FORWARD-LOOKING STATEMENTS |
| CORPORATE PRESENTATION, MARCH 3, 2023 | 3 Overview | Portfolio | ESG | Appendix OVERVIEW Capstone, West New York, New Jersey Overview THE QUARTER IN REVIEW |

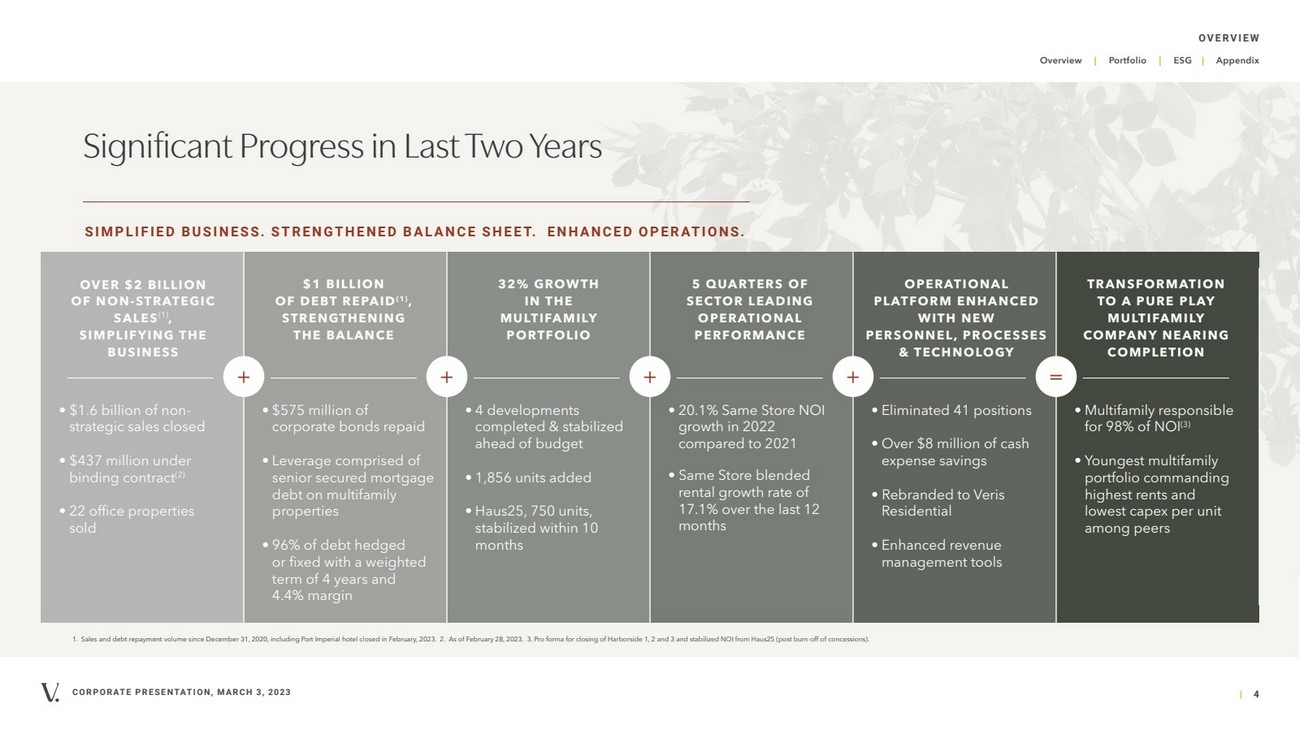
| | 4 Overview | Portfolio | ESG | Appendix CORPORATE PRESENTATION, MARCH 3, 2023 Significant Progress in Last Two Years S I M P L I F I E D B U S I N E S S . S T R E N G T H E N E D B A L A N C E S H E E T. E N H A N C E D O P E R AT I O N S . OVER $2 BILLION OF NON-STRATEGIC SALES(1), SIMPLIFYING THE BUSINESS $1 BILLION OF DEBT REPAID(1), STRENGTHENING THE BALANCE 32% GROWTH IN THE MULTIFAMILY PORTFOLIO 5 QUARTERS OF SECTOR LEADING OPERATIONAL PERFORMANCE OPERATIONAL PLATFORM ENHANCED WITH NEW PERSONNEL, PROCESSES & TECHNOLOGY TRANSFORMATION TO A PURE PLAY MULTIFAMILY COMPANY NEARING COMPLETION • $1.6 billion of non-strategic sales closed • $437 million under binding contract(2) • 22 office properties sold • $575 million of corporate bonds repaid • Leverage comprised of senior secured mortgage debt on multifamily properties • 96% of debt hedged or fixed with a weighted term of 4 years and 4.4% margin • 4 developments completed & stabilized ahead of budget • 1,856 units added • Haus25, 750 units, stabilized within 10 months • 20.1% Same Store NOI growth in 2022 compared to 2021 • Same Store blended rental growth rate of 17.1% over the last 12 months • Eliminated 41 positions • Over $8 million of cash expense savings • Rebranded to Veris Residential • Enhanced revenue management tools • Multifamily responsible for 98% of NOI(3) • Youngest multifamily portfolio commanding highest rents and lowest capex per unit among peers 1. Sales and debt repayment volume since December 31, 2020, including Port Imperial hotel closed in February, 2023. 2. As of February 28, 2023. 3. Pro forma for closing of Harborside 1, 2 and 3 and stabilized NOI from Haus25 (post burn-off of concessions). OVERVIEW + + + + = |
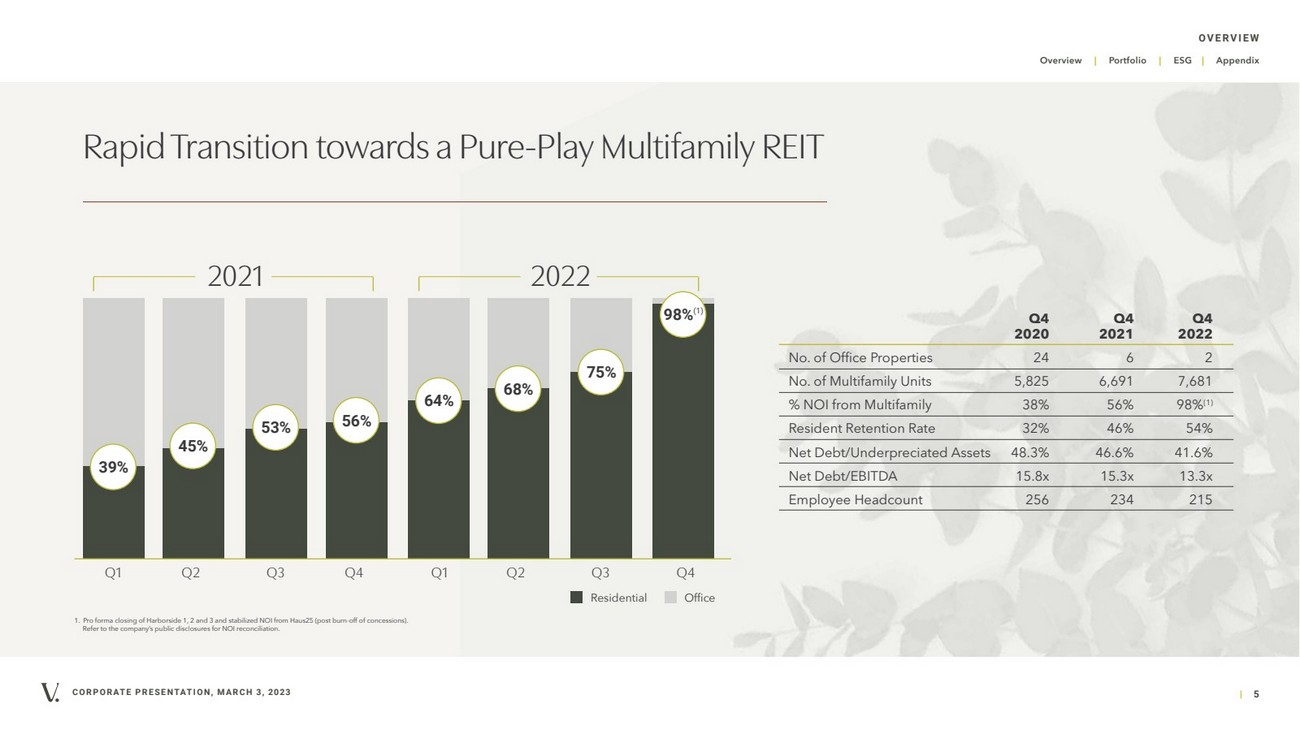
| | 5 Overview | Portfolio | ESG | Appendix CORPORATE PRESENTATION, MARCH 3, 2023 Rapid Transition towards a Pure-Play Multifamily REIT 39% 45% 53% 56% 64% 68% 75% 2021 1. Pro forma closing of Harborside 1, 2 and 3 and stabilized NOI from Haus25 (post burn-off of concessions). Refer to the company’s public disclosures for NOI reconciliation. Residential Office 98%(1) Q1 Q2 Q3 Q4 Q1 Q2 Q3 Q4 Q4 Q4 Q4 2020 2021 2022 No. of Office Properties 24 6 2 No. of Multifamily Units 5,825 6,691 7,681 % NOI from Multifamily 38% 56% 98%(1) Resident Retention Rate 32% 46% 54% Net Debt/Underpreciated Assets 48.3% 46.6% 41.6% Net Debt/EBITDA 15.8x 15.3x 13.3x Employee Headcount 256 234 215 2022 OVERVIEW |
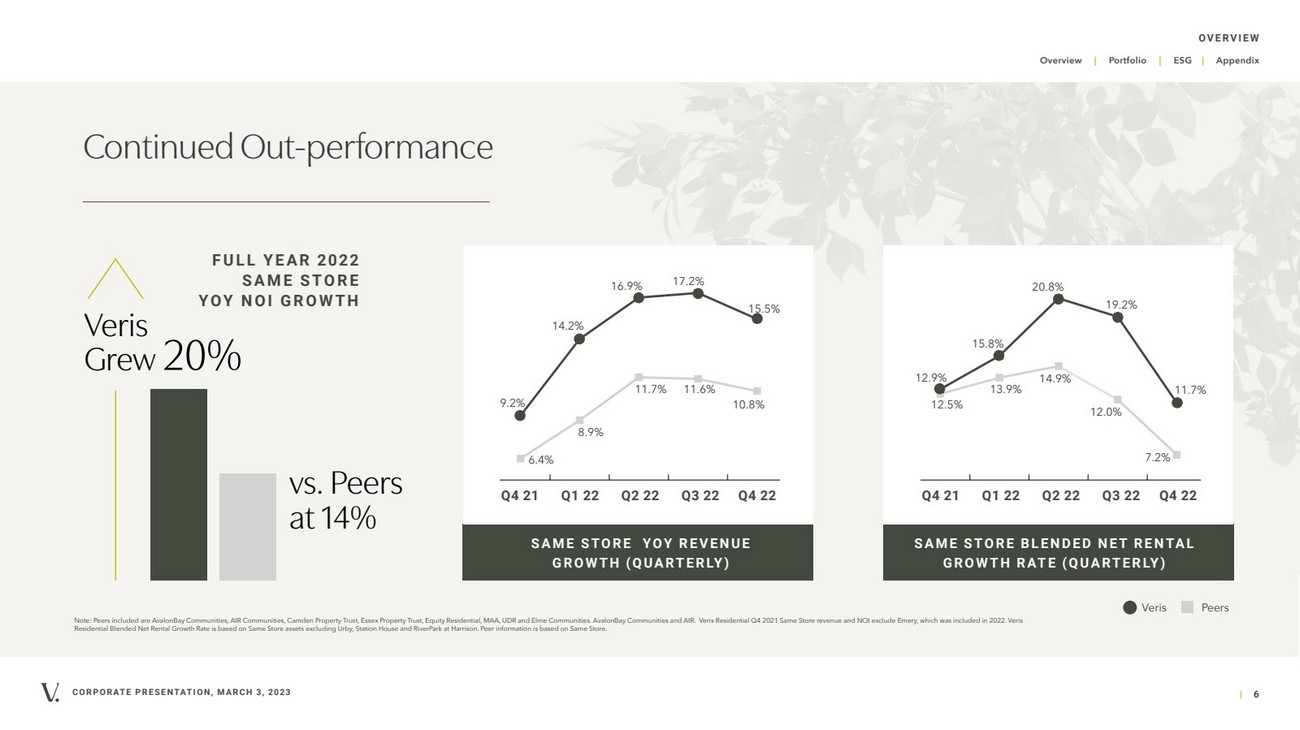
| | 6 Overview | Portfolio | ESG | Appendix CORPORATE PRESENTATION, MARCH 3, 2023 Continued Out-performance OVERVIEW Note: Peers included are AvalonBay Communities, AIR Communities, Camden Property Trust, Essex Property Trust, Equity Residential, MAA, UDR and Elme Communities. AvalonBay Communities and AIR. Veris Residential Q4 2021 Same Store revenue and NOI exclude Emery, which was included in 2022. Veris Residential Blended Net Rental Growth Rate is based on Same Store assets excluding Urby, Station House and RiverPark at Harrison. Peer information is based on Same Store. Veris Grew 20% FULL YEAR 2022 S A M E S TO R E YOY NOI GROWTH S A M E S TO R E YOY R E V E N U E G R O W T H (Q U A RT E R LY ) SAME STORE BLENDED NET RENTAL G R O W T H R AT E (Q U A RT E R LY ) vs. Peers at 14% 5 10 15 20 5 10 15 20 25 Q4 21 Q1 22 Q2 22 Q3 22 Q4 22 Q4 21 Q1 22 Q2 22 Q3 22 Q4 22 Veris Peers 14.2% 16.9% 17.2% 15.5% 6.4% 8.9% 11.7% 11.6% 10.8% 12.9% 15.8% 20.8% 19.2% 11.7% 12.5% 13.9% 14.9% 12.0% 7.2% 9.2% |
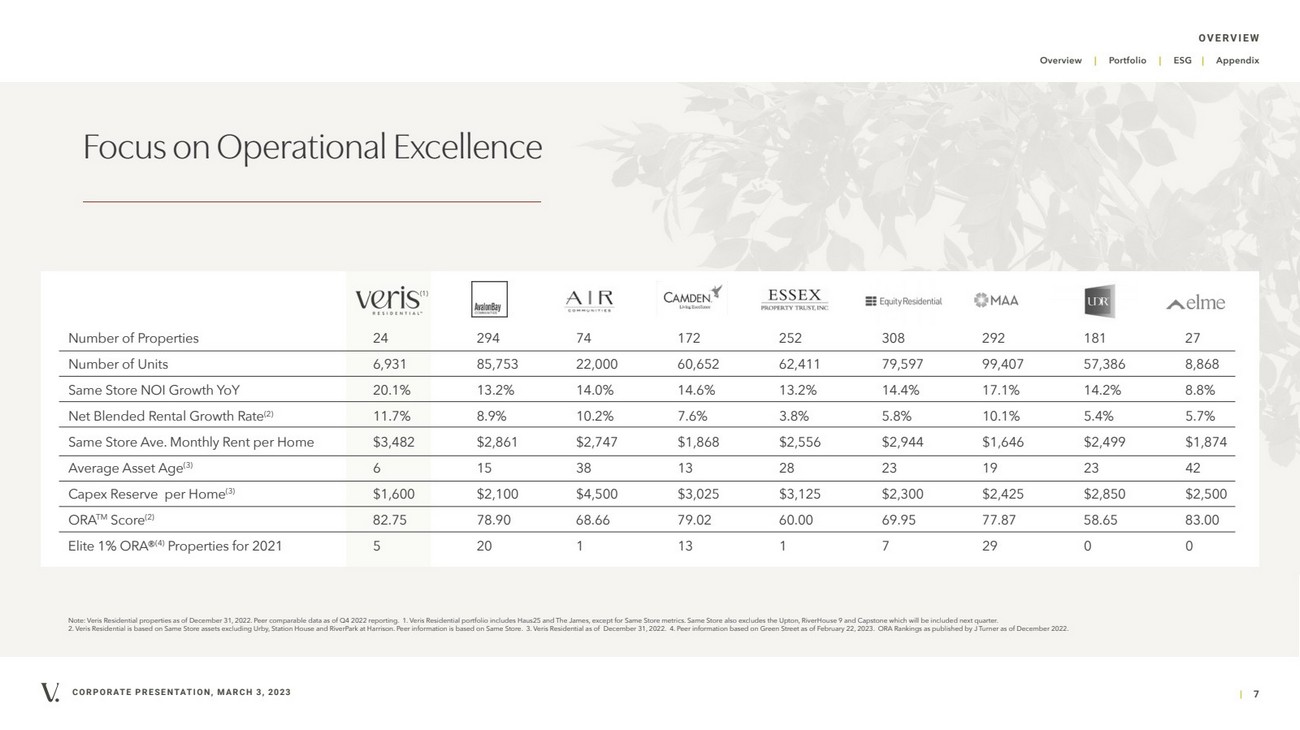
| | 7 Overview | Portfolio | ESG | Appendix CORPORATE PRESENTATION, MARCH 3, 2023 Focus on Operational Excellence OVERVIEW Number of Properties 24 294 74 172 252 308 292 181 27 Number of Units 6,931 85,753 22,000 60,652 62,411 79,597 99,407 57,386 8,868 Same Store NOI Growth YoY 20.1% 13.2% 14.0% 14.6% 13.2% 14.4% 17.1% 14.2% 8.8% Net Blended Rental Growth Rate(2) 11.7% 8.9% 10.2% 7.6% 3.8% 5.8% 10.1% 5.4% 5.7% Same Store Ave. Monthly Rent per Home $3,482 $2,861 $2,747 $1,868 $2,556 $2,944 $1,646 $2,499 $1,874 Average Asset Age(3) 6 15 38 13 28 23 19 23 42 Capex Reserve per Home(3) $1,600 $2,100 $4,500 $3,025 $3,125 $2,300 $2,425 $2,850 $2,500 ORATM Score(2) 82.75 78.90 68.66 79.02 60.00 69.95 77.87 58.65 83.00 Elite 1% ORA®(4) Properties for 2021 5 20 1 13 1 7 29 0 0 Note: Veris Residential properties as of December 31, 2022. Peer comparable data as of Q4 2022 reporting. 1. Veris Residential portfolio includes Haus25 and The James, except for Same Store metrics. Same Store also excludes the Upton, RiverHouse 9 and Capstone which will be included next quarter. 2. Veris Residential is based on Same Store assets excluding Urby, Station House and RiverPark at Harrison. Peer information is based on Same Store. 3. Veris Residential as of December 31, 2022. 4. Peer information based on Green Street as of February 22, 2023. ORA Rankings as published by J Turner as of December 2022. (1) |
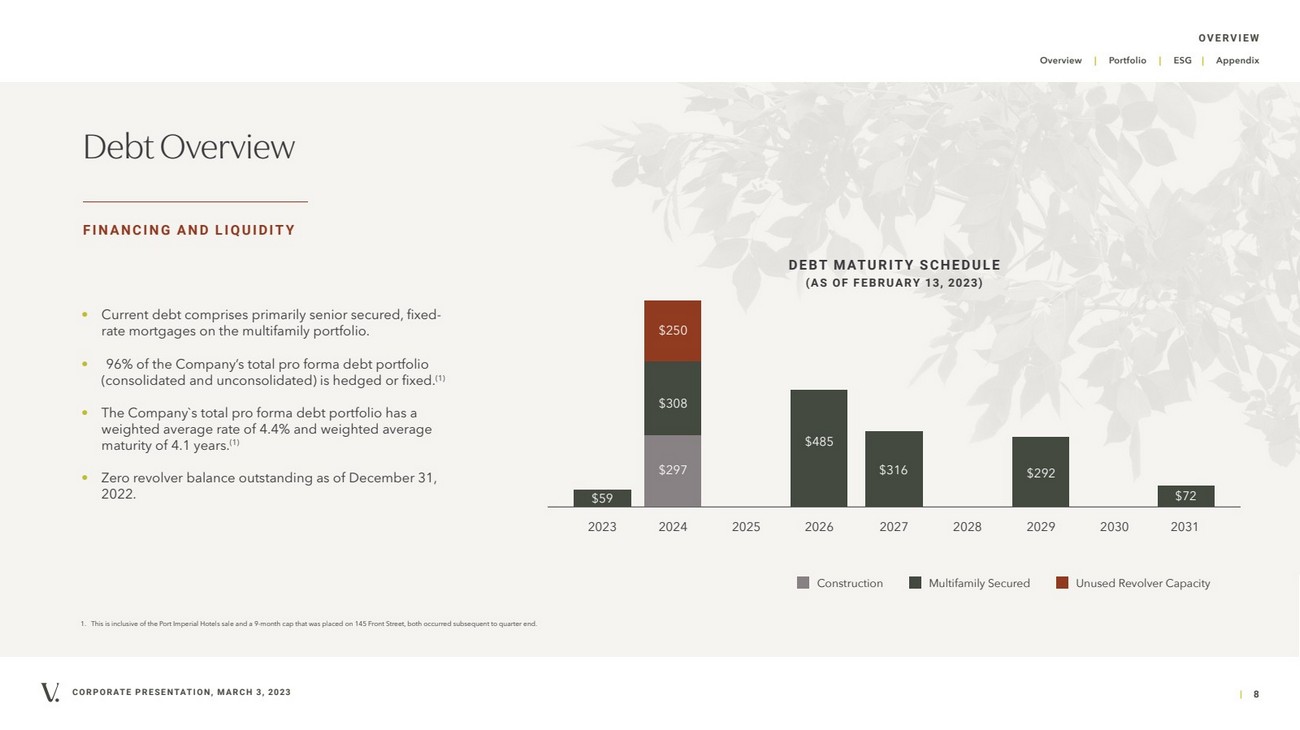
| | 8 Overview | Portfolio | ESG | Appendix CORPORATE PRESENTATION, MARCH 3, 2023 Debt Overview FINANCING AND LIQUIDITY OVERVIEW • Current debt comprises primarily senior secured, fixed-rate mortgages on the multifamily portfolio. • 96% of the Company’s total pro forma debt portfolio (consolidated and unconsolidated) is hedged or fixed.(1) • The Company`s total pro forma debt portfolio has a weighted average rate of 4.4% and weighted average maturity of 4.1 years.(1) • Zero revolver balance outstanding as of December 31, 2022. DEBT MATURITY SCHEDULE (AS OF FEBRUARY 13, 2023) Construction Multifamily Secured Unused Revolver Capacity 1. This is inclusive of the Port Imperial Hotels sale and a 9-month cap that was placed on 145 Front Street, both occurred subsequent to quarter end. 2023 2024 2025 2026 2027 2028 2029 2030 2031 $59 $297 $308 $250 $485 $316 $292 $72 |
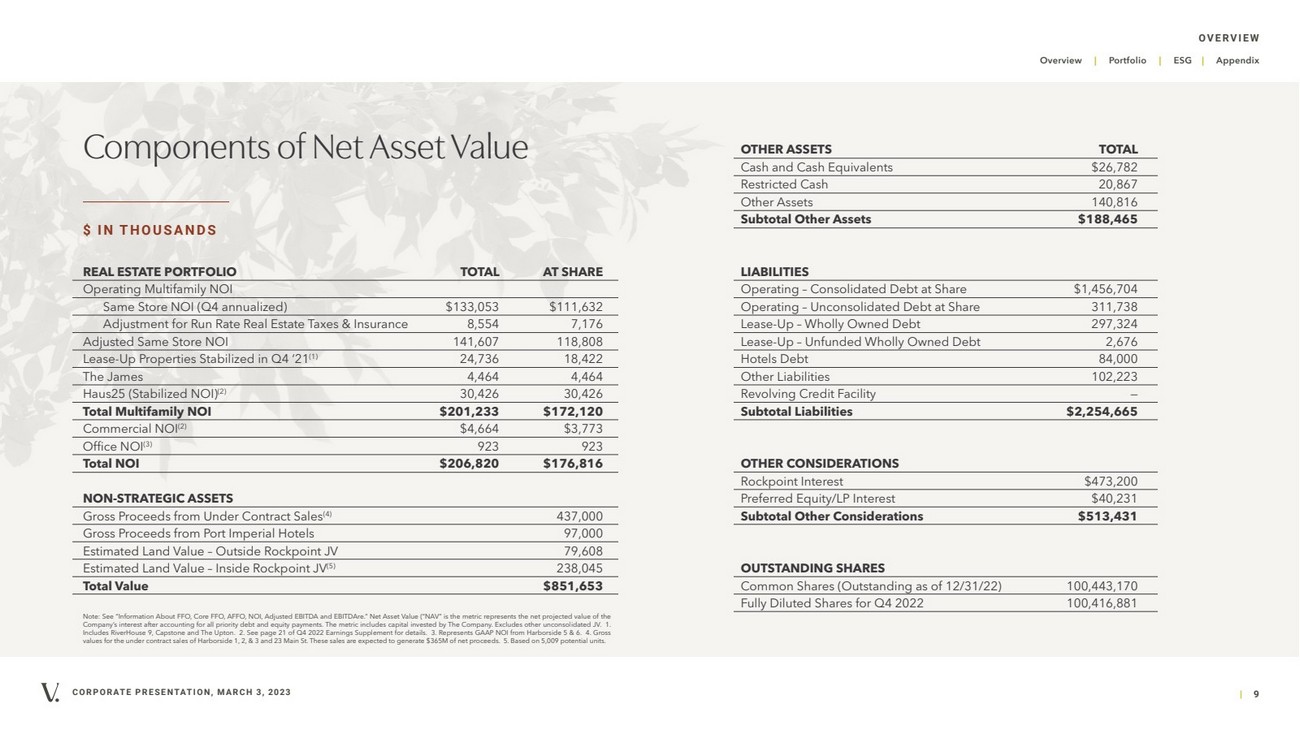
| | 9 Overview | Portfolio | ESG | Appendix CORPORATE PRESENTATION, MARCH 3, 2023 OVERVIEW Components of Net Asset Value REAL ESTATE PORTFOLIO TOTAL AT SHARE Operating Multifamily NOI Same Store NOI (Q4 annualized) $133,053 $111,632 Adjustment for Run Rate Real Estate Taxes & Insurance 8,554 7,176 Adjusted Same Store NOI 141,607 118,808 Lease-Up Properties Stabilized in Q4 ‘21(1) 24,736 18,422 The James 4,464 4,464 Haus25 (Stabilized NOI)(2) 30,426 30,426 Total Multifamily NOI $201,233 $172,120 Commercial NOI(2) $4,664 $3,773 Office NOI(3) 923 923 Total NOI $206,820 $176,816 NON-STRATEGIC ASSETS Gross Proceeds from Under Contract Sales(4) 437,000 Gross Proceeds from Port Imperial Hotels 97,000 Estimated Land Value – Outside Rockpoint JV 79,608 Estimated Land Value – Inside Rockpoint JV(5) 238,045 Total Value $851,653 OTHER ASSETS TOTAL Cash and Cash Equivalents $26,782 Restricted Cash 20,867 Other Assets 140,816 Subtotal Other Assets $188,465 LIABILITIES Operating – Consolidated Debt at Share $1,456,704 Operating – Unconsolidated Debt at Share 311,738 Lease-Up – Wholly Owned Debt 297,324 Lease-Up – Unfunded Wholly Owned Debt 2,676 Hotels Debt 84,000 Other Liabilities 102,223 Revolving Credit Facility — Subtotal Liabilities $2,254,665 OTHER CONSIDERATIONS Rockpoint Interest $473,200 Preferred Equity/LP Interest $40,231 Subtotal Other Considerations $513,431 OUTSTANDING SHARES Common Shares (Outstanding as of 12/31/22) 100,443,170 Fully Diluted Shares for Q4 2022 100,416,881 $ IN THOUSANDS Note: See “Information About FFO, Core FFO, AFFO, NOI, Adjusted EBITDA and EBITDAre.” Net Asset Value (“NAV” is the metric represents the net projected value of the Company’s interest after accounting for all priority debt and equity payments. The metric includes capital invested by The Company. Excludes other unconsolidated JV. 1. Includes RiverHouse 9, Capstone and The Upton. 2. See page 21 of Q4 2022 Earnings Supplement for details. 3. Represents GAAP NOI from Harborside 5 & 6. 4. Gross values for the under contract sales of Harborside 1, 2, & 3 and 23 Main St. These sales are expected to generate $365M of net proceeds. 5. Based on 5,009 potential units. |
| CORPORATE PRESENTATION, MARCH 3, 2023 | 10 Overview | Portfolio | ESG | Appendix PORTFOLIO Portfolio WHERE PROGRESS COMES TO LIFE RiverHouse 11, Port Imperial, Weehawken, NJ |

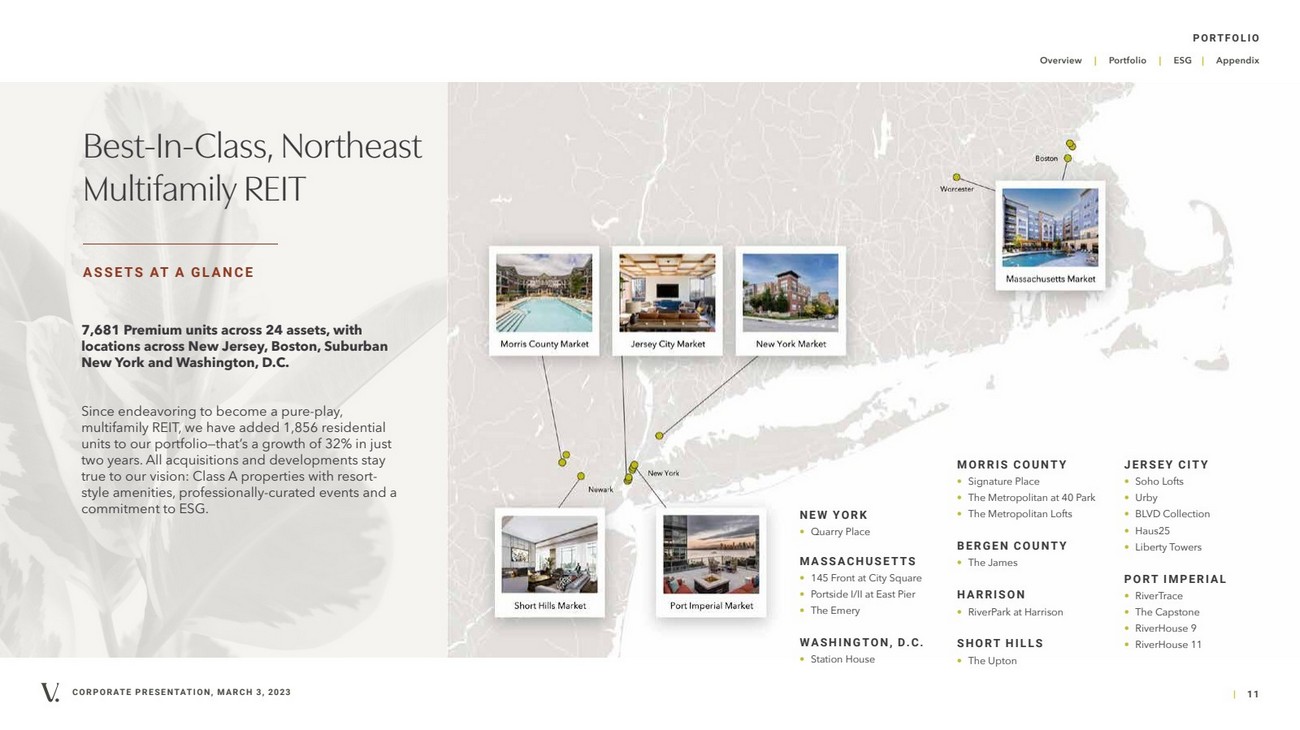
| | 11 Overview | Portfolio | ESG | Appendix CORPORATE PRESENTATION, MARCH 3, 2023 Best-In-Class, Northeast Multifamily REIT ASSETS AT A GLANCE MORRIS COUNTY • Signature Place • The Metropolitan at 40 Park • The Metropolitan Lofts BERGEN COUNTY • The James HARRISON • RiverPark at Harrison SHORT HILLS • The Upton JERSEY CITY • Soho Lofts • Urby • BLVD Collection • Haus25 • Liberty Towers PORT IMPERIAL • RiverTrace • The Capstone • RiverHouse 9 • RiverHouse 11 NEW YORK • Quarry Place MASSACHUSETTS • 145 Front at City Square • Portside I/II at East Pier • The Emery WASHINGTON, D.C. • Station House 7,681 Premium units across 24 assets, with locations across New Jersey, Boston, Suburban New York and Washington, D.C. Since endeavoring to become a pure-play, multifamily REIT, we have added 1,856 residential units to our portfolio—that’s a growth of 32% in just two years. All acquisitions and developments stay true to our vision: Class A properties with resort-style amenities, professionally-curated events and a commitment to ESG. PORTFOLIO |
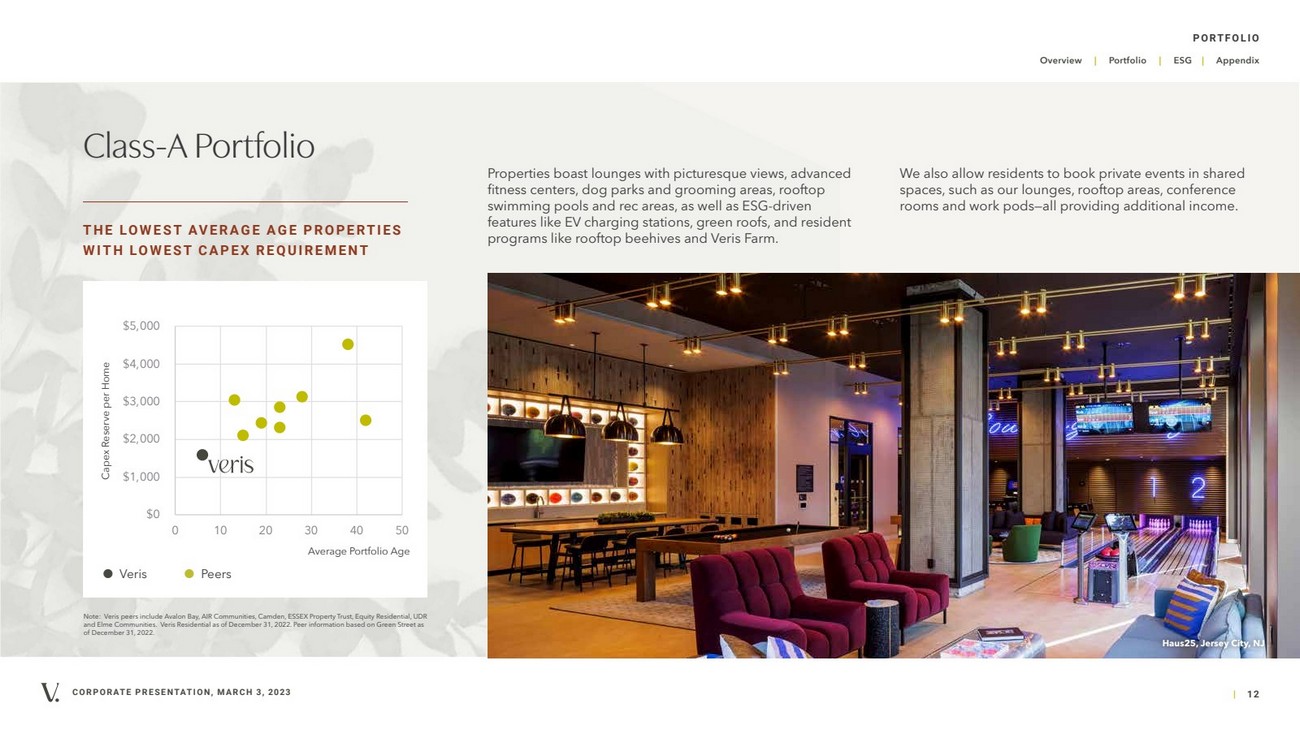
| | 12 Overview | Portfolio | ESG | Appendix CORPORATE PRESENTATION, MARCH 3, 2023 Class-A Portfolio Properties boast lounges with picturesque views, advanced fitness centers, dog parks and grooming areas, rooftop swimming pools and rec areas, as well as ESG-driven features like EV charging stations, green roofs, and resident programs like rooftop beehives and Veris Farm. Veris Peers Note: Veris peers include Avalon Bay, AIR Communities, Camden, ESSEX Property Trust, Equity Residential, UDR and Elme Communities. Veris Residential as of December 31, 2022. Peer information based on Green Street as of December 31, 2022. T H E LO W E S T AV E R A G E A G E P R O P E RT I E S WITH LOWEST CAPEX REQUIREMENT Haus25, Jersey City, NJ We also allow residents to book private events in shared spaces, such as our lounges, rooftop areas, conference rooms and work pods—all providing additional income. PORTFOLIO $0 $1,000 $2,000 $3,000 $4,000 $5,000 0 10 20 30 40 50 Capex Reserve per Home Average Portfolio Age |
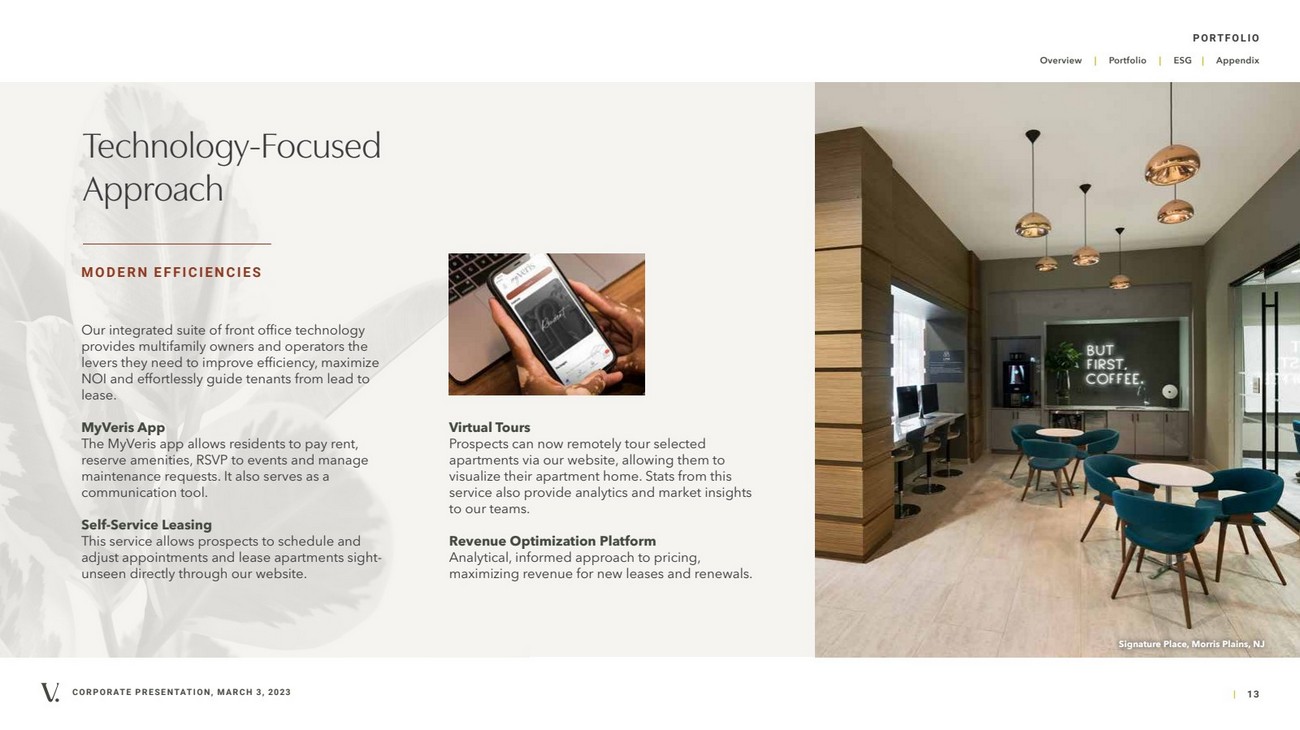
| | 13 Overview | Portfolio | ESG | Appendix CORPORATE PRESENTATION, MARCH 3, 2023 Our integrated suite of front office technology provides multifamily owners and operators the levers they need to improve efficiency, maximize NOI and effortlessly guide tenants from lead to lease. MyVeris App The MyVeris app allows residents to pay rent, reserve amenities, RSVP to events and manage maintenance requests. It also serves as a communication tool. Self-Service Leasing This service allows prospects to schedule and adjust appointments and lease apartments sight-unseen directly through our website. Technology-Focused Approach M O D E R N E F F I C I E N C I E S Virtual Tours Prospects can now remotely tour selected apartments via our website, allowing them to visualize their apartment home. Stats from this service also provide analytics and market insights to our teams. Revenue Optimization Platform Analytical, informed approach to pricing, maximizing revenue for new leases and renewals. Signature Place, Morris Plains, NJ PORTFOLIO |
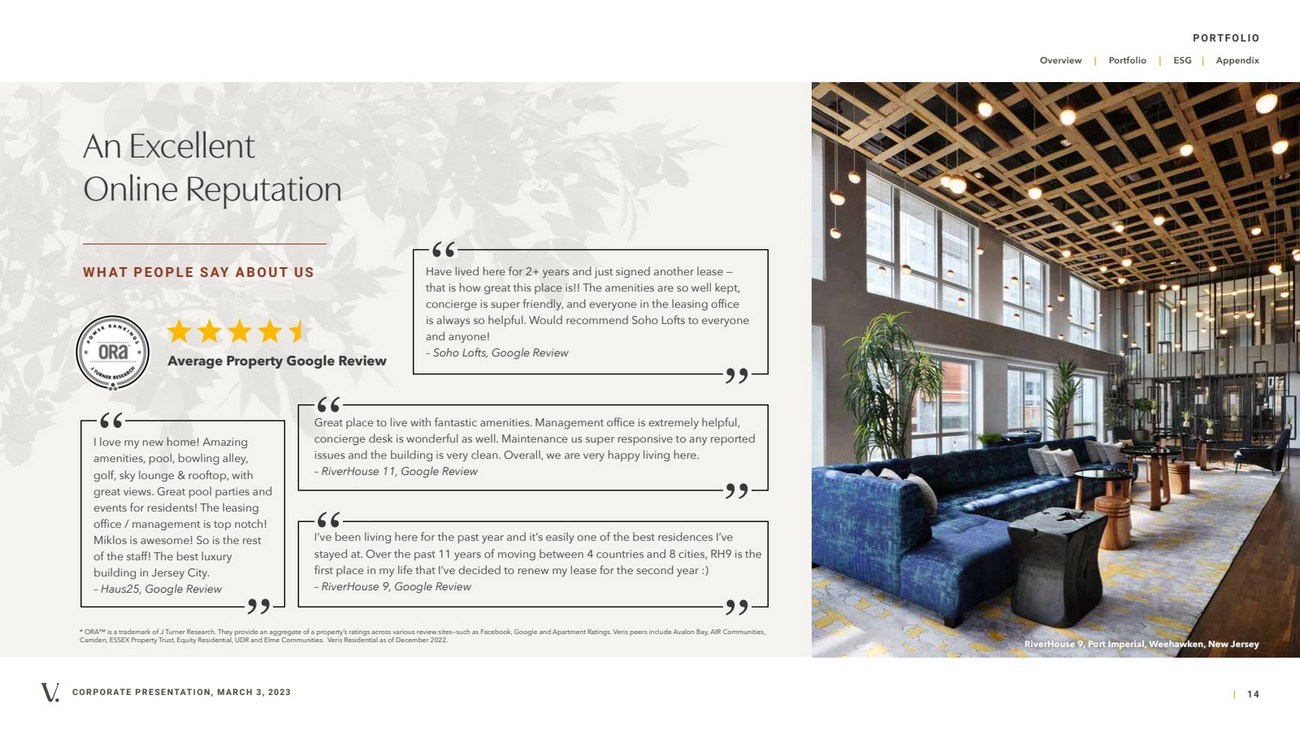
| | 14 Overview | Portfolio | ESG | Appendix CORPORATE PRESENTATION, MARCH 3, 2023 An Excellent Online Reputation WHAT PEOPLE SAY ABOUT US * ORA™ is a trademark of J Turner Research. They provide an aggregate of a property’s ratings across various review sites—such as Facebook, Google and Apartment Ratings. Veris peers include Avalon Bay, AIR Communities, Camden, ESSEX Property Trust, Equity Residential, UDR and Elme Communities. Veris Residential as of December 2022. RiverHouse 9, Port Imperial, Weehawken, New Jersey Average Property Google Review I love my new home! Amazing amenities, pool, bowling alley, golf, sky lounge & rooftop, with great views. Great pool parties and events for residents! The leasing office / management is top notch! Miklos is awesome! So is the rest of the staff! The best luxury building in Jersey City. – Haus25, Google Review “ “ Great place to live with fantastic amenities. Management office is extremely helpful, concierge desk is wonderful as well. Maintenance us super responsive to any reported issues and the building is very clean. Overall, we are very happy living here. – RiverHouse 11, Google Review “ “ I’ve been living here for the past year and it’s easily one of the best residences I’ve stayed at. Over the past 11 years of moving between 4 countries and 8 cities, RH9 is the first place in my life that I’ve decided to renew my lease for the second year :) – RiverHouse 9, Google Review “ “ PORTFOLIO Have lived here for 2+ years and just signed another lease — that is how great this place is!! The amenities are so well kept, concierge is super friendly, and everyone in the leasing office is always so helpful. Would recommend Soho Lofts to everyone and anyone! – Soho Lofts, Google Review “ “ |
| CORPORATE PRESENTATION, MARCH 3, 2023 | 15 Overview | Portfolio | ESG | Appendix Haus25, Jersey City, New Jersey PORTFOLIO Commitment to ESG P R O P E RT I E S , P E O P L E , P L A N E T. ESG |

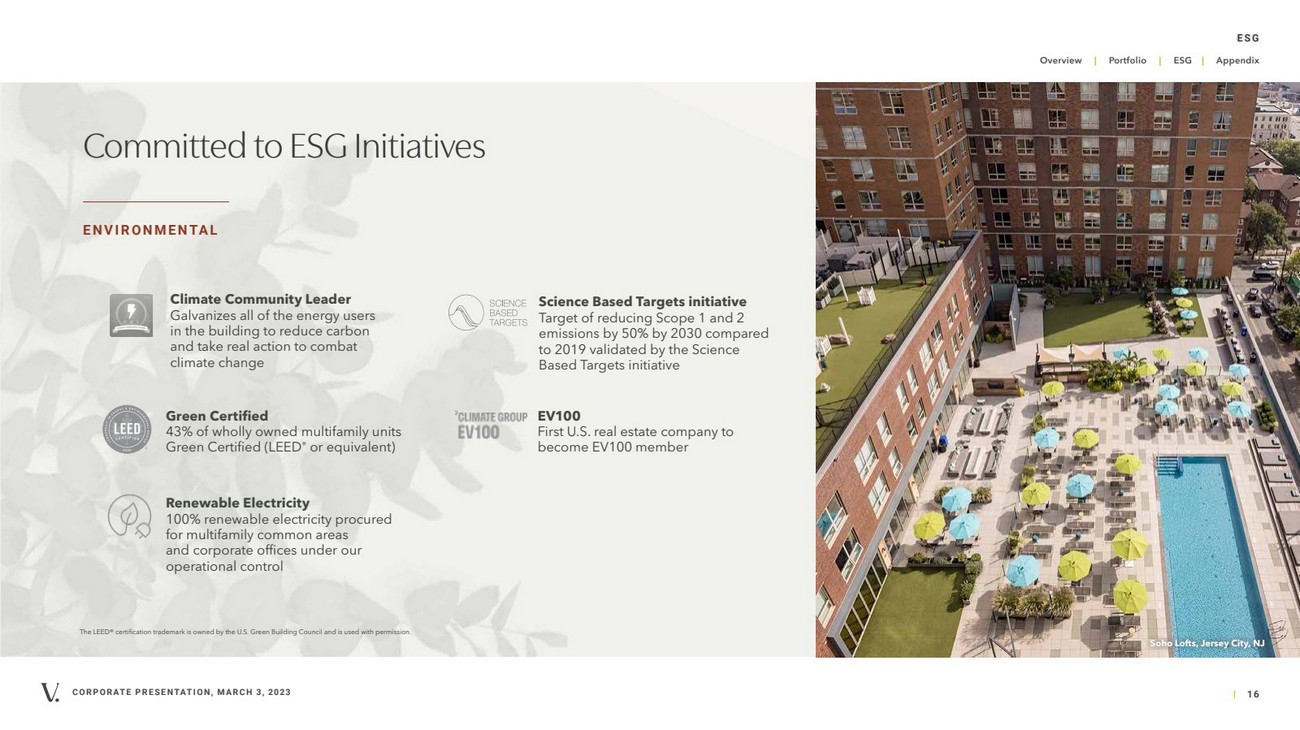
| | 16 Overview | Portfolio | ESG | Appendix CORPORATE PRESENTATION, MARCH 3, 2023 Committed to ESG Initiatives ENVIRONMENTAL The LEED® certification trademark is owned by the U.S. Green Building Council and is used with permission. Green Certified 43% of wholly owned multifamily units Green Certified (LEED® or equivalent) Climate Community Leader Galvanizes all of the energy users in the building to reduce carbon and take real action to combat climate change Renewable Electricity 100% renewable electricity procured for multifamily common areas and corporate offices under our operational control EV100 First U.S. real estate company to become EV100 member Soho Lofts, Jersey City, NJ Science Based Targets initiative Target of reducing Scope 1 and 2 emissions by 50% by 2030 compared to 2019 validated by the Science Based Targets initiative ESG |
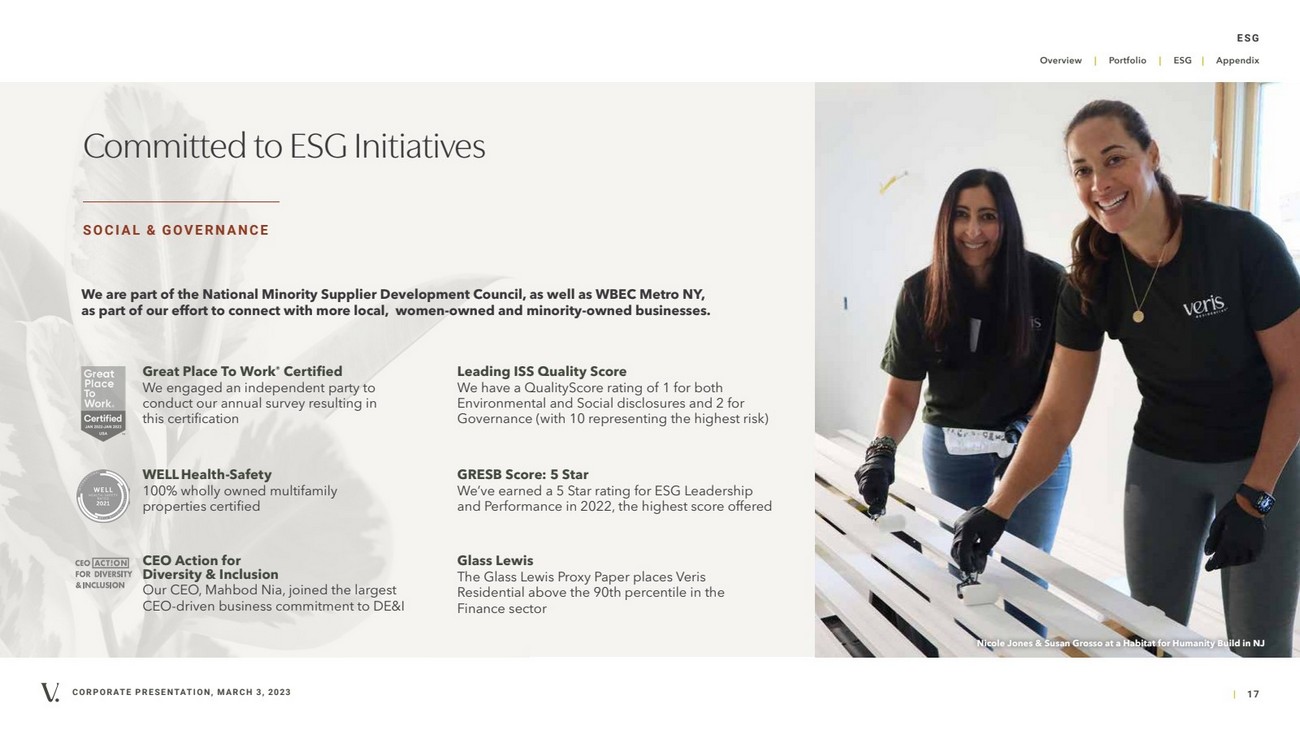
| | 17 Overview | Portfolio | ESG | Appendix CORPORATE PRESENTATION, MARCH 3, 2023 Committed to ESG Initiatives SOCIAL & GOVERNANCE Nicole Jones & Susan Grosso at a Habitat for Humanity Build in NJ Great Place To Work® Certified We engaged an independent party to conduct our annual survey resulting in this certification WELLHealth-Safety 100% wholly owned multifamily properties certified CEO Action for Diversity & Inclusion Our CEO, Mahbod Nia, joined the largest CEO-driven business commitment to DE&I We are part of the National Minority Supplier Development Council, as well as WBEC Metro NY, as part of our effort to connect with more local, women-owned and minority-owned businesses. Leading ISS Quality Score We have a QualityScore rating of 1 for both Environmental and Social disclosures and 2 for Governance (with 10 representing the highest risk) Glass Lewis The Glass Lewis Proxy Paper places Veris Residential above the 90th percentile in the Finance sector GRESB Score: 5 Star We’ve earned a 5 Star rating for ESG Leadership and Performance in 2022, the highest score offered ESG |
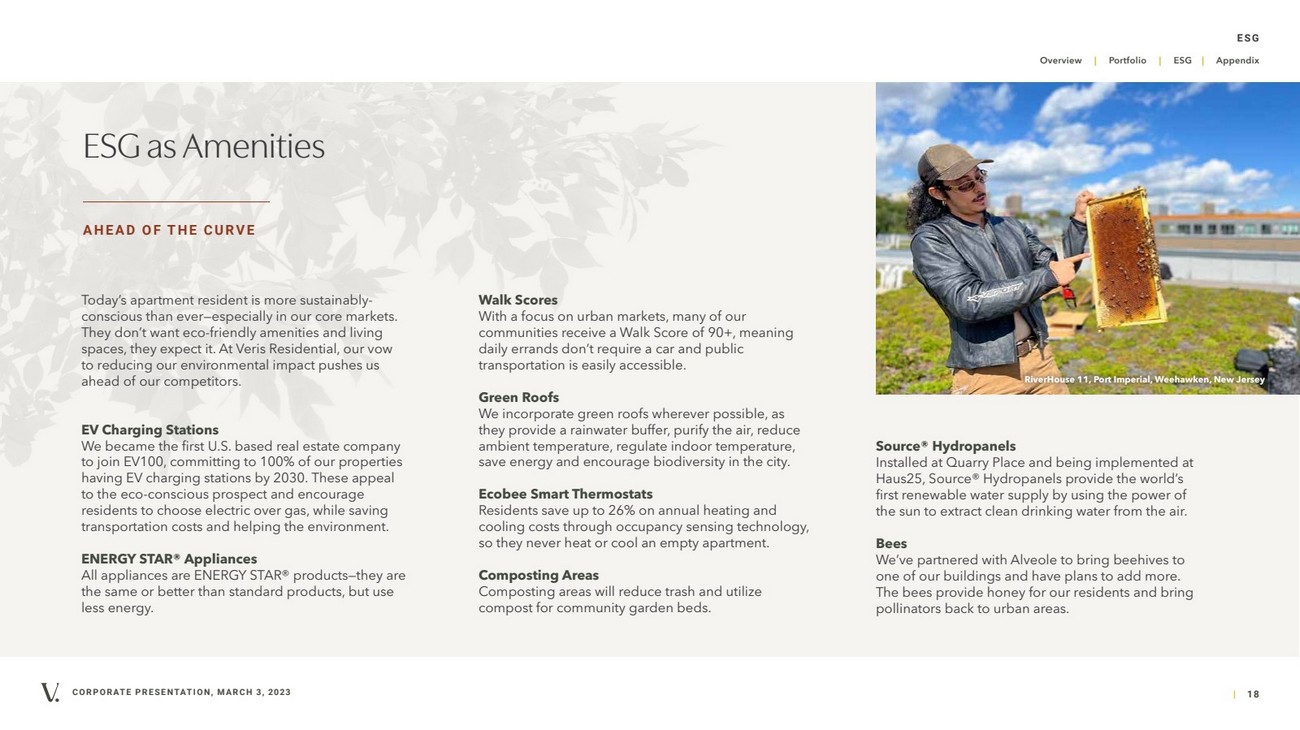
| | 18 Overview | Portfolio | ESG | Appendix CORPORATE PRESENTATION, MARCH 3, 2023 ESG as Amenities AHEAD OF THE CURVE Today’s apartment resident is more sustainably-conscious than ever—especially in our core markets. They don’t want eco-friendly amenities and living spaces, they expect it. At Veris Residential, our vow to reducing our environmental impact pushes us ahead of our competitors. EV Charging Stations We became the first U.S. based real estate company to join EV100, committing to 100% of our properties having EV charging stations by 2030. These appeal to the eco-conscious prospect and encourage residents to choose electric over gas, while saving transportation costs and helping the environment. ENERGY STAR® Appliances All appliances are ENERGY STAR® products—they are the same or better than standard products, but use less energy. Walk Scores With a focus on urban markets, many of our communities receive a Walk Score of 90+, meaning daily errands don’t require a car and public transportation is easily accessible. Green Roofs We incorporate green roofs wherever possible, as they provide a rainwater buffer, purify the air, reduce ambient temperature, regulate indoor temperature, save energy and encourage biodiversity in the city. Ecobee Smart Thermostats Residents save up to 26% on annual heating and cooling costs through occupancy sensing technology, so they never heat or cool an empty apartment. Composting Areas Composting areas will reduce trash and utilize compost for community garden beds. Source® Hydropanels Installed at Quarry Place and being implemented at Haus25, Source® Hydropanels provide the world’s first renewable water supply by using the power of the sun to extract clean drinking water from the air. Bees We’ve partnered with Alveole to bring beehives to one of our buildings and have plans to add more. The bees provide honey for our residents and bring pollinators back to urban areas. RiverHouse 11, Port Imperial, Weehawken, New Jersey ESG |
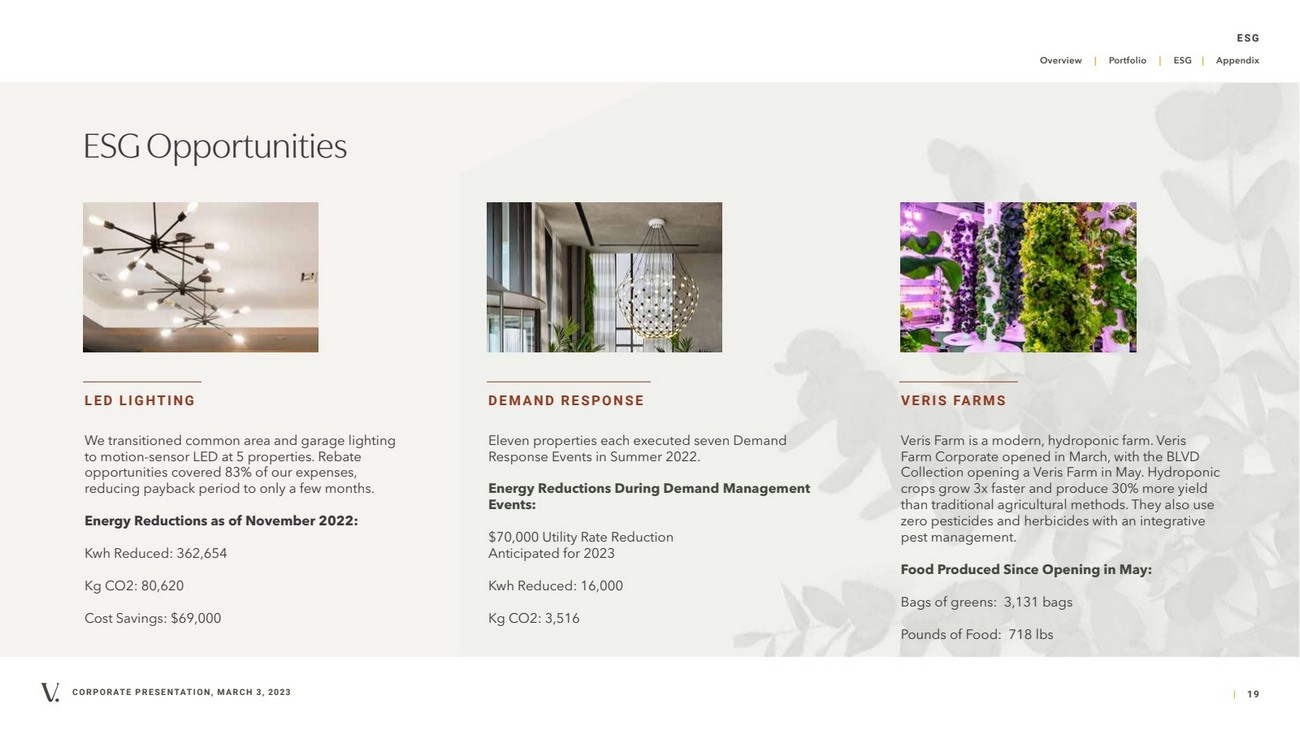
| | 19 Overview | Portfolio | ESG | Appendix CORPORATE PRESENTATION, MARCH 3, 2023 ESG ESG Opportunities LED LIGHTING We transitioned common area and garage lighting to motion-sensor LED at 5 properties. Rebate opportunities covered 83% of our expenses, reducing payback period to only a few months. Energy Reductions as of November 2022: Kwh Reduced: 362,654 Kg CO2: 80,620 Cost Savings: $69,000 DEMAND RESPONSE Eleven properties each executed seven Demand Response Events in Summer 2022. Energy Reductions During Demand Management Events: $70,000 Utility Rate Reduction Anticipated for 2023 Kwh Reduced: 16,000 Kg CO2: 3,516 VERIS FARMS Veris Farm is a modern, hydroponic farm. Veris Farm Corporate opened in March, with the BLVD Collection opening a Veris Farm in May. Hydroponic crops grow 3x faster and produce 30% more yield than traditional agricultural methods. They also use zero pesticides and herbicides with an integrative pest management. Food Produced Since Opening in May: Bags of greens: 3,131 bags Pounds of Food: 718 lbs |
| CORPORATE PRESENTATION, MARCH 3, 2023 | 20 Overview | Portfolio | ESG | Appendix Portside at East Pier, East Boston, MA APPENDIX ADDITIONAL CONTENT & DEFINITIONS Appendix |

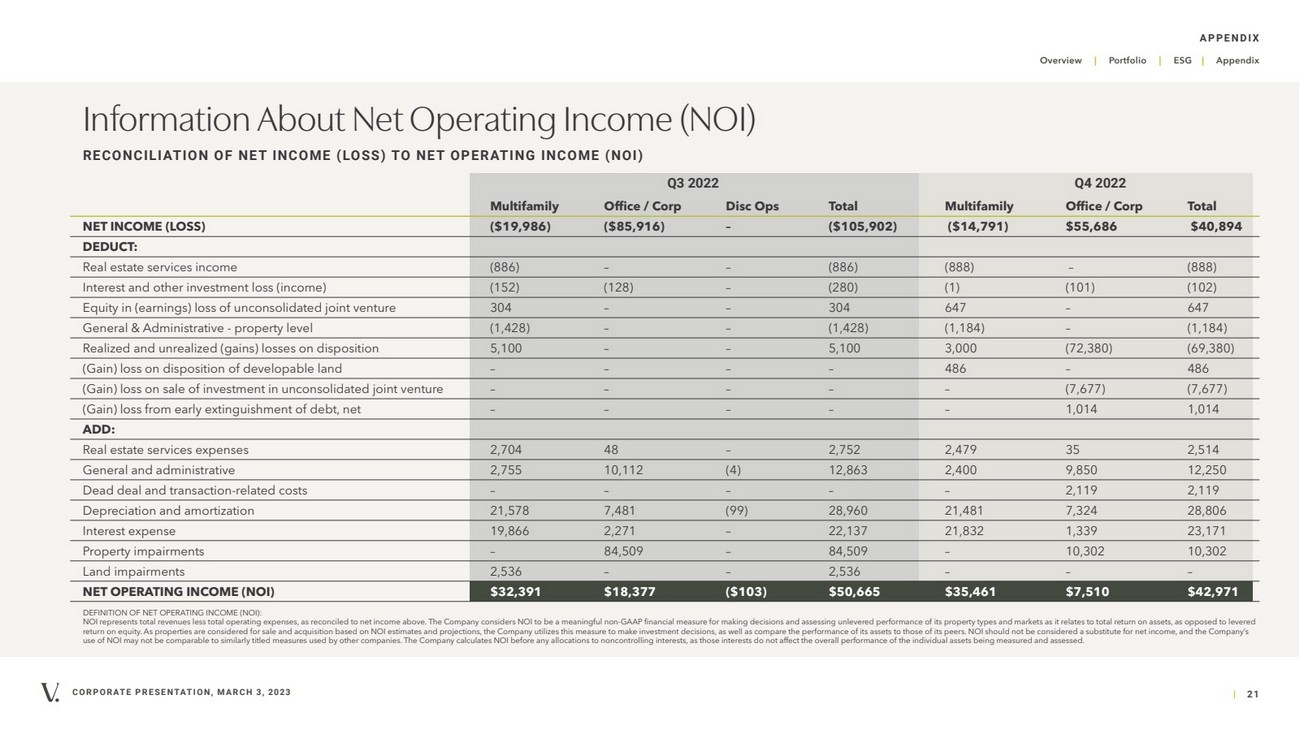
| CORPORATE PRESENTATION, MARCH 3, 2023 | 21 Overview | Portfolio | ESG | Appendix Multifamily Office / Corp Disc Ops Total Multifamily Office / Corp Total NET INCOME (LOSS) ($19,986) ($85,916) – ($105,902) ($14,791) $55,686 $40,894 DEDUCT: Real estate services income (886) – – (886) (888) – (888) Interest and other investment loss (income) (152) (128) – (280) (1) (101) (102) Equity in (earnings) loss of unconsolidated joint venture 304 – – 304 647 – 647 General & Administrative - property level (1,428) – – (1,428) (1,184) – (1,184) Realized and unrealized (gains) losses on disposition 5,100 – – 5,100 3,000 (72,380) (69,380) (Gain) loss on disposition of developable land – – – – 486 – 486 (Gain) loss on sale of investment in unconsolidated joint venture – – – – – (7,677) (7,677) (Gain) loss from early extinguishment of debt, net – – – – – 1,014 1,014 ADD: Real estate services expenses 2,704 48 – 2,752 2,479 35 2,514 General and administrative 2,755 10,112 (4) 12,863 2,400 9,850 12,250 Dead deal and transaction-related costs – – – – – 2,119 2,119 Depreciation and amortization 21,578 7,481 (99) 28,960 21,481 7,324 28,806 Interest expense 19,866 2,271 – 22,137 21,832 1,339 23,171 Property impairments – 84,509 – 84,509 – 10,302 10,302 Land impairments 2,536 – – 2,536 – – – NET OPERATING INCOME (NOI) $32,391 $18,377 ($103) $50,665 $35,461 $7,510 $42,971 DEFINITION OF NET OPERATING INCOME (NOI): NOI represents total revenues less total operating expenses, as reconciled to net income above. The Company considers NOI to be a meaningful non-GAAP financial measure for making decisions and assessing unlevered performance of its property types and markets as it relates to total return on assets, as opposed to levered return on equity. As properties are considered for sale and acquisition based on NOI estimates and projections, the Company utilizes this measure to make investment decisions, as well as compare the performance of its assets to those of its peers. NOI should not be considered a substitute for net income, and the Company’s use of NOI may not be comparable to similarly titled measures used by other companies. The Company calculates NOI before any allocations to noncontrolling interests, as those interests do not affect the overall performance of the individual assets being measured and assessed. Information About Net Operating Income (NOI) RECONCILIATION OF NET INCOME (LOSS) TO NET OPERATING INCOME (NOI) Q3 2022 Q4 2022 APPENDIX |
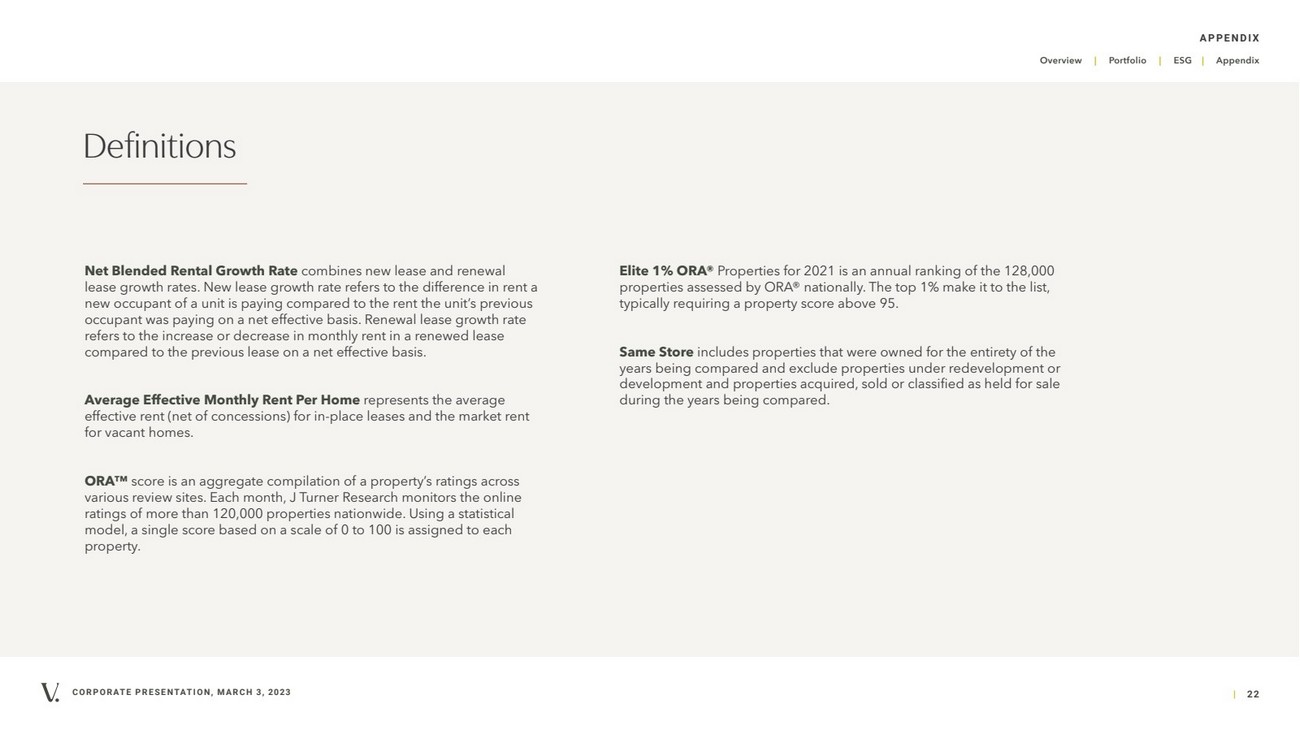
| CORPORATE PRESENTATION, MARCH 3, 2023 | 22 Overview | Portfolio | ESG | Appendix Definitions Net Blended Rental Growth Rate combines new lease and renewal lease growth rates. New lease growth rate refers to the difference in rent a new occupant of a unit is paying compared to the rent the unit’s previous occupant was paying on a net effective basis. Renewal lease growth rate refers to the increase or decrease in monthly rent in a renewed lease compared to the previous lease on a net effective basis. Average Effective Monthly Rent Per Home represents the average effective rent (net of concessions) for in-place leases and the market rent for vacant homes. ORA™ score is an aggregate compilation of a property’s ratings across various review sites. Each month, J Turner Research monitors the online ratings of more than 120,000 properties nationwide. Using a statistical model, a single score based on a scale of 0 to 100 is assigned to each property. Elite 1% ORA® Properties for 2021 is an annual ranking of the 128,000 properties assessed by ORA® nationally. The top 1% make it to the list, typically requiring a property score above 95. Same Store includes properties that were owned for the entirety of the years being compared and exclude properties under redevelopment or development and properties acquired, sold or classified as held for sale during the years being compared. APPENDIX |
| THIS PRESENTATION HAS BEEN FORMATTED FOR SCREENS. PLEASE CONSIDER THE ENVIRONMENT BEFORE PRINTING. Thank You |