| Corporate Presentation 1 SEPTEMBER 2022 |
| This Operating and Financial Data should be read in connection with our Annual Report on Form 10-K for the year ended December 31, 2021 and our Quarterly Report on Form 10-Q for the quarter ended June 30, 2022. Statements made in this presentation may be forward-looking statements within the meaning of Section 21E of the Securities Exchange Act of 1934, as amended. Such forward-looking statements are intended to be covered by the safe harbor provisions for forward-looking statements contained in Section 21E of such act. Such forward- looking statements relate to, without limitation, our future economic performance, plans and objectives for future operations and projections of revenue and other financial items. Forward-looking statements can be identified by the use of words such as “may,” “will,” “plan,” “potential,” “projected,” “should,” “expect,” “anticipate,” “estimate,” “target,” “continue” or comparable terminology. Forward-looking statements are inherently subject to certain risks, trends and uncertainties, many of which we cannot predict with accuracy and some of which we might not even anticipate. Although we believe that the expectations reflected in such forward-looking statements are based upon reasonable assumptions at the time made, we can give no assurance that such expectations will be achieved. Future events and actual results, financial and otherwise, may differ materially from the results discussed in the forward-looking statements. Readers are cautioned not to place undue reliance on these forward-looking statements and are advised to consider the factors listed above together with the additional factors under the heading “Disclosure Regarding Forward-Looking Statements” and “Risk Factors” in our annual reports on Form 10-K, as may be supplemented or amended by our quarterly reports on Form 10-Q, which are incorporated herein by reference. We assume no obligation to update or supplement forward-looking statements that become untrue because of subsequent events, new information or otherwise. Corporate Presentation 2 |
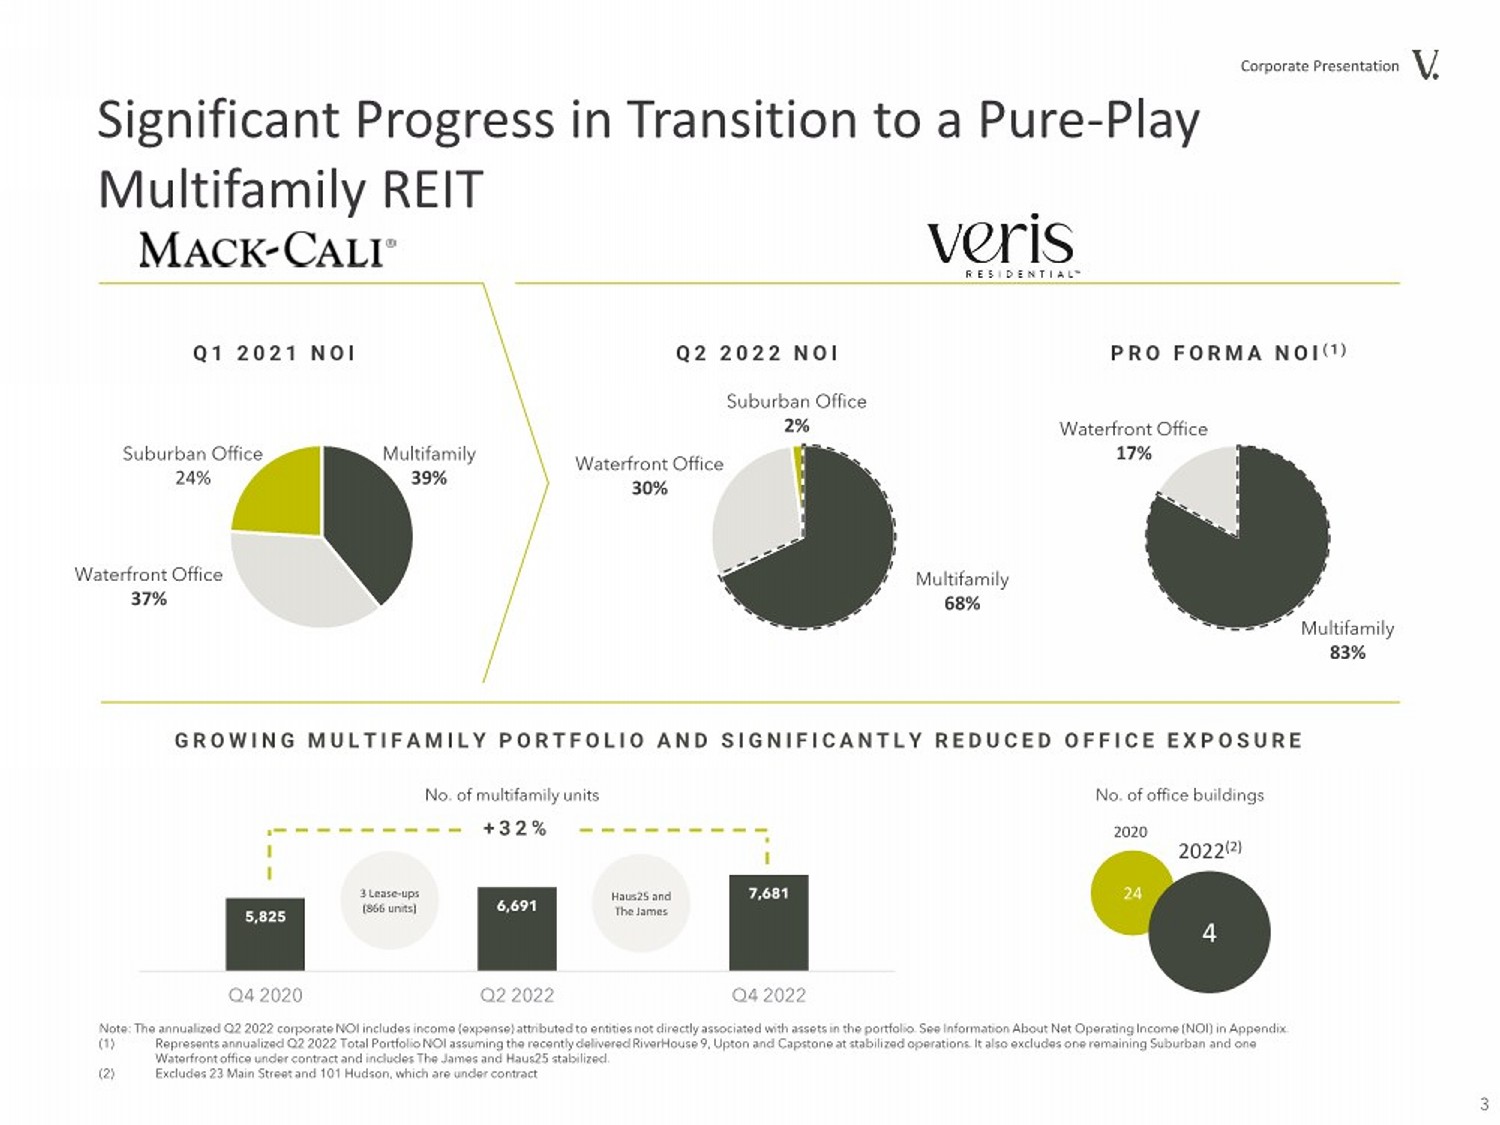
| Significant Progress in Transition to a Pure-Play Multifamily REIT Multifamily 39% Waterfront Office 37% Suburban Office 24% Q1 2021 NOI Q2 2022 NOI PRO FORMA NOI ( 1 ) Waterfront Office 30% Multifamily 68% Suburban Office 2% Waterfront Office 17% Multifamily 83% Corporate Presentation 24 4 2020 2022(2) Note: The annualized Q2 2022 corporate NOI includes income (expense) attributed to entities not directly associated with assets in the portfolio. See Information About Net Operating Income (NOI) in Appendix. (1) Represents annualized Q2 2022 Total Portfolio NOI assuming the recently delivered RiverHouse 9, Upton and Capstone at stabilized operations. It also excludes one remaining Suburban and one Waterfront office under contract and includes The James and Haus25 stabilized. (2) Excludes 23 Main Street and 101 Hudson, which are under contract GROWING MULTIFAMILY PORTFOLIO AND SIGNIFICANTLY REDUCED OFFICE EXPOSURE No. of office buildings 5,825 6,691 7,681 Q4 2020 Q2 2022 Q4 2022 No. of multifamily units + 3 2 % 3 Lease-ups (866 units) Haus25 and The James 3 |
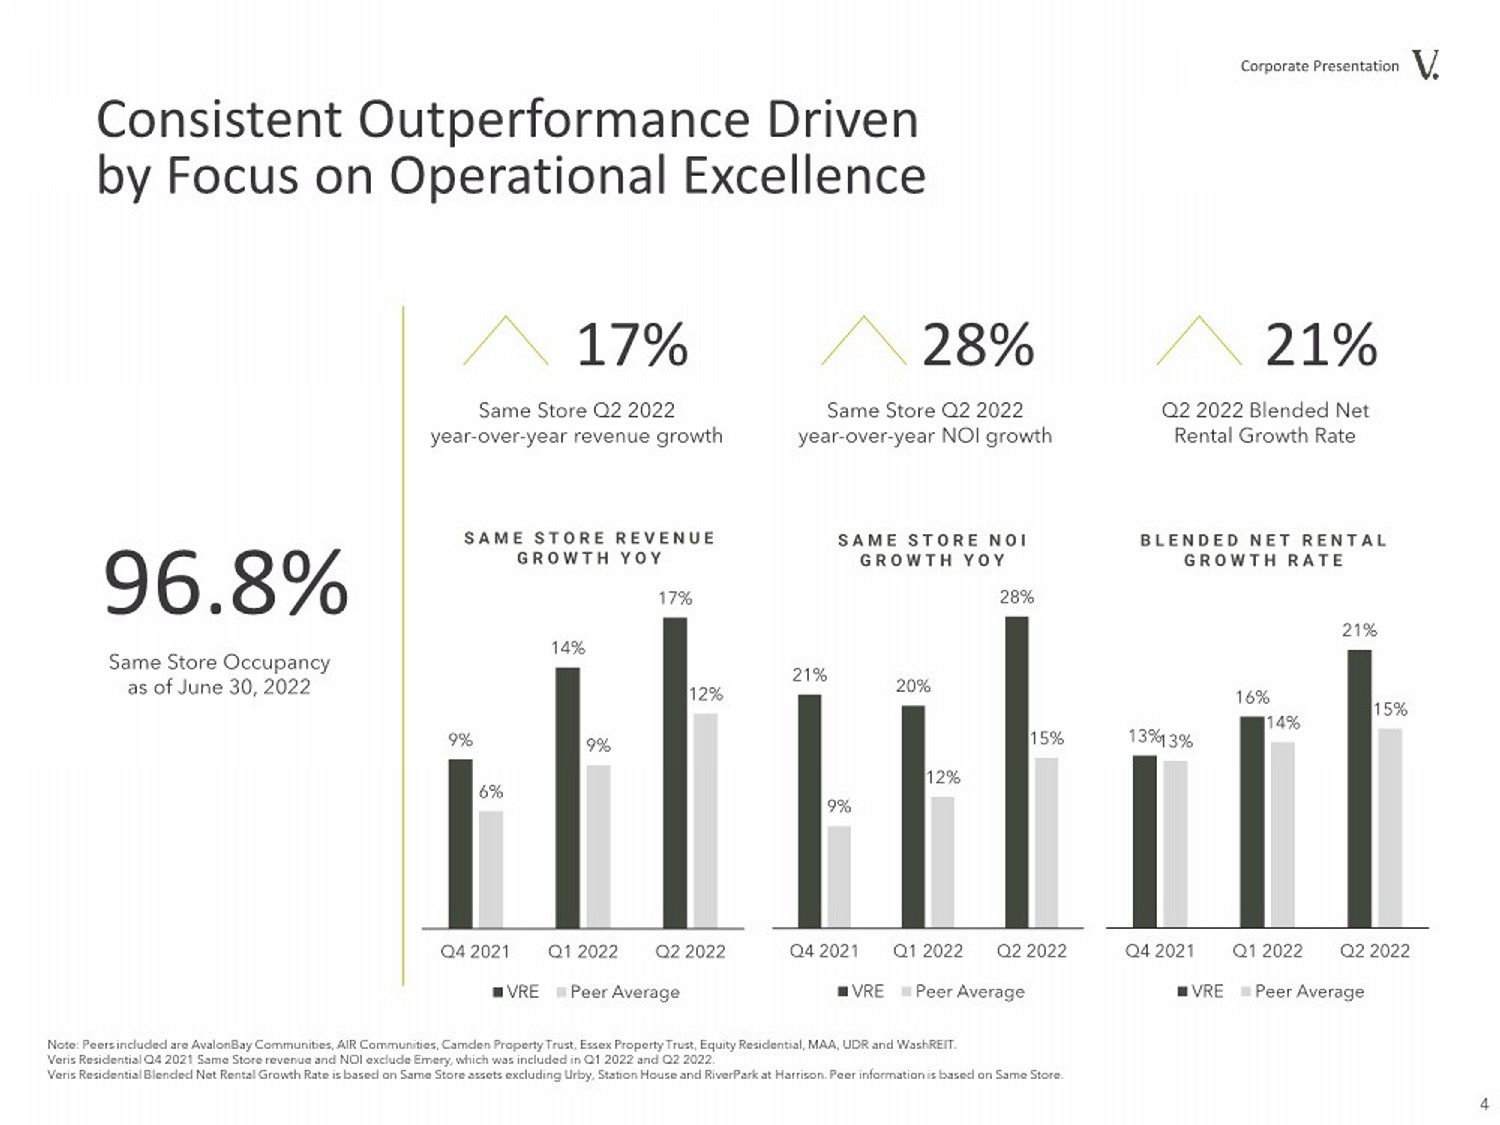
| Note: Peers included are AvalonBay Communities, AIR Communities, Camden Property Trust, Essex Property Trust, Equity Residential, MAA, UDR and WashREIT. Veris Residential Q4 2021 Same Store revenue and NOI exclude Emery, which was included in Q1 2022 and Q2 2022. Veris Residential Blended Net Rental Growth Rate is based on Same Store assets excluding Urby, Station House and RiverPark at Harrison. Peer information is based on Same Store. 4 Corporate Presentation Q2 2022 Blended Net Rental Growth Rate 17% Same Store Q2 2022 year-over-year revenue growth Same Store Q2 2022 year-over-year NOI growth 96.8% Same Store Occupancy as of June 30, 2022 Consistent Outperformance Driven by Focus on Operational Excellence SAME STORE REVENUE G R O W T H Y O Y SAME STORE NOI G R O W T H Y O Y BLENDED NET RENTAL GROWTH RATE 28% 21% 9% 14% 17% 6% 9% 12% Q4 2021 Q1 2022 Q2 2022 VRE Peer Average 21% 20% 28% 9% 12% 15% Q4 2021 Q1 2022 Q2 2022 VRE Peer Average 13% 16% 21% 13% 14% 15% Q4 2021 Q1 2022 Q2 2022 VRE Peer Average |
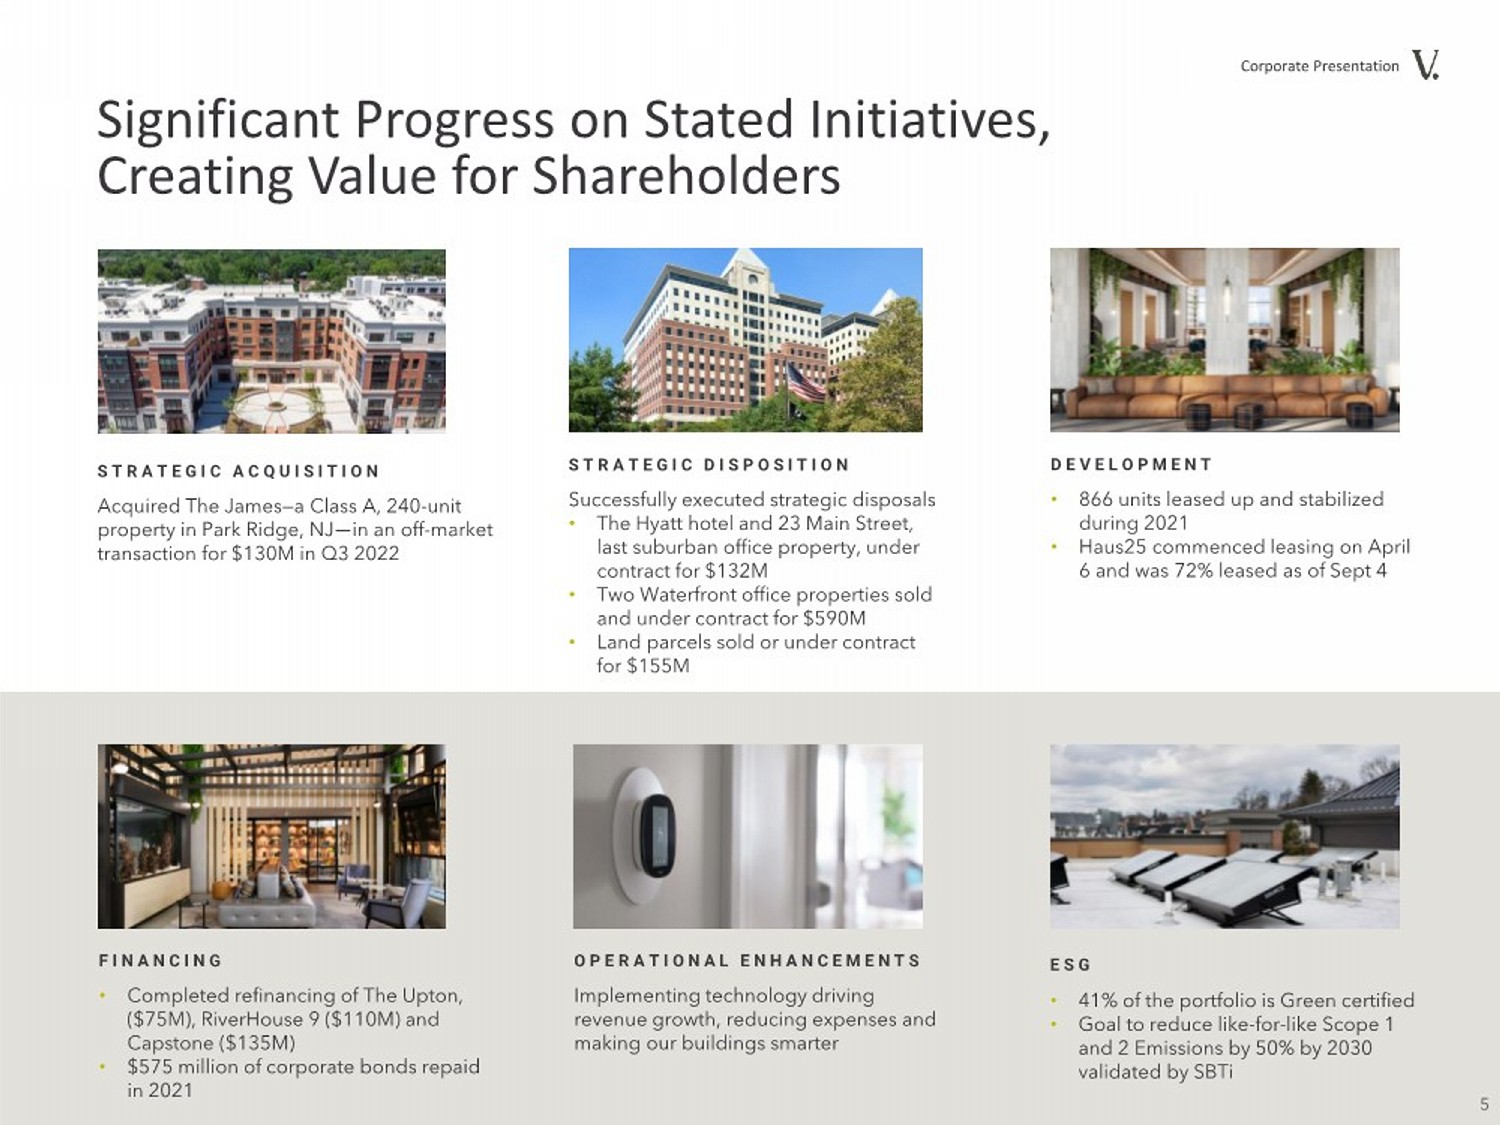
| Significant Progress on Stated Initiatives, Creating Value for Shareholders STRATEGIC ACQUISITION Acquired The James—a Class A, 240-unit property in Park Ridge, NJ—in an off-market transaction for $130M in Q3 2022 STRATEGIC DISPOSITION Successfully executed strategic disposals • The Hyatt hotel and 23 Main Street, last suburban office property, under contract for $132M • Two Waterfront office properties sold and under contract for $590M • Land parcels sold or under contract for $155M DEVELOPMENT • 866 units leased up and stabilized during 2021 • Haus25 commenced leasing on April 6 and was 72% leased as of Sept 4 FINANCING • Completed refinancing of The Upton, ($75M), RiverHouse 9 ($110M) and Capstone ($135M) • $575 million of corporate bonds repaid in 2021 OPERATIONAL ENHANCEMENTS Implementing technology driving revenue growth, reducing expenses and making our buildings smarter ESG • 41% of the portfolio is Green certified • Goal to reduce like-for-like Scope 1 and 2 Emissions by 50% by 2030 validated by SBTi Corporate Presentation 5 |
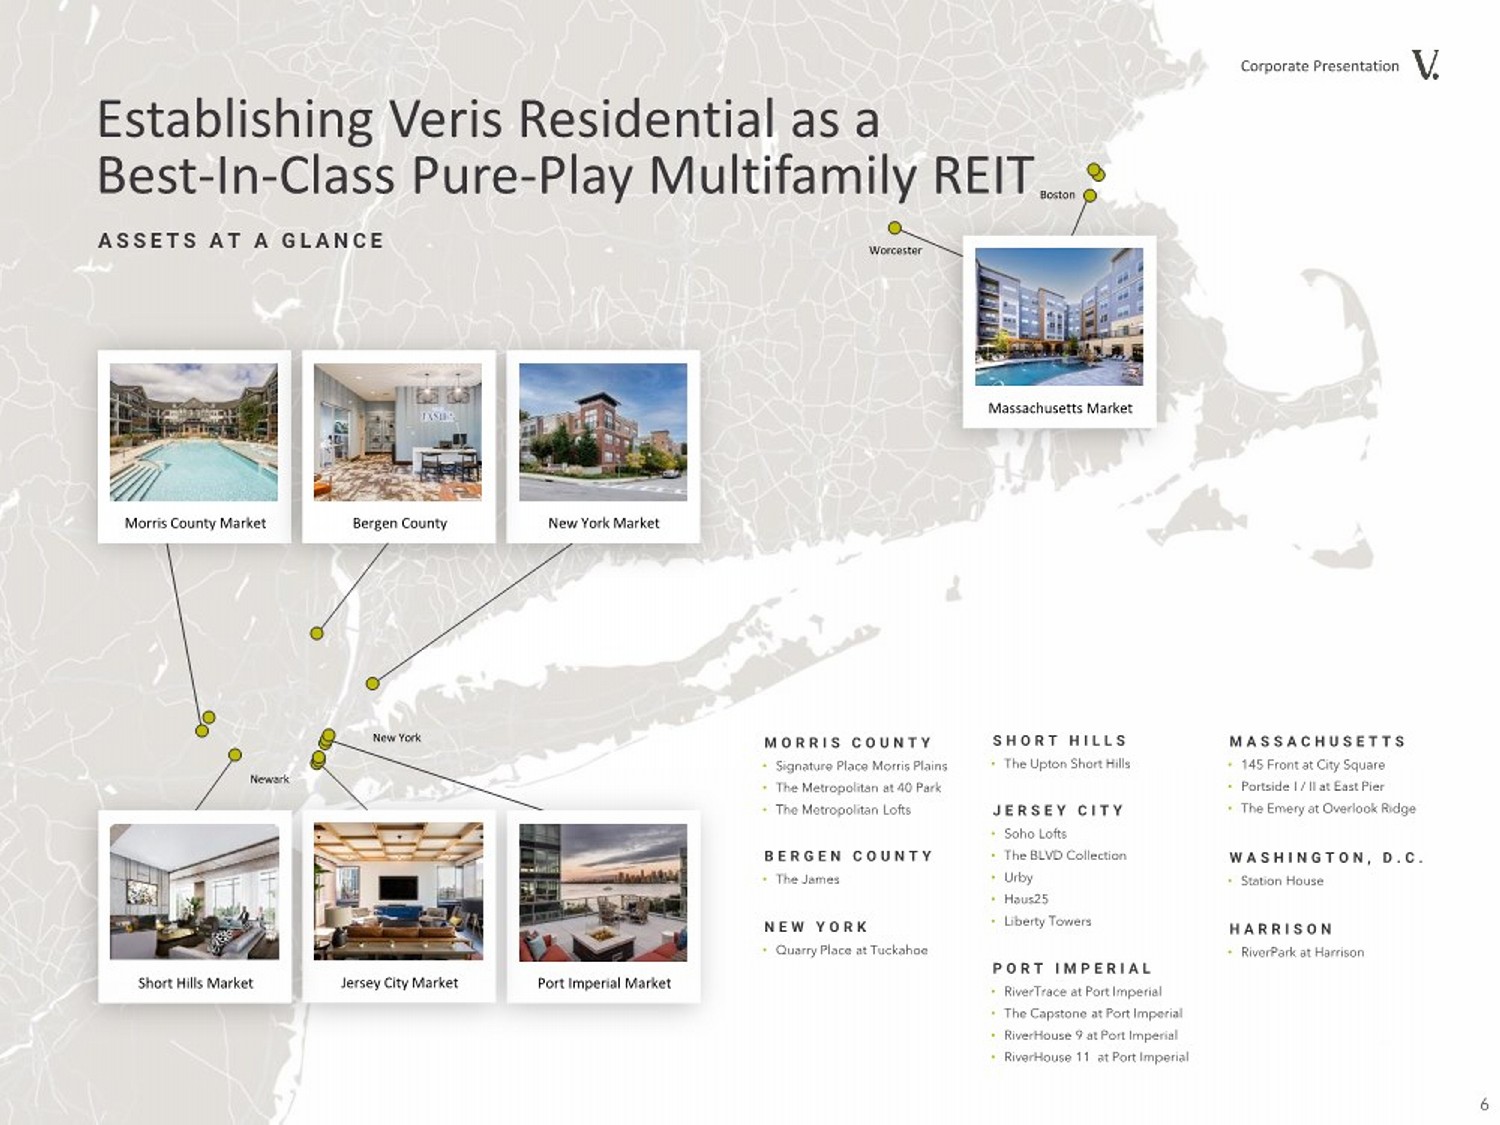
| Establishing Veris Residential as a Best-In-Class Pure-Play Multifamily REIT 6 MASSACHUSETTS • 145 Front at City Square • Portside I / II at East Pier • The Emery at Overlook Ridge MORRIS COUNTY • Signature Place Morris Plains • The Metropolitan at 40 Park • The Metropolitan Lofts SHORT HILLS • The Upton Short Hills JERSEY CITY • Soho Lofts • The BLVD Collection • Urby • Haus25 • Liberty Towers PORT IMPERIAL • RiverTrace at Port Imperial • The Capstone at Port Imperial • RiverHouse 9 at Port Imperial • RiverHouse 11 at Port Imperial N E W Y O R K • Quarry Place at Tuckahoe WASHINGTON, D.C. • Station House ASSETS AT A GLANCE Boston Worcester New York Newark Port Imperial Market Jersey City Market Morris County Market Short Hills Market HARRISON • RiverPark at Harrison Corporate Presentation Massachusetts Market New York Market Bergen County BERGEN COUNTY • The James |
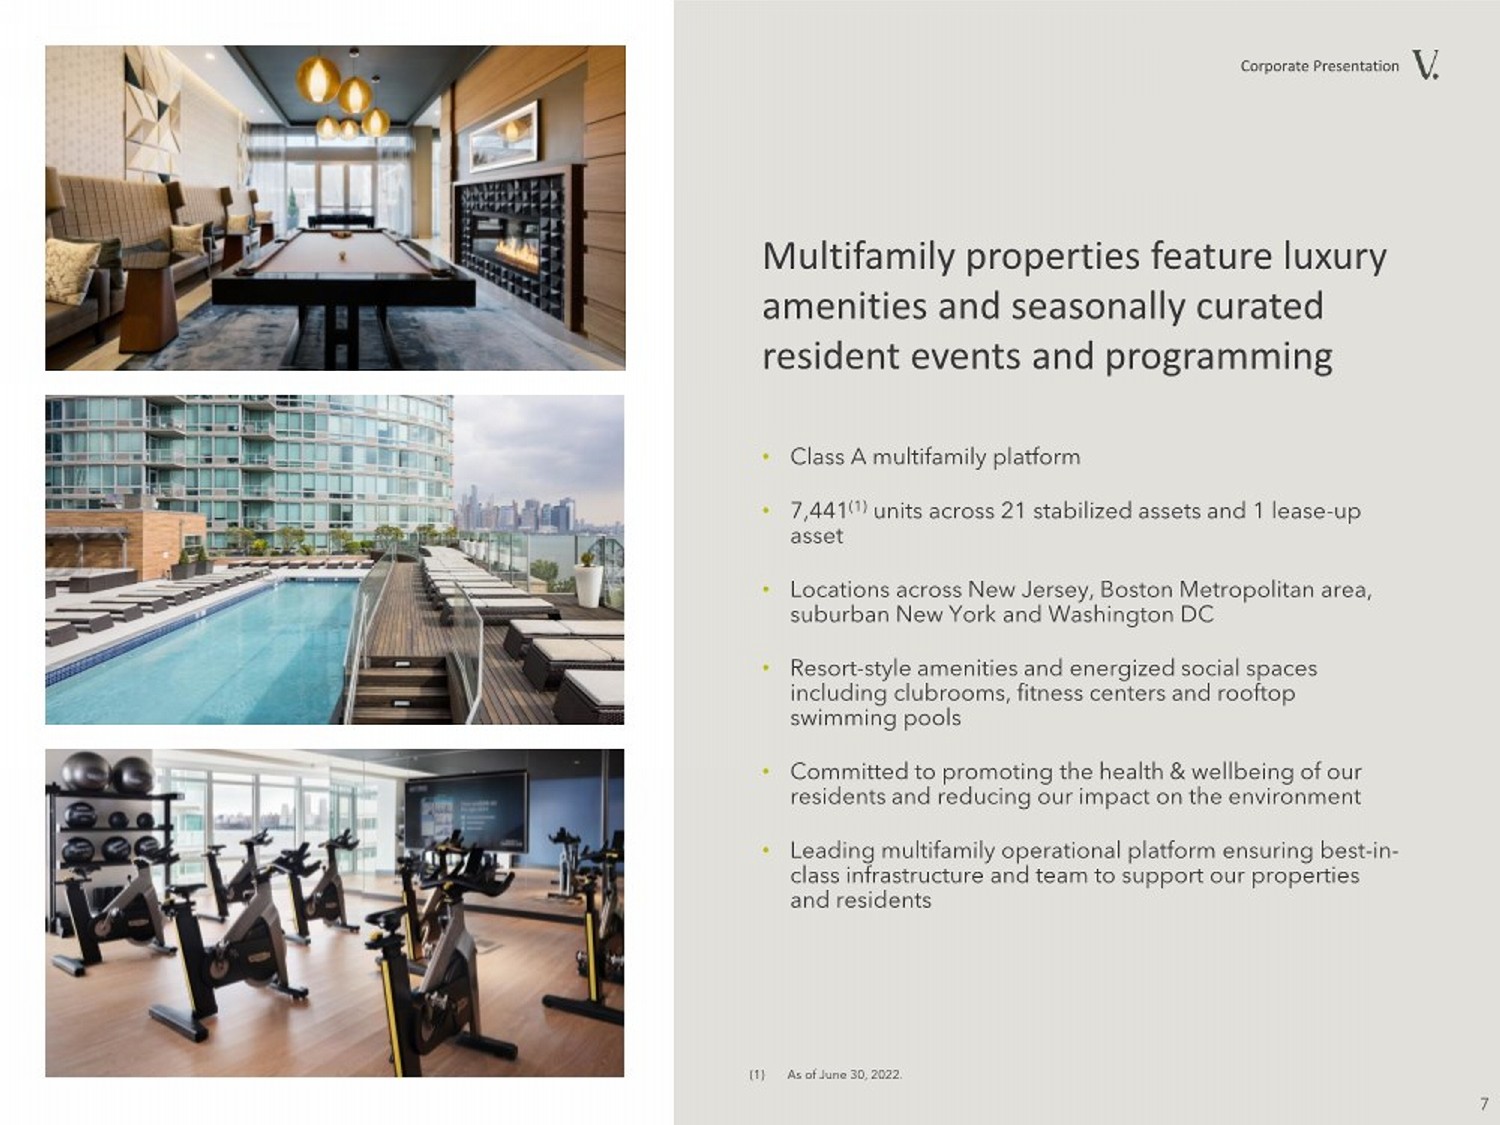
| Multifamily properties feature luxury amenities and seasonally curated resident events and programming • Class A multifamily platform • 7,441(1) units across 21 stabilized assets and 1 lease-up asset • Locations across New Jersey, Boston Metropolitan area, suburban New York and Washington DC • Resort-style amenities and energized social spaces including clubrooms, fitness centers and rooftop swimming pools • Committed to promoting the health & wellbeing of our residents and reducing our impact on the environment • Leading multifamily operational platform ensuring best-in- class infrastructure and team to support our properties and residents Corporate Presentation 7 (1) As of June 30, 2022. |
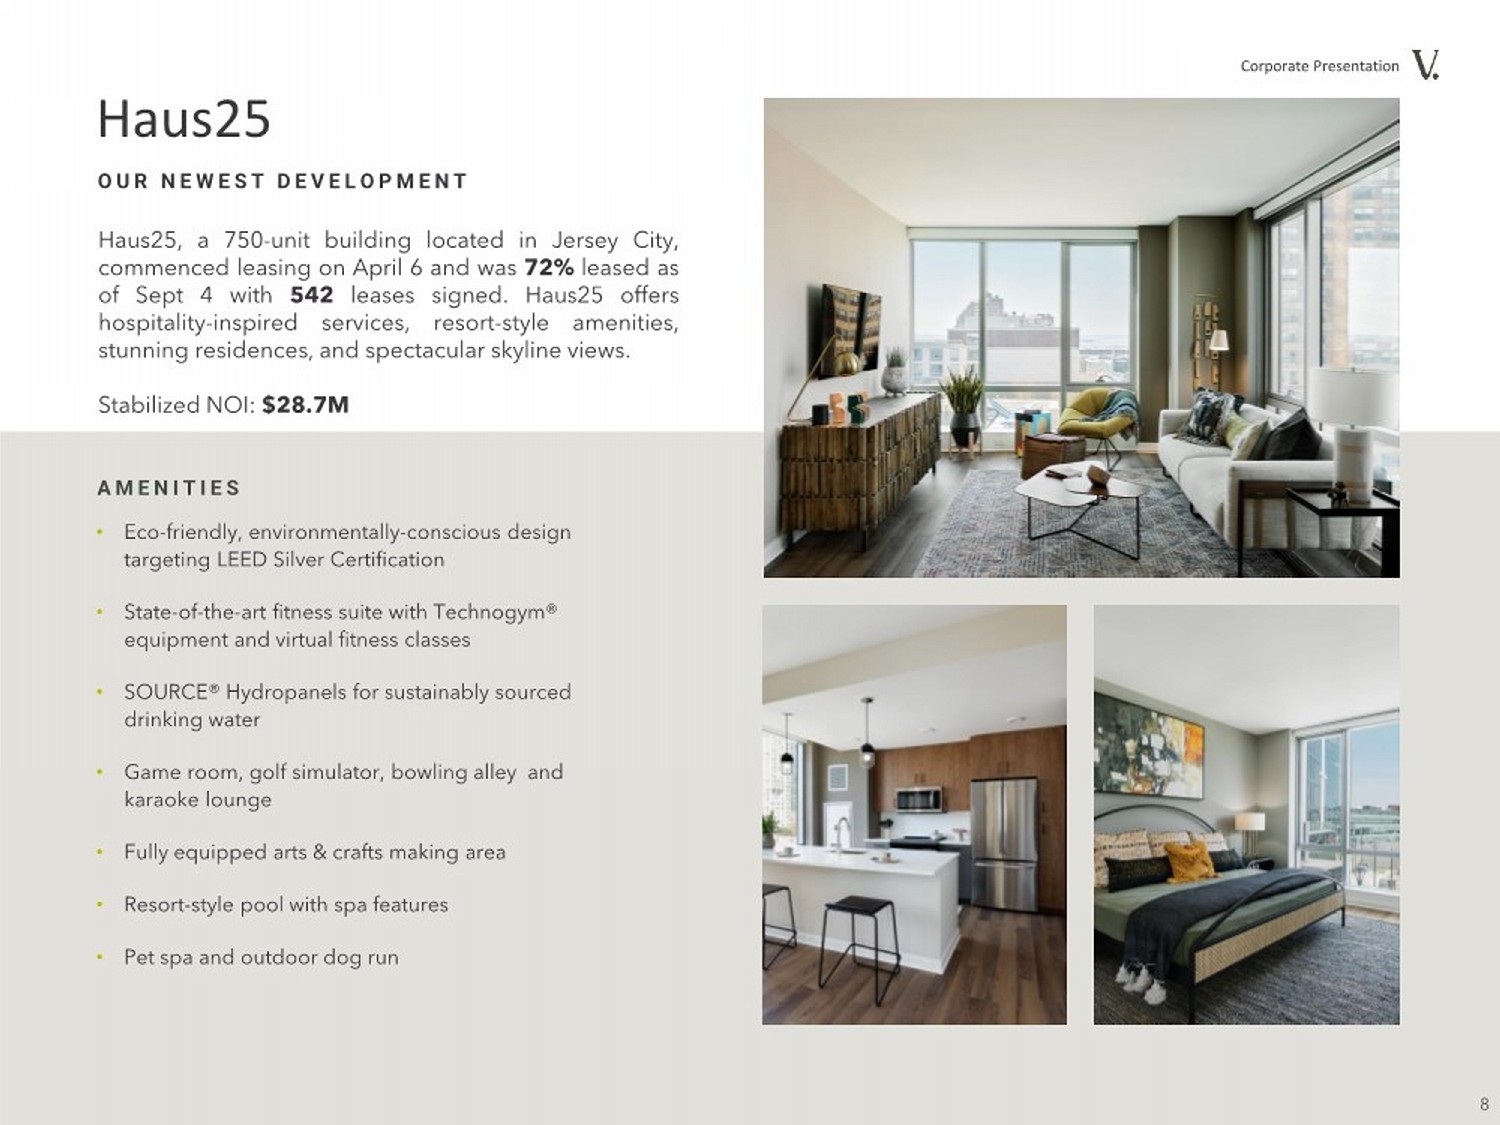
| Haus25 Haus25, a 750-unit building located in Jersey City, commenced leasing on April 6 and was 72% leased as of Sept 4 with 542 leases signed. Haus25 offers hospitality-inspired services, resort-style amenities, stunning residences, and spectacular skyline views. Stabilized NOI: $28.7M • Eco-friendly, environmentally-conscious design targeting LEED Silver Certification • State-of-the-art fitness suite with Technogym® equipment and virtual fitness classes • SOURCE® Hydropanels for sustainably sourced drinking water • Game room, golf simulator, bowling alley and karaoke lounge • Fully equipped arts & crafts making area • Resort-style pool with spa features • Pet spa and outdoor dog run Corporate Presentation OUR NEWEST DEVELOPMENT AMENITIES 8 |
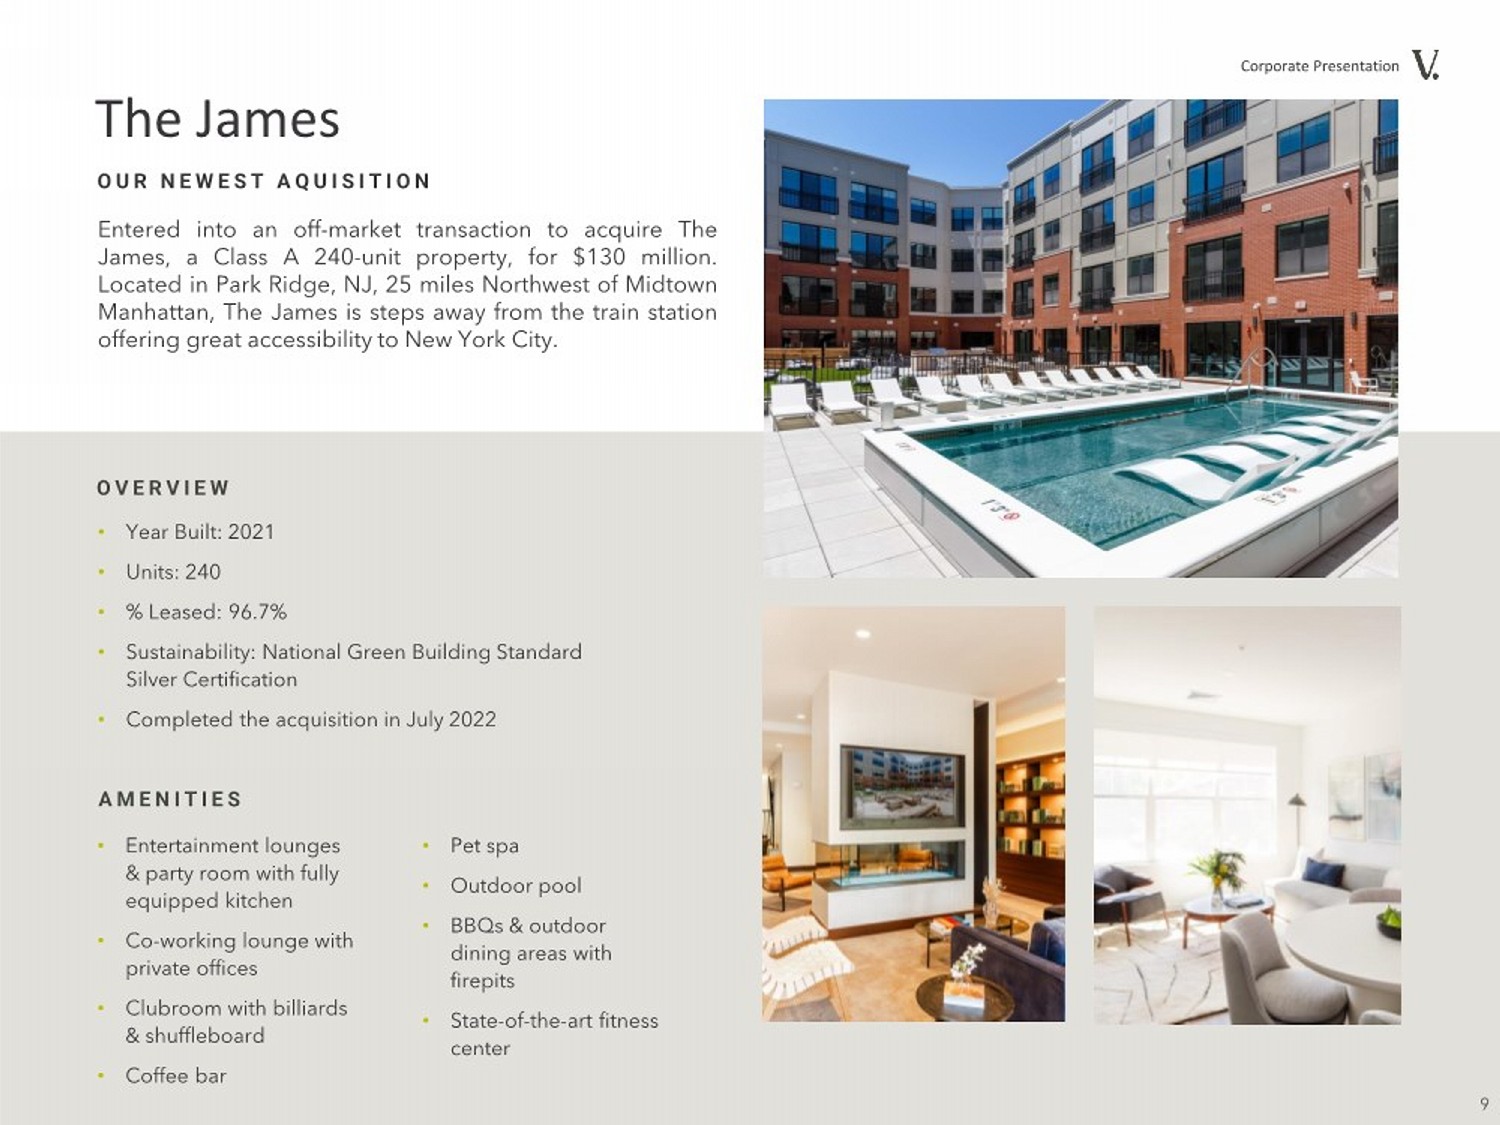
| • Year Built: 2021 • Units: 240 •% Leased: 96.7% • Sustainability: National Green Building Standard Silver Certification • Completed the acquisition in July 2022 • Entertainment lounges & party room with fully equipped kitchen • Co-working lounge with private offices • Clubroom with billiards & shuffleboard • Coffee bar AMENITIES Corporate Presentation OVERVIEW Entered into an off-market transaction to acquire The James, a Class A 240-unit property, for $130 million. Located in Park Ridge, NJ, 25 miles Northwest of Midtown Manhattan, The James is steps away from the train station offering great accessibility to New York City. OUR NEWEST AQUISITION The James 9 • Pet spa • Outdoor pool • BBQs & outdoor dining areas with firepits • State-of-the-art fitness center |
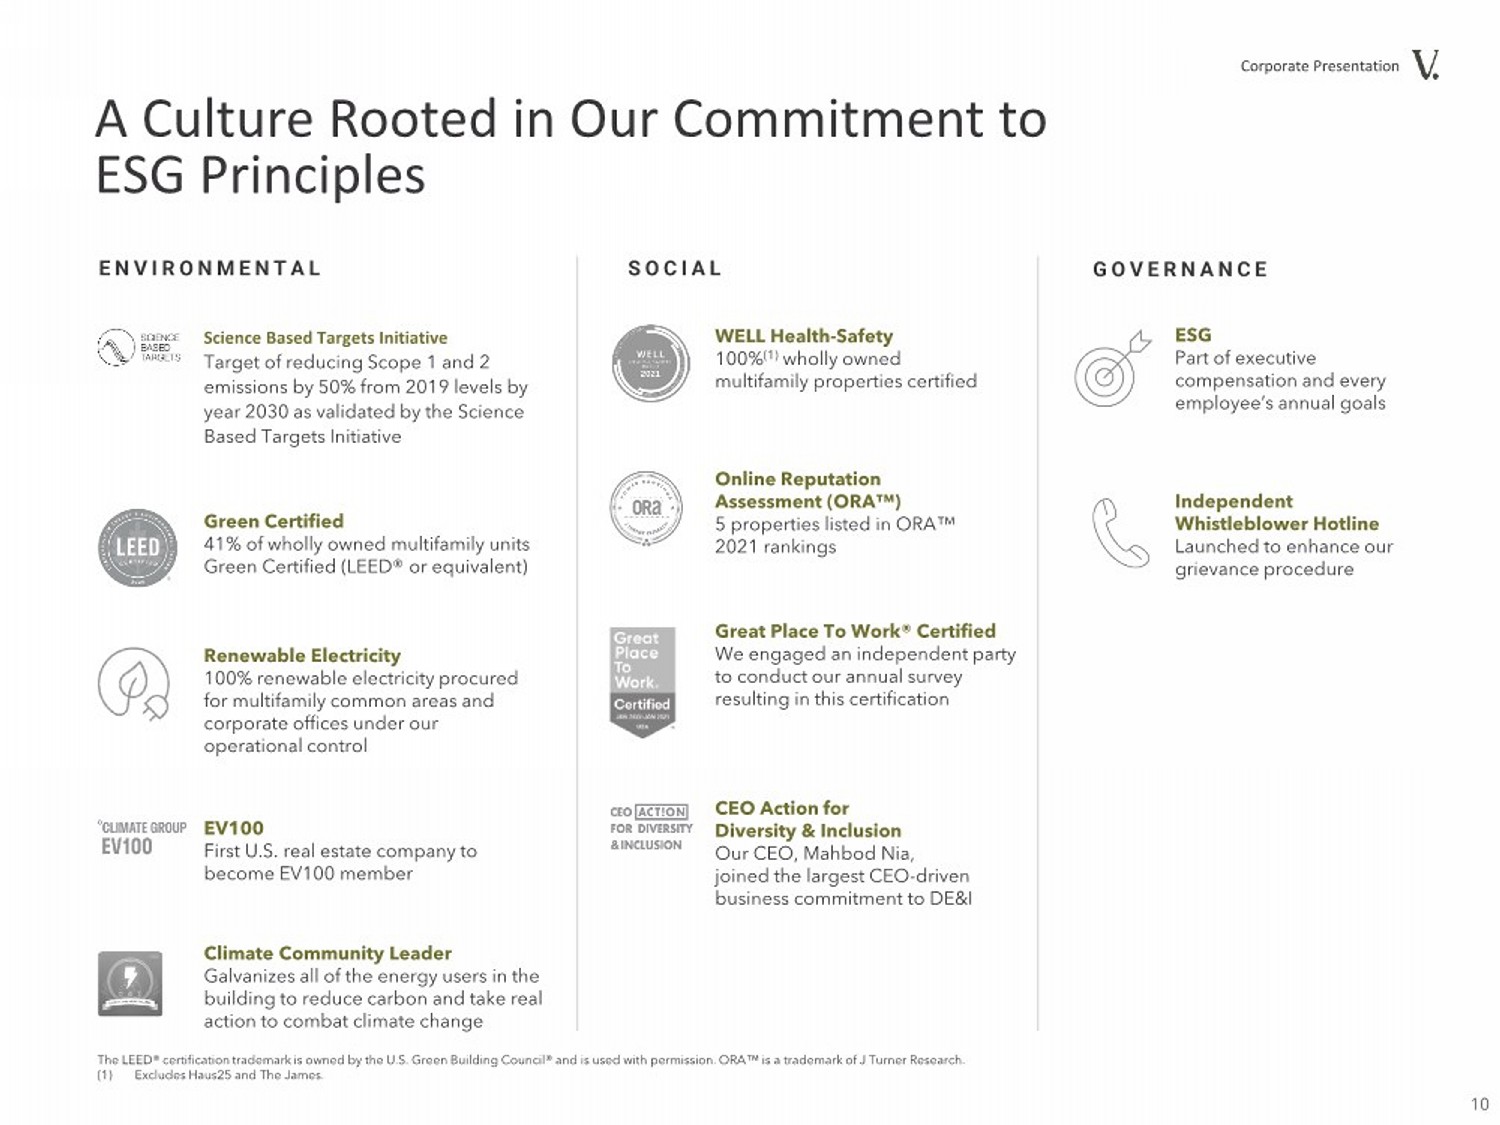
| Corporate Presentation ENVIRONMENTALSOCIALGOVERNANCE Science Based Targets Initiative Target of reducing Scope 1 and 2 emissions by 50% from 2019 levels by year 2030 as validated by the Science Based Targets Initiative Green Certified 41% of wholly owned multifamily units Green Certified (LEED® or equivalent) Renewable Electricity 100% renewable electricity procured for multifamily common areas and corporate offices under our operational control EV100 First U.S. real estate company to become EV100 member Climate Community Leader Galvanizes all of the energy users in the building to reduce carbon and take real action to combat climate change WELL Health-Safety 100%(1) wholly owned multifamily properties certified Online Reputation Assessment (ORA™) 5 properties listed in ORA™ 2021 rankings Great Place To Work® Certified We engaged an independent party to conduct our annual survey resulting in this certification CEO Action for Diversity & Inclusion Our CEO, Mahbod Nia, joined the largest CEO-driven business commitment to DE&I ESG Part of executive compensation and every employee’s annual goals Independent Whistleblower Hotline Launched to enhance our grievance procedure The LEED® certification trademark is owned by the U.S. Green Building Council® and is used with permission. ORA™ is a trademark of J Turner Research. (1) Excludes Haus25 and The James. 10 A Culture Rooted in Our Commitment to ESG Principles |
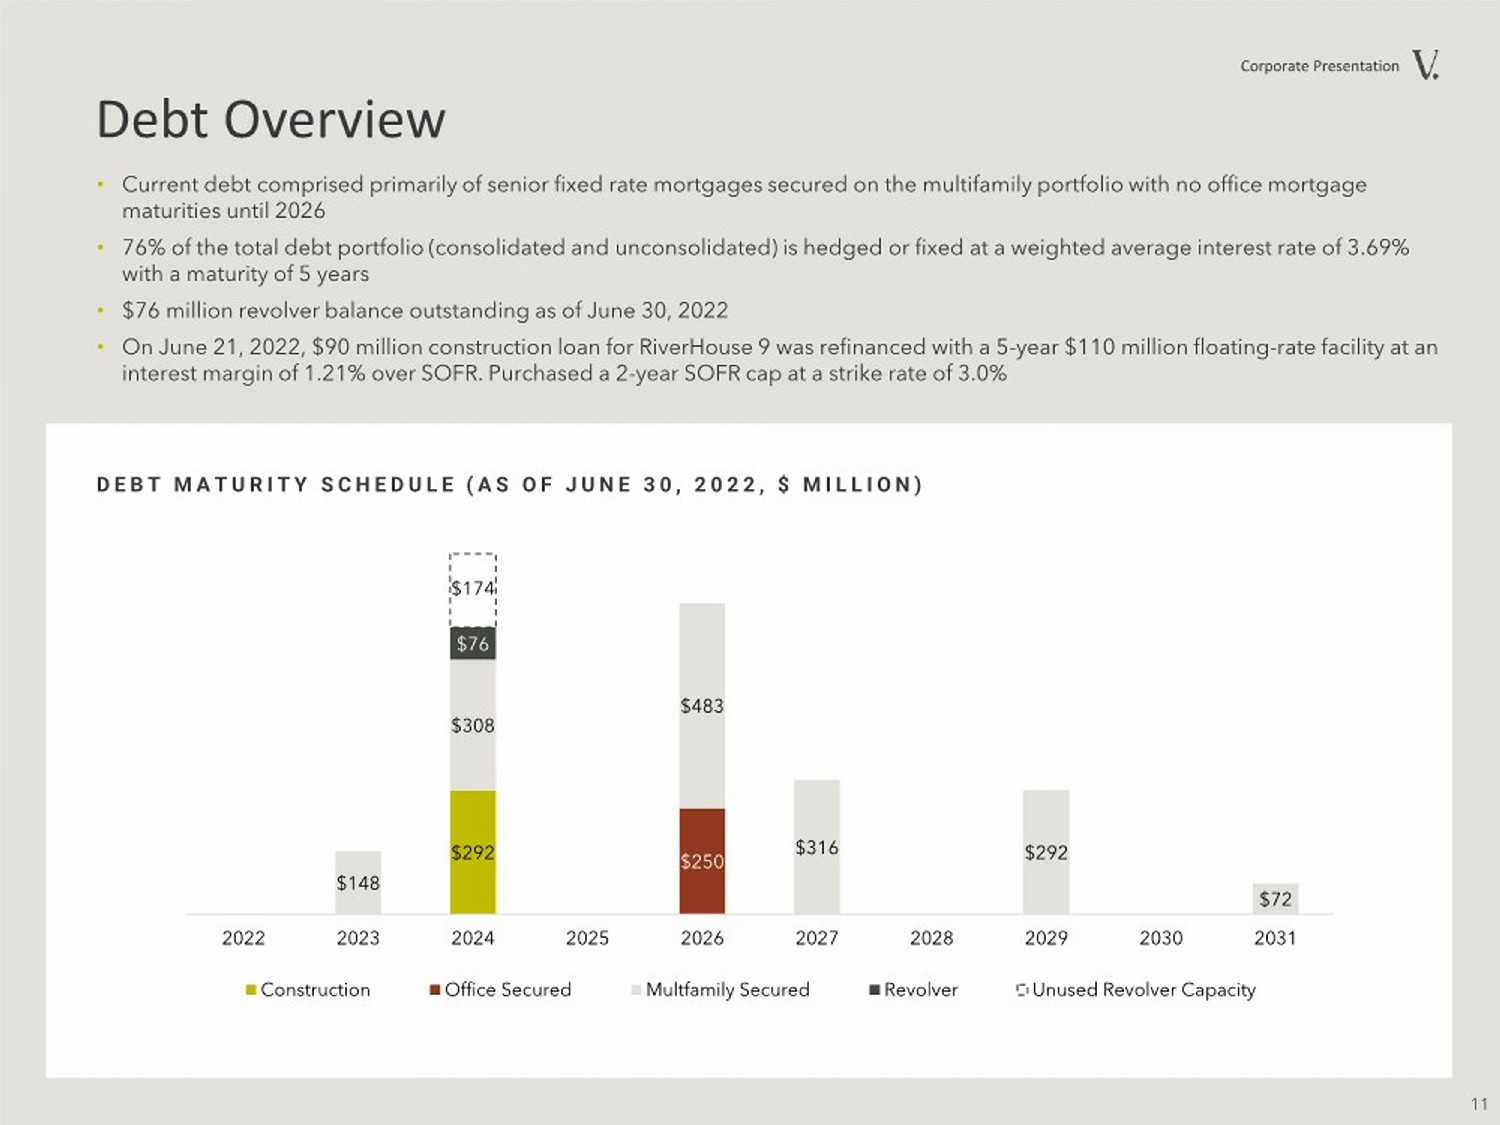
| Debt Overview • Current debt comprised primarily of senior fixed rate mortgages secured on the multifamily portfolio with no office mortgage maturities until 2026 • 76% of the total debt portfolio (consolidated and unconsolidated) is hedged or fixed at a weighted average interest rate of 3.69% with a maturity of 5 years • $76 million revolver balance outstanding as of June 30, 2022 • On June 21, 2022, $90 million construction loan for RiverHouse 9 was refinanced with a 5-year $110 million floating-rate facility at an interest margin of 1.21% over SOFR. Purchased a 2-year SOFR cap at a strike rate of 3.0% DEBT MATURITY SCHEDULE (AS OF JUNE 30, 2022, $ MILLION) Corporate Presentation 11 $292 $250 $148 $308 $483 $316 $292 $72 $76 $174 2022 2023 2024 2025 2026 2027 2028 2029 2030 2031 Construction Office Secured Multfamily Secured Revolver Unused Revolver Capacity |
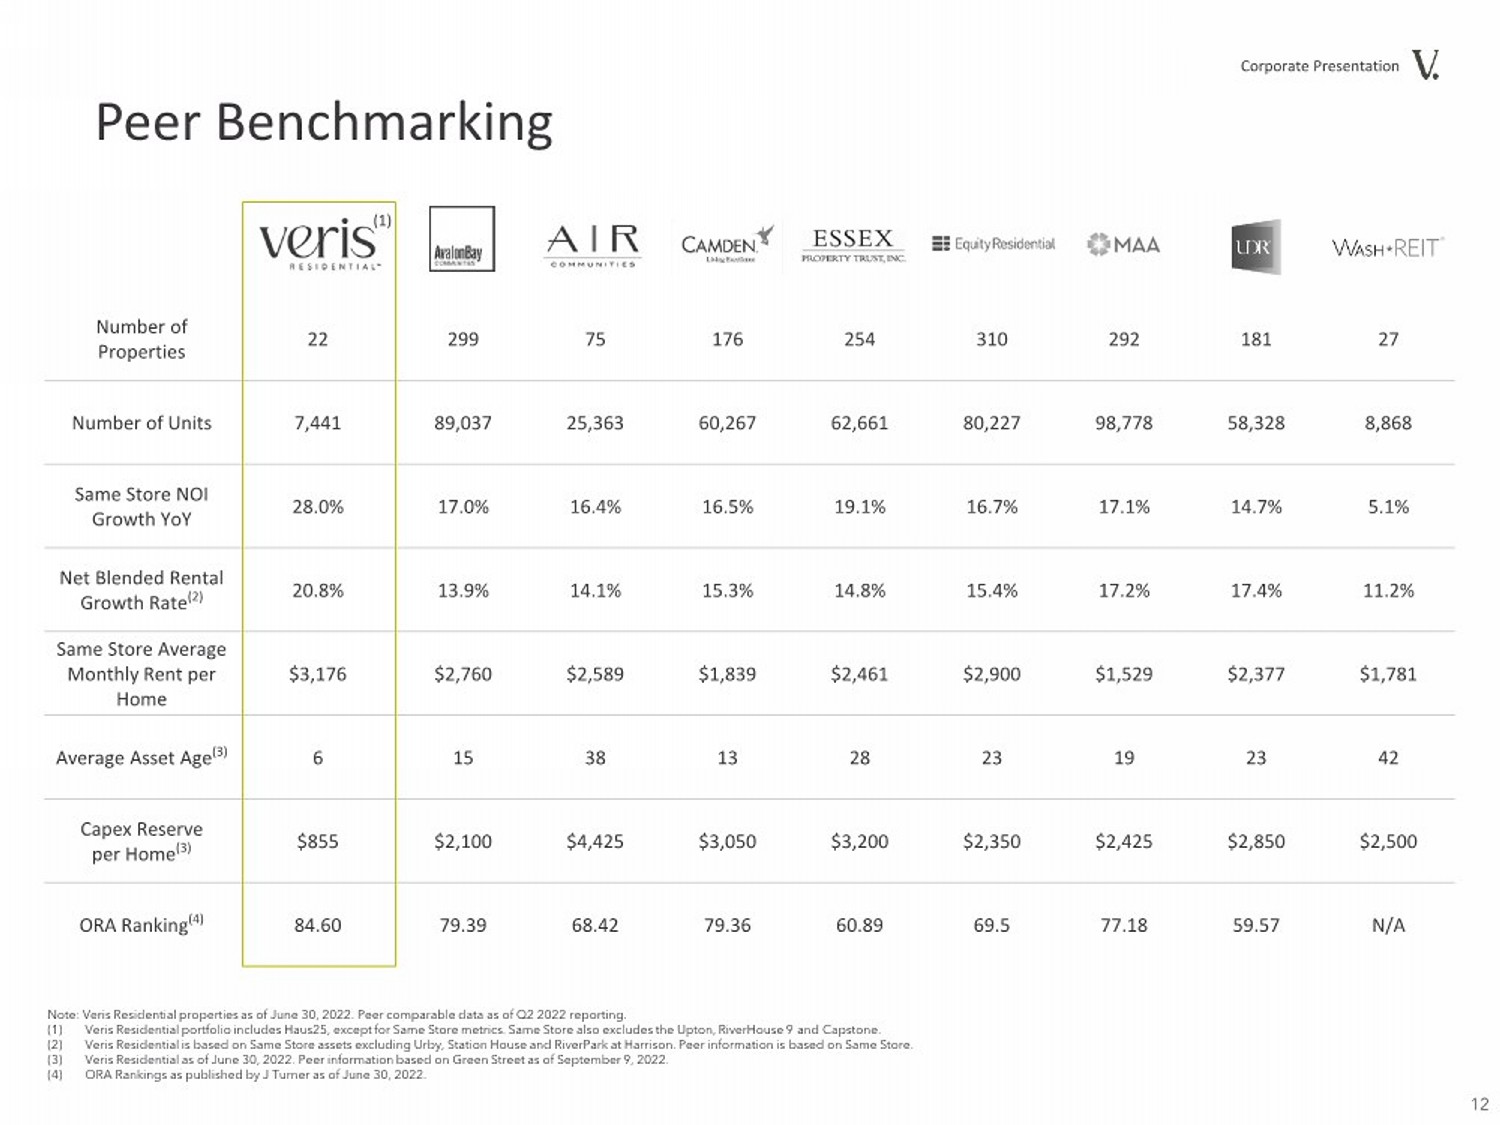
| 12 Corporate Presentation Peer Benchmarking Note: Veris Residential properties as of June 30, 2022. Peer comparable data as of Q2 2022 reporting. (1) Veris Residential portfolio includes Haus25, except for Same Store metrics. Same Store also excludes the Upton, RiverHouse 9 and Capstone. (2) Veris Residential is based on Same Store assets excluding Urby, Station House and RiverPark at Harrison. Peer information is based on Same Store. (3) Veris Residential as of June 30, 2022. Peer information based on Green Street as of September 9, 2022. (4) ORA Rankings as published by J Turner as of June 30, 2022. Number of Properties 22 299 75 176 254 310 292 181 27 Number of Units 7,441 89,037 25,363 60,267 62,661 80,227 98,778 58,328 8,868 Same Store NOI Growth YoY 28.0% 17.0% 16.4% 16.5% 19.1% 16.7% 17.1% 14.7% 5.1% Net Blended Rental Growth Rate(2) 20.8% 13.9% 14.1% 15.3% 14.8% 15.4% 17.2% 17.4% 11.2% Same Store Average Monthly Rent per Home $3,176 $2,760 $2,589 $1,839 $2,461 $2,900 $1,529 $2,377 $1,781 Average Asset Age(3) 6 15 38 13 28 23 19 23 42 Capex Reserve per Home(3) $855 $2,100 $4,425 $3,050 $3,200 $2,350 $2,425 $2,850 $2,500 ORA Ranking(4) 84.60 79.39 68.42 79.36 60.89 69.5 77.18 59.57 N/A (1) |
| Appendix 13 Corporate Presentation |
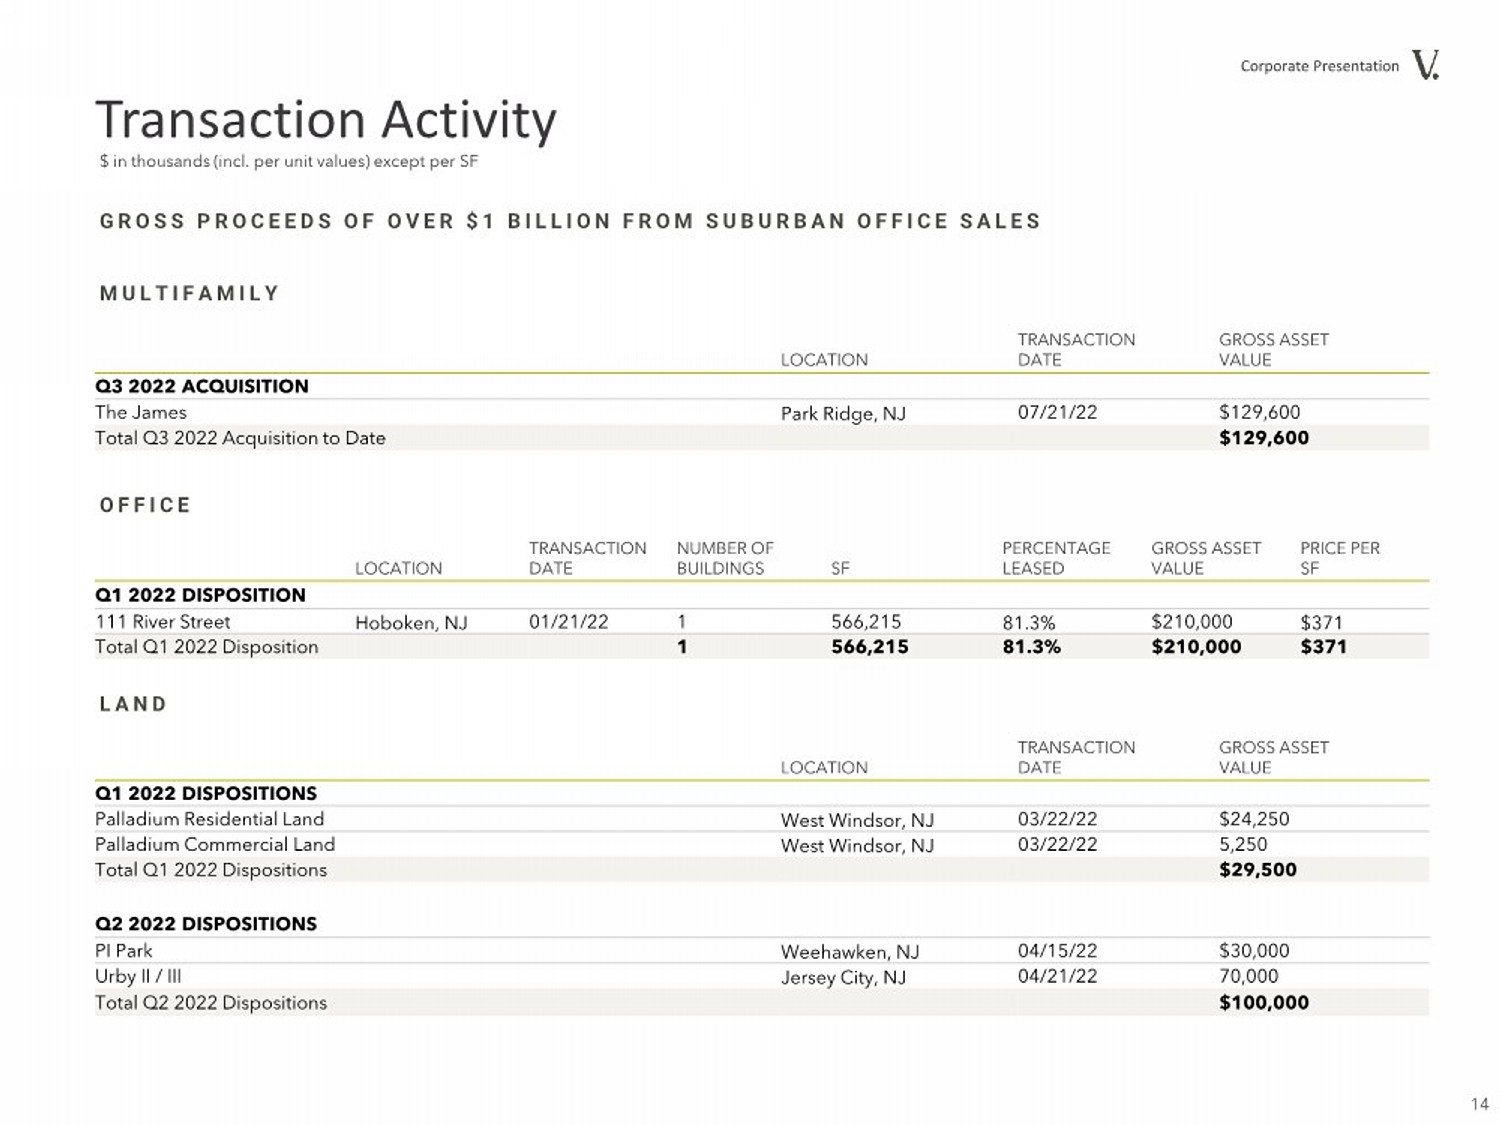
| Transaction Activity Corporate Presentation 14 TRANSACTION GROSS ASSET LOCATION DATE VALUE Q1 2022 DISPOSITIONS Palladium Residential Land West Windsor, NJ 03/22/22 $24,250 Palladium Commercial Land West Windsor, NJ 03/22/22 5,250 Total Q1 2022 Dispositions $29,500 Q2 2022 DISPOSITIONS PI Park Weehawken, NJ 04/15/22 $30,000 Urby II / III Jersey City, NJ 04/21/22 70,000 Total Q2 2022 Dispositions $100,000 TRANSACTION NUMBER OF PERCENTAGE GROSS ASSET PRICE PER LOCATION DATE BUILDINGS SF LEASED VALUE SF Q1 2022 DISPOSITION 111 River Street Hoboken, NJ 01/21/22 1 566,215 81.3% $210,000 $371 Total Q1 2022 Disposition 1 566,215 81.3% $210,000 $371 GROSS PROCEEDS OF OVER $1 BILLION FROM SUBURBAN OFFICE SALES OFFICE LAND TRANSACTION GROSS ASSET LOCATION DATE VALUE Q3 2022 ACQUISITION The James Park Ridge, NJ 07/21/22 $129,600 Total Q3 2022 Acquisition to Date $129,600 MULTIFAMILY $ in thousands (incl. per unit values) except per SF |
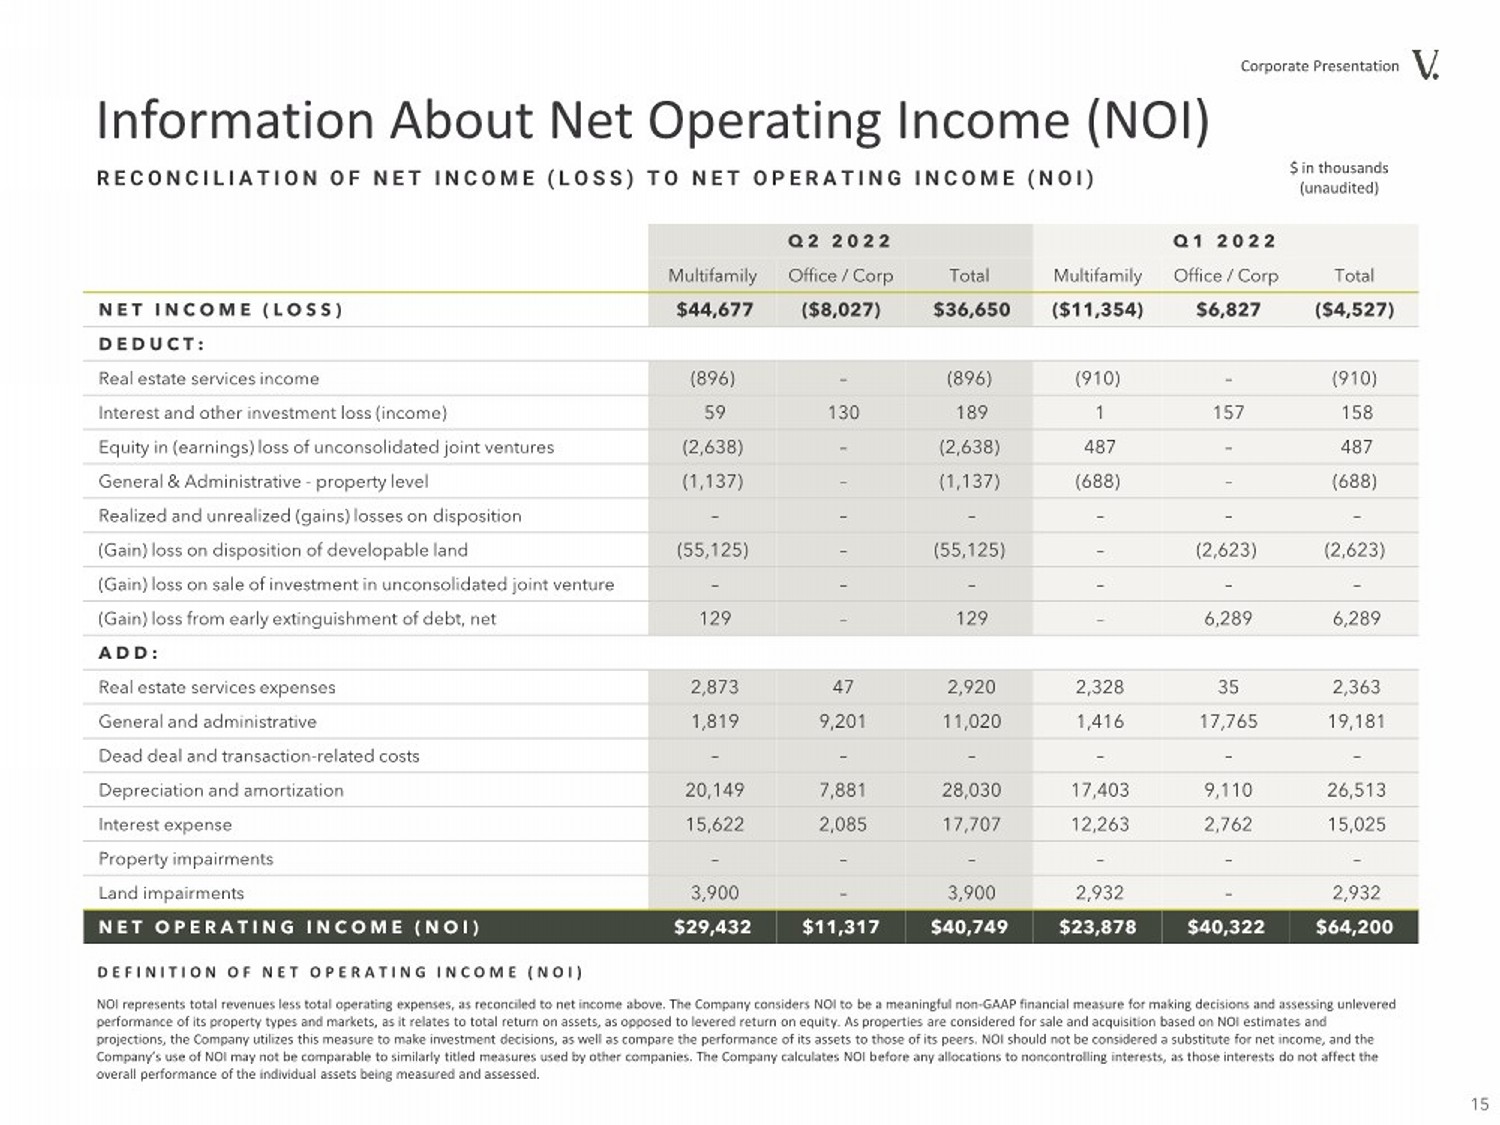
| NOI represents total revenues less total operating expenses, as reconciled to net income above. The Company considers NOI to be a meaningful non-GAAP financial measure for making decisions and assessing unlevered performance of its property types and markets, as it relates to total return on assets, as opposed to levered return on equity. As properties are considered for sale and acquisition based on NOI estimates and projections, the Company utilizes this measure to make investment decisions, as well as compare the performance of its assets to those of its peers. NOI should not be considered a substitute for net income, and the Company’s use of NOI may not be comparable to similarly titled measures used by other companies. The Company calculates NOI before any allocations to noncontrolling interests, as those interests do not affect the overall performance of the individual assets being measured and assessed. DEFINITION OF NET OPERATING INCOME (NOI) $ in thousands (unaudited) Information About Net Operating Income (NOI) RECONCILIATION OF NET INCOME (LOSS) TO NET OPERATING INCOME (NOI) 15 Corporate Presentation Q 2 2 0 2 2 Q 1 2 0 2 2 Multifamily Office / Corp Total Multifamily Office / Corp Total NET INCOME (LOSS) $44,677 ($8,027) $36,650 ($11,354) $6,827 ($4,527) DEDUCT: Real estate services income (896) –(896) (910) –(910) Interest and other investment loss (income) 59 130 189 1 157 158 Equity in (earnings) loss of unconsolidated joint ventures (2,638) –(2,638) 487 – 487 General & Administrative - property level (1,137) –(1,137) (688) –(688) Realized and unrealized (gains) losses on disposition –––––– (Gain) loss on disposition of developable land (55,125) –(55,125) –(2,623) (2,623) (Gain) loss on sale of investment in unconsolidated joint venture –––––– (Gain) loss from early extinguishment of debt, net 129 – 129 – 6,289 6,289 ADD: Real estate services expenses 2,873 47 2,920 2,328 35 2,363 General and administrative 1,819 9,201 11,020 1,416 17,765 19,181 Dead deal and transaction-related costs –––––– Depreciation and amortization 20,149 7,881 28,030 17,403 9,110 26,513 Interest expense 15,622 2,085 17,707 12,263 2,762 15,025 Property impairments –––––– Land impairments 3,900 – 3,900 2,932 – 2,932 NET OPERATING INCOME (NOI) $29,432 $11,317 $40,749 $23,878 $40,322 $64,200 |
| Blended Net Rental Growth Rate is weighted average of the net effective change in rent (inclusive of concessions) for a lease with a new resident or for a renewed lease on an apartment unit compared to the rent for the prior lease of the identical apartment unit. Average Monthly Rent per Home represents the average of effective rent (net of concessions) for in-place leases and the market rent for vacant homes. Same Store include properties that were owned for the entirety of the years being compared and exclude properties under redevelopment or development and properties acquired, sold or classified as held for sale during the years being compared. Other Definitions 16 Corporate Presentation |
| VerisResidential.com Thank you. |