| J U N E 2 0 2 2 |
| Statements made in this presentation may be forward-looking statements within the meaning of Section 21E of the Securities Exchange Act of 1934, as amended.Such forward-looking statements are intended to be covered by the safe harbor provisions for forward-looking statements contained in Section 21E of such act. Such forward- looking statements relate to, without limitation, our future economic performance, plans and objectives for future operations and projections of revenue and other financial items. Forward-looking statements can be identified by the use of words such as “may,” “will,” “plan,” “potential,” “projected,” “should,” “expect,” “anticipate,” “estimate,” “target,” “continue” or comparable terminology. Forward-looking statements are inherently subject to certain risks, trends and uncertainties, many of which we cannot predict with accuracy and some of which we might not even anticipate. Although we believe that the expectations reflected in such forward-looking statements are based upon reasonable assumptions at the time made, we can give no assurance that such expectations will be achieved. Future events and actual results, financial and otherwise, may differ materially from the results discussed in the forward-looking statements. Readers are cautioned not to place undue reliance on these forward-looking statements and are advised to consider the factors listed above together with the additional factors under the heading “Disclosure Regarding Forward-Looking Statements” and “Risk Factors” in our annual reports on Form 10-K, as may be supplemented or amended by our quarterly reports on Form 10-Q, which are incorporated herein by reference. We assume no obligation to update or supplement forward-looking statements that become untrue because of subsequent events, new information or otherwise. |
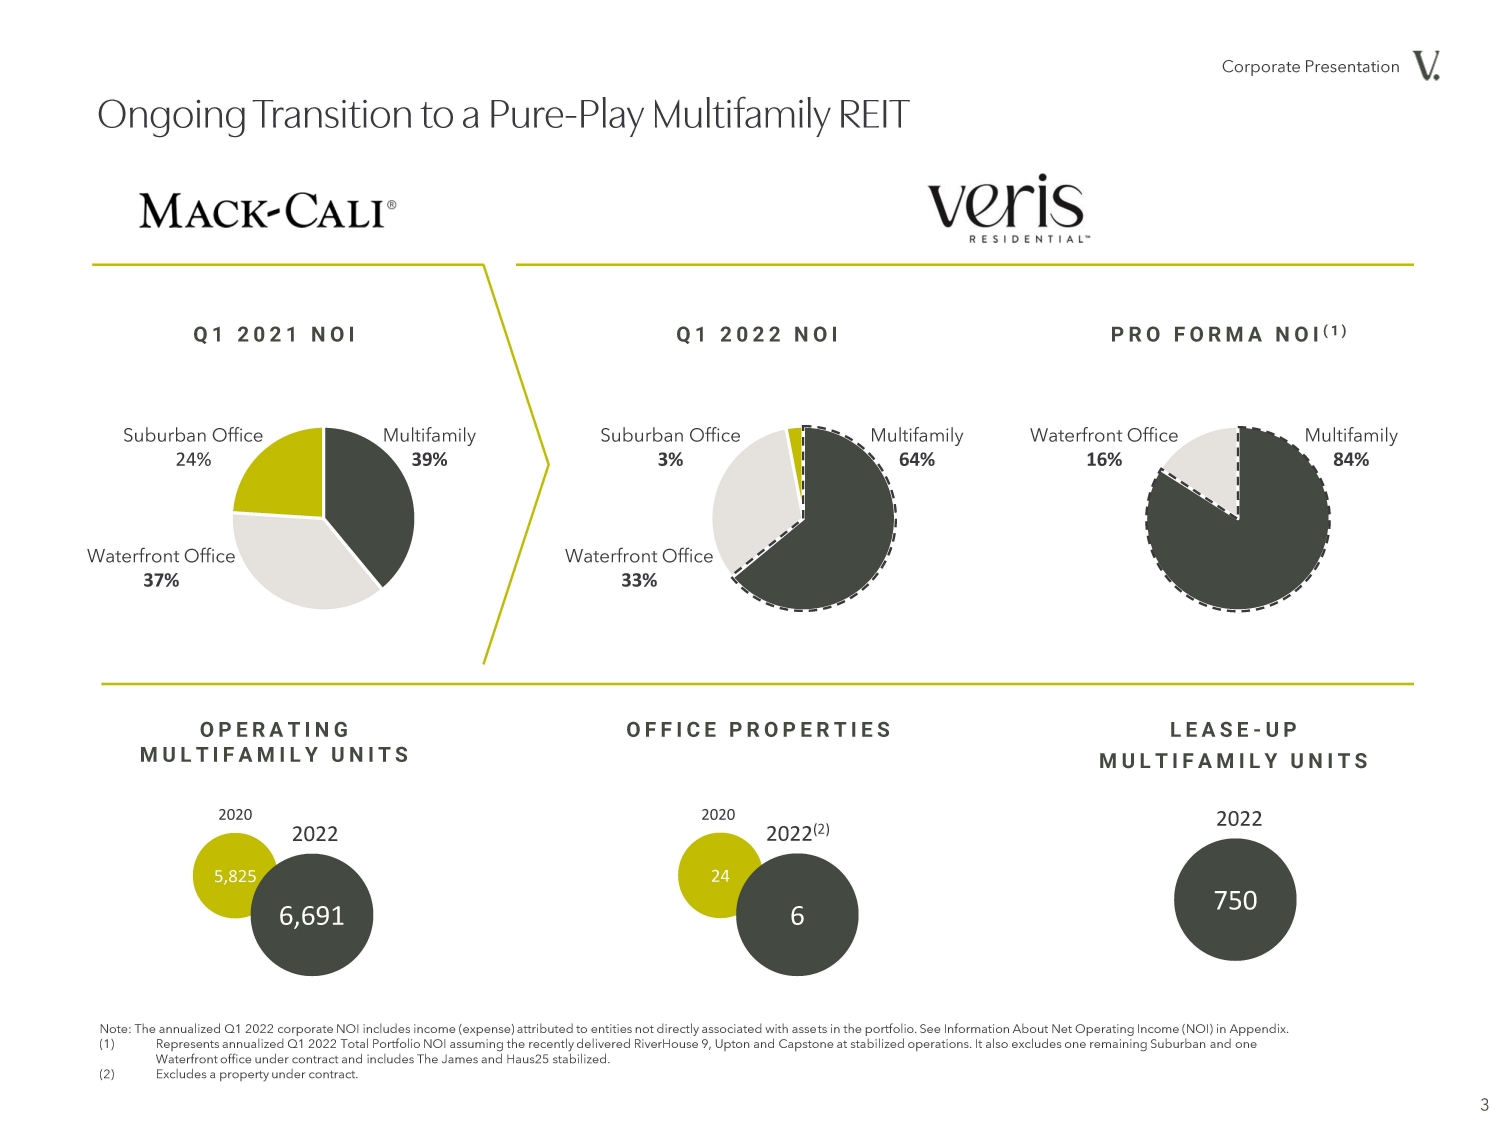
| 3 5,825 6,691 2020 2022 750 2022 24 6 2020 2022(2) Multifamily 39% Waterfront Office 37% Suburban Office 24% Q1 2021 NOI Q1 2022 NOI P R O F O R M A NOI( 1 ) Waterfront Office 33% Multifamily 64% Suburban Office 3% Waterfront Office 16% Multifamily 84% Note: The annualized Q1 2022 corporate NOI includes income (expense) attributed to entities not directly associated with assets in the portfolio. See Information About Net Operating Income (NOI) in Appendix. (1) Represents annualized Q1 2022 Total Portfolio NOI assuming the recently delivered RiverHouse 9, Upton and Capstone at stabilized operations. It also excludes one remaining Suburban and one Waterfront office under contract and includes The James and Haus25 stabilized. (2) Excludes a property under contract. O P E R A T I N G MULTIFAMILY UNITS OFFICE PROPERTIES LEASE- U P MULTIFAMILY UNITS |
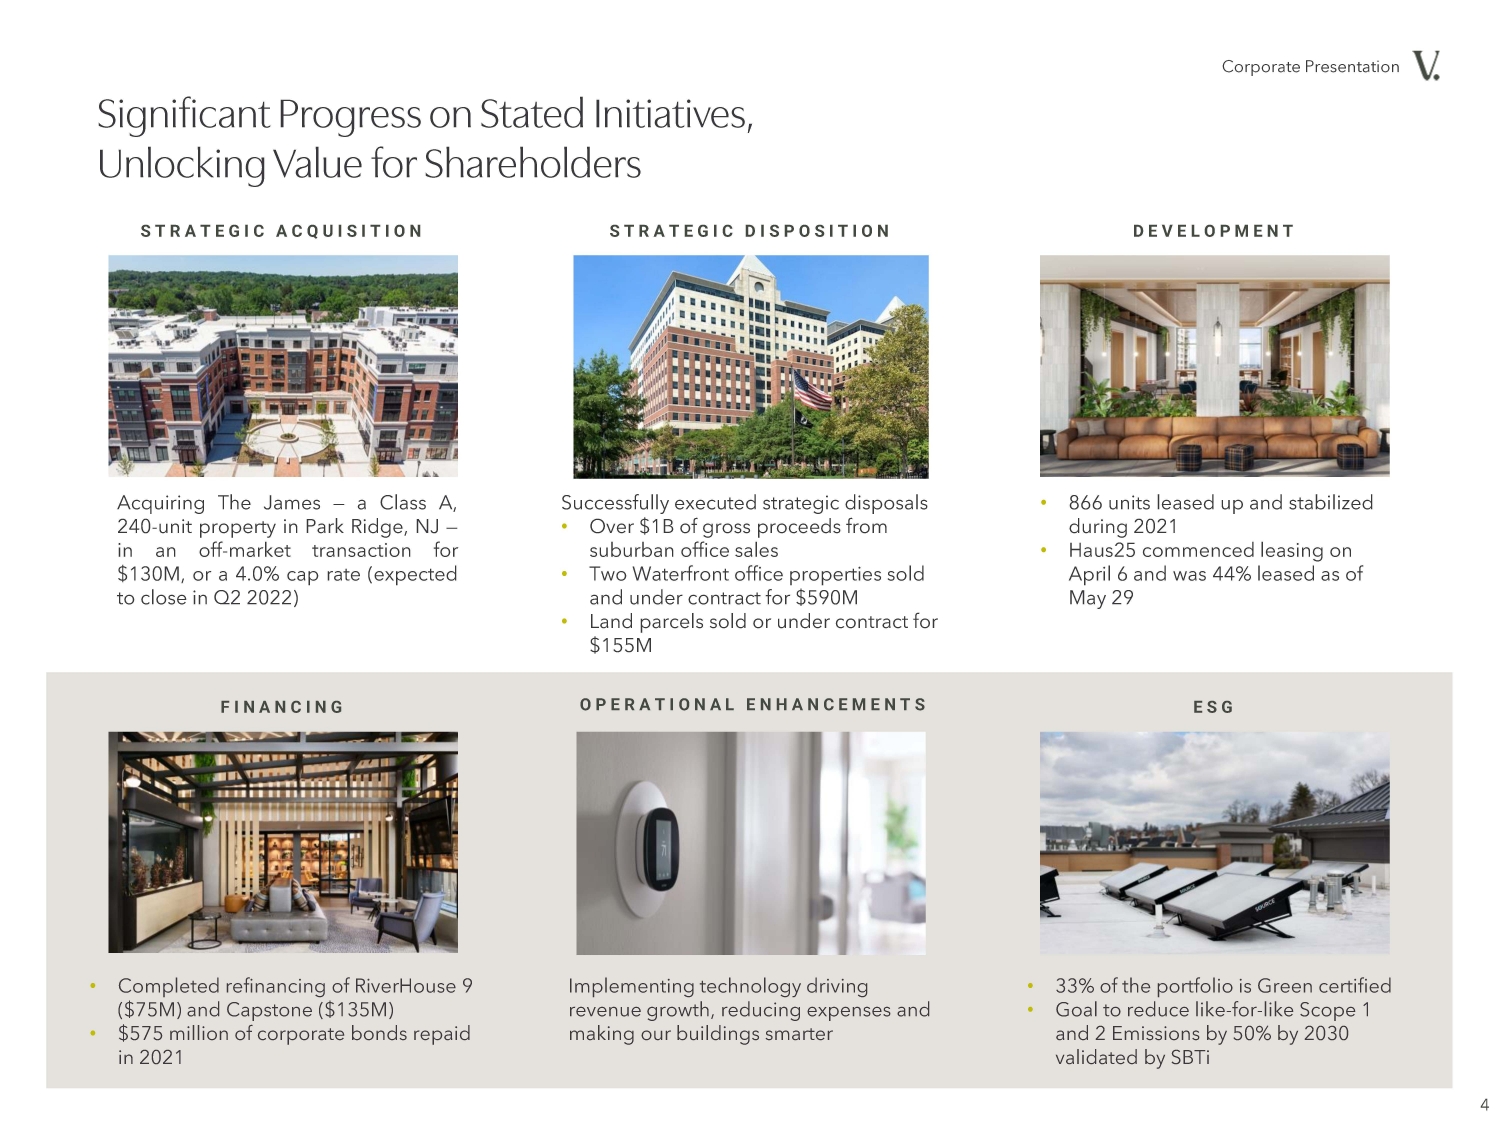
| STRATEGIC ACQUISITION DEVELOPMENT FINANCINGESG OPERATIONAL ENHANCEMENTS Acquiring The James — a Class A, 240-unit property in Park Ridge, NJ — in an off-market transaction for $130M, or a 4.0% cap rate (expected to close in Q2 2022) STRATEGIC DISPOSITION Successfully executed strategic disposals • Over $1B of gross proceeds from suburban office sales • Two Waterfront office properties sold and under contract for $590M • Land parcels sold or under contract for $155M • 866 units leased up and stabilized during 2021 • Haus25 commenced leasing on April 6 and was 44% leased as of May 29 • Completed refinancing of RiverHouse 9 ($75M) and Capstone ($135M) • $575 million of corporate bonds repaid in 2021 Implementing technology driving revenue growth, reducing expenses and making our buildings smarter • 33% of the portfolio is Green certified • Goal to reduce like-for-like Scope 1 and 2 Emissions by 50% by 2030 validated by SBTi 4 |
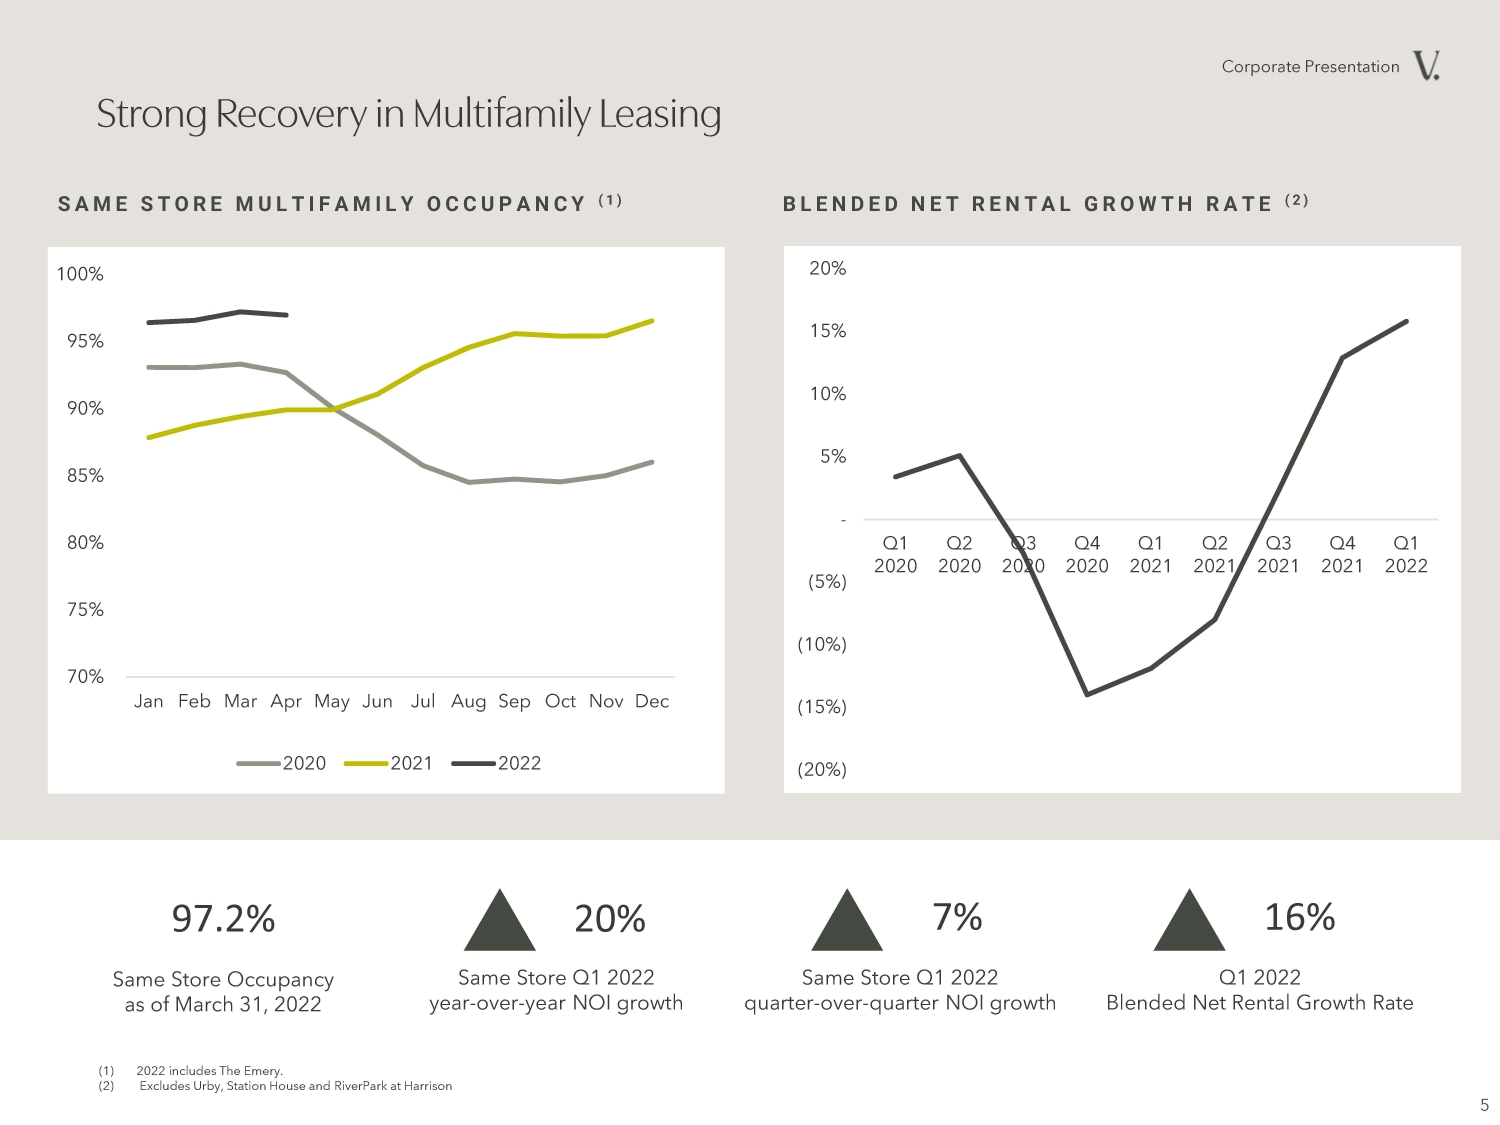
| 16% Q1 2022 Blended Net Rental Growth Rate SAME STORE MULTIFAMILY OCCUPANCY ( 1 ) 20% Same Store Q1 2022 year-over-year NOI growth 7% Same Store Q1 2022 quarter-over-quarter NOI growth 70% 75% 80% 85% 90% 95% 100% Jan Feb Mar Apr May Jun Jul Aug Sep Oct Nov Dec 2020 2021 2022 BLENDED NET RENTAL GROWTH RATE ( 2 ) 97.2% Same Store Occupancy as of March 31, 2022 (1) 2022 includes The Emery. (2) Excludes Urby, Station House and RiverPark at Harrison (20%) (15%) (10%) (5%) - 5% 10% 15% 20% Q1 2020 Q2 2020 Q3 2020 Q4 2020 Q1 2021 Q2 2021 Q3 2021 Q4 2021 Q1 2022 |
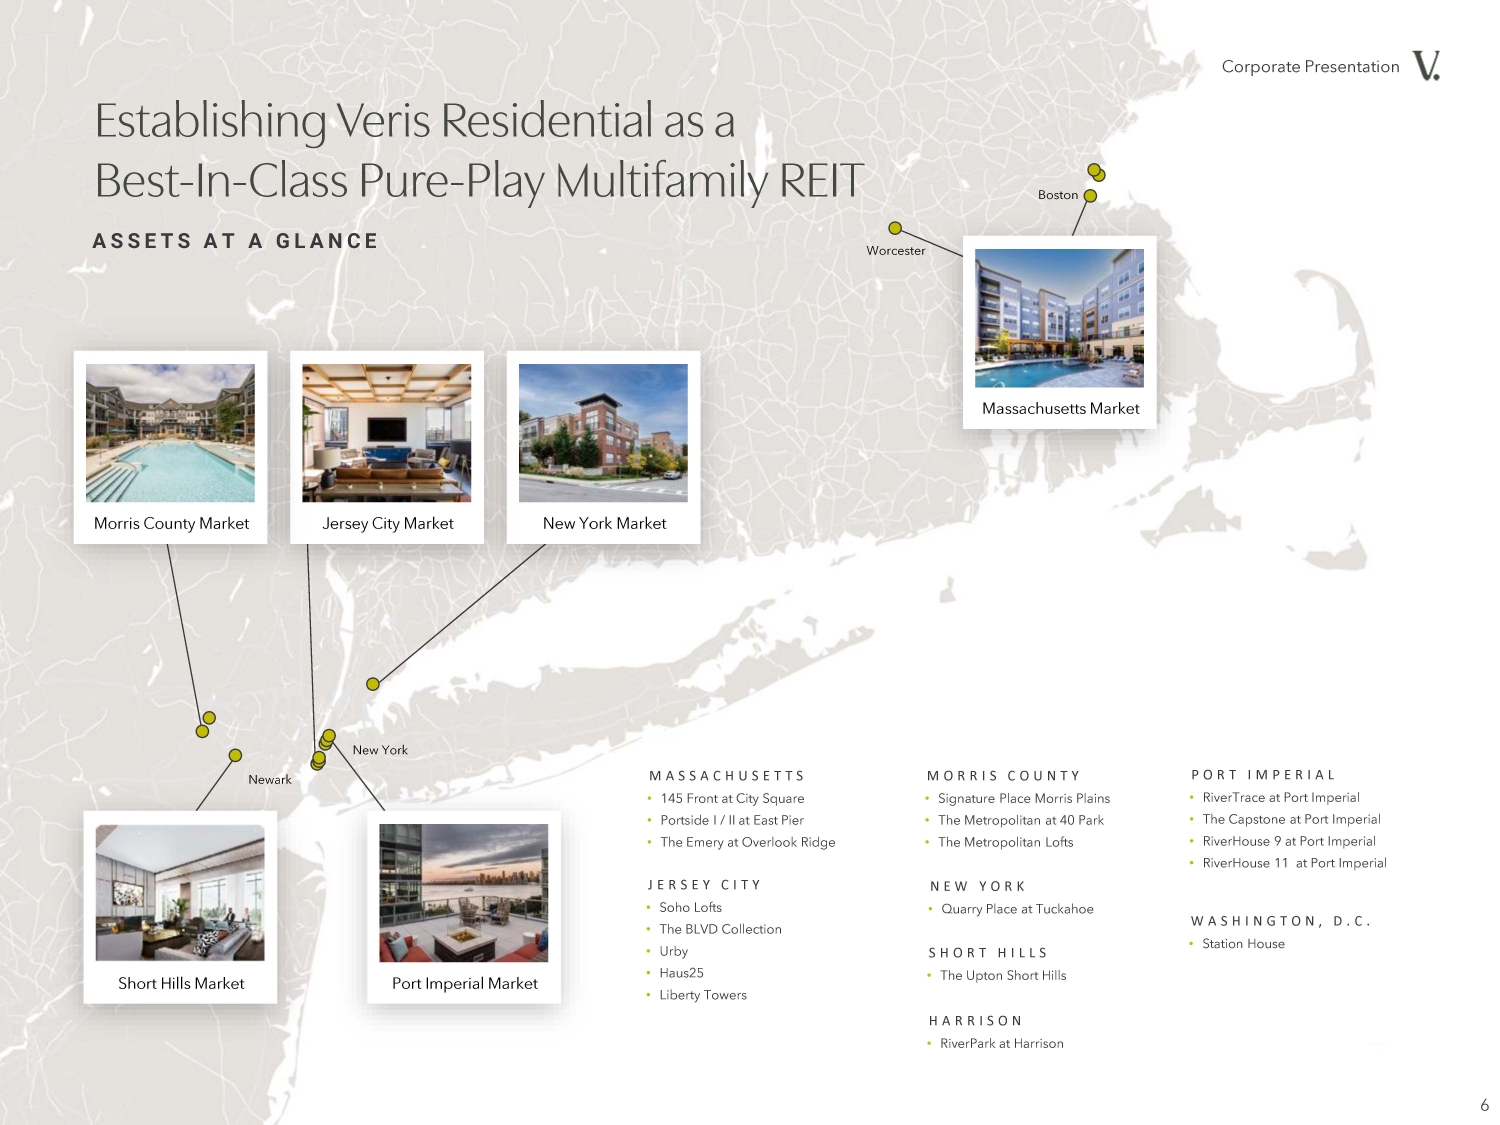
| MASSACHUSETTS • 145 Front at City Square • Portside I / II at East Pier • The Emery at Overlook Ridge MORRIS COUNTY • Signature Place Morris Plains • The Metropolitan at 40 Park • The Metropolitan Lofts SHORT HILLS • The Upton Short Hills JERSEY CITY • Soho Lofts • The BLVD Collection • Urby • Haus25 • Liberty Towers PORT IMPERIAL • RiverTrace at Port Imperial • The Capstone at Port Imperial • RiverHouse 9 at Port Imperial • RiverHouse 11 at Port Imperial N E W Y O R K • Quarry Place at Tuckahoe WASHINGTON, D.C. • Station House ASSETS AT A GLANCE HARRISON • RiverPark at Harrison |
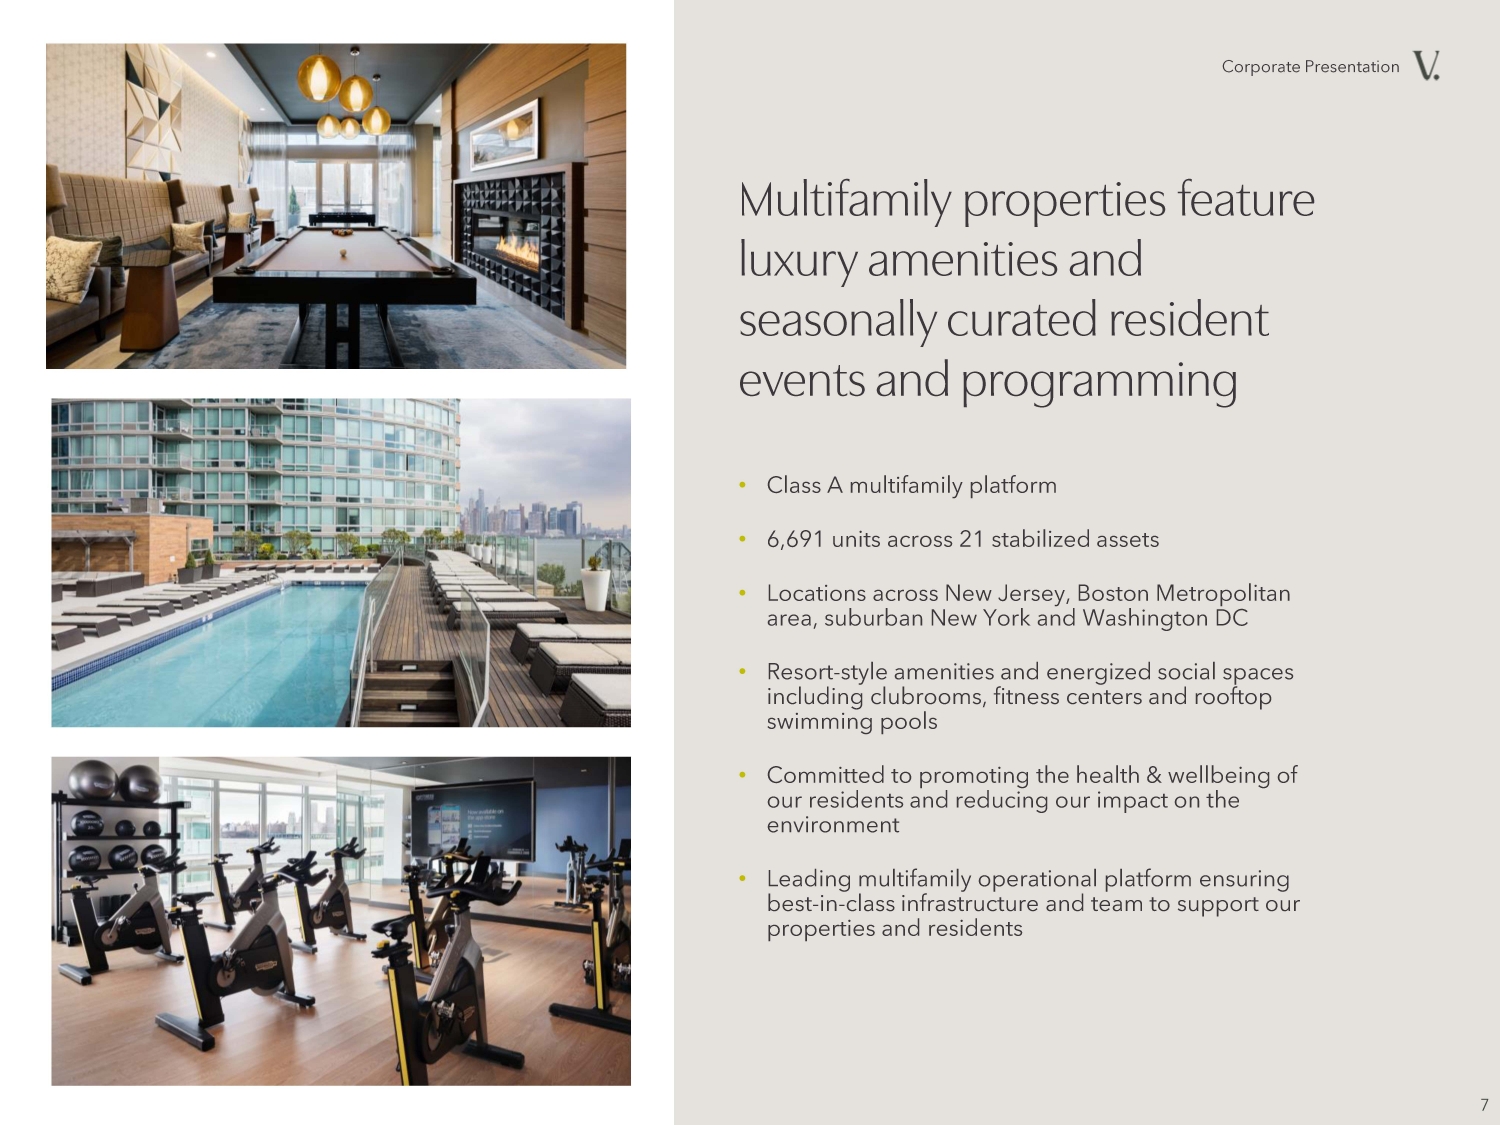
| • Class A multifamily platform • 6,691 units across 21 stabilized assets • Locations across New Jersey, Boston Metropolitan area, suburban New York and Washington DC • Resort-style amenities and energized social spaces including clubrooms, fitness centers and rooftop swimming pools • Committed to promoting the health & wellbeing of our residents and reducing our impact on the environment • Leading multifamily operational platform ensuring best-in-class infrastructure and team to support our properties and residents |
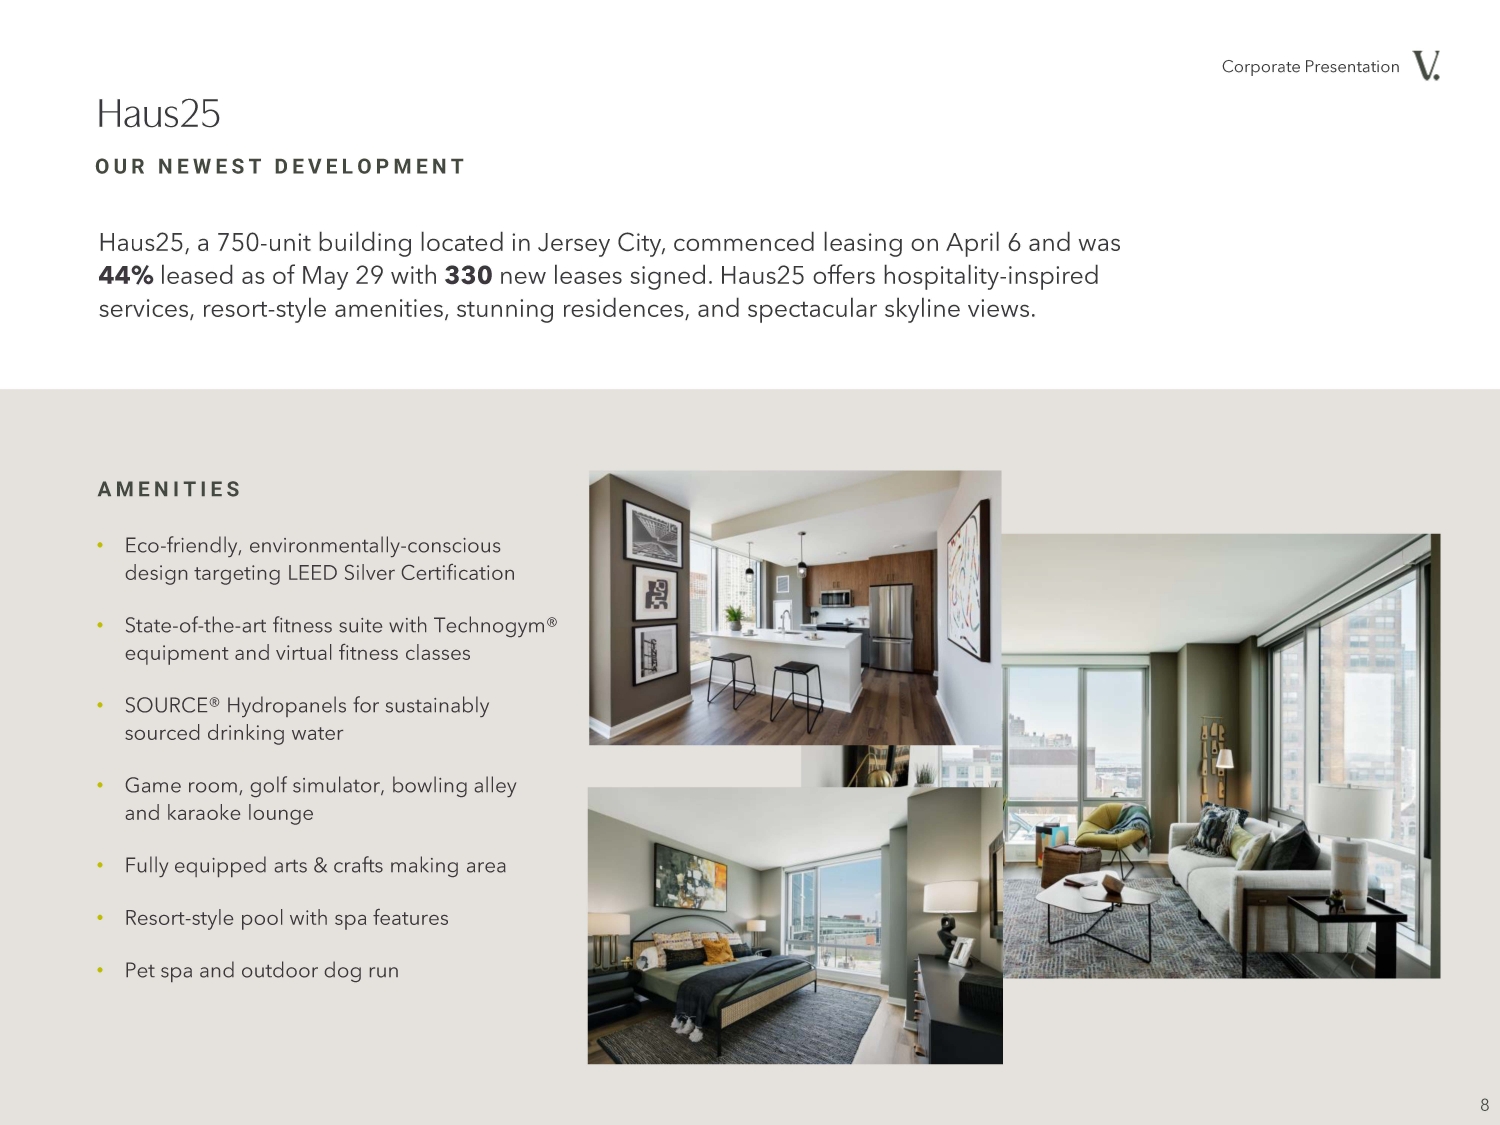
| Haus25, a 750-unit building located in Jersey City, commenced leasing on April 6 and was 44% leased as of May 29 with 330 new leases signed. Haus25 offers hospitality-inspired services, resort-style amenities, stunning residences, and spectacular skyline views. • Eco-friendly, environmentally-conscious design targeting LEED Silver Certification • State-of-the-art fitness suite with Technogym® equipment and virtual fitness classes • SOURCE® Hydropanels for sustainably sourced drinking water • Game room, golf simulator, bowling alley and karaoke lounge • Fully equipped arts & crafts making area • Resort-style pool with spa features • Pet spa and outdoor dog run OUR NEWEST DEVELOPMENT AMENITIES |
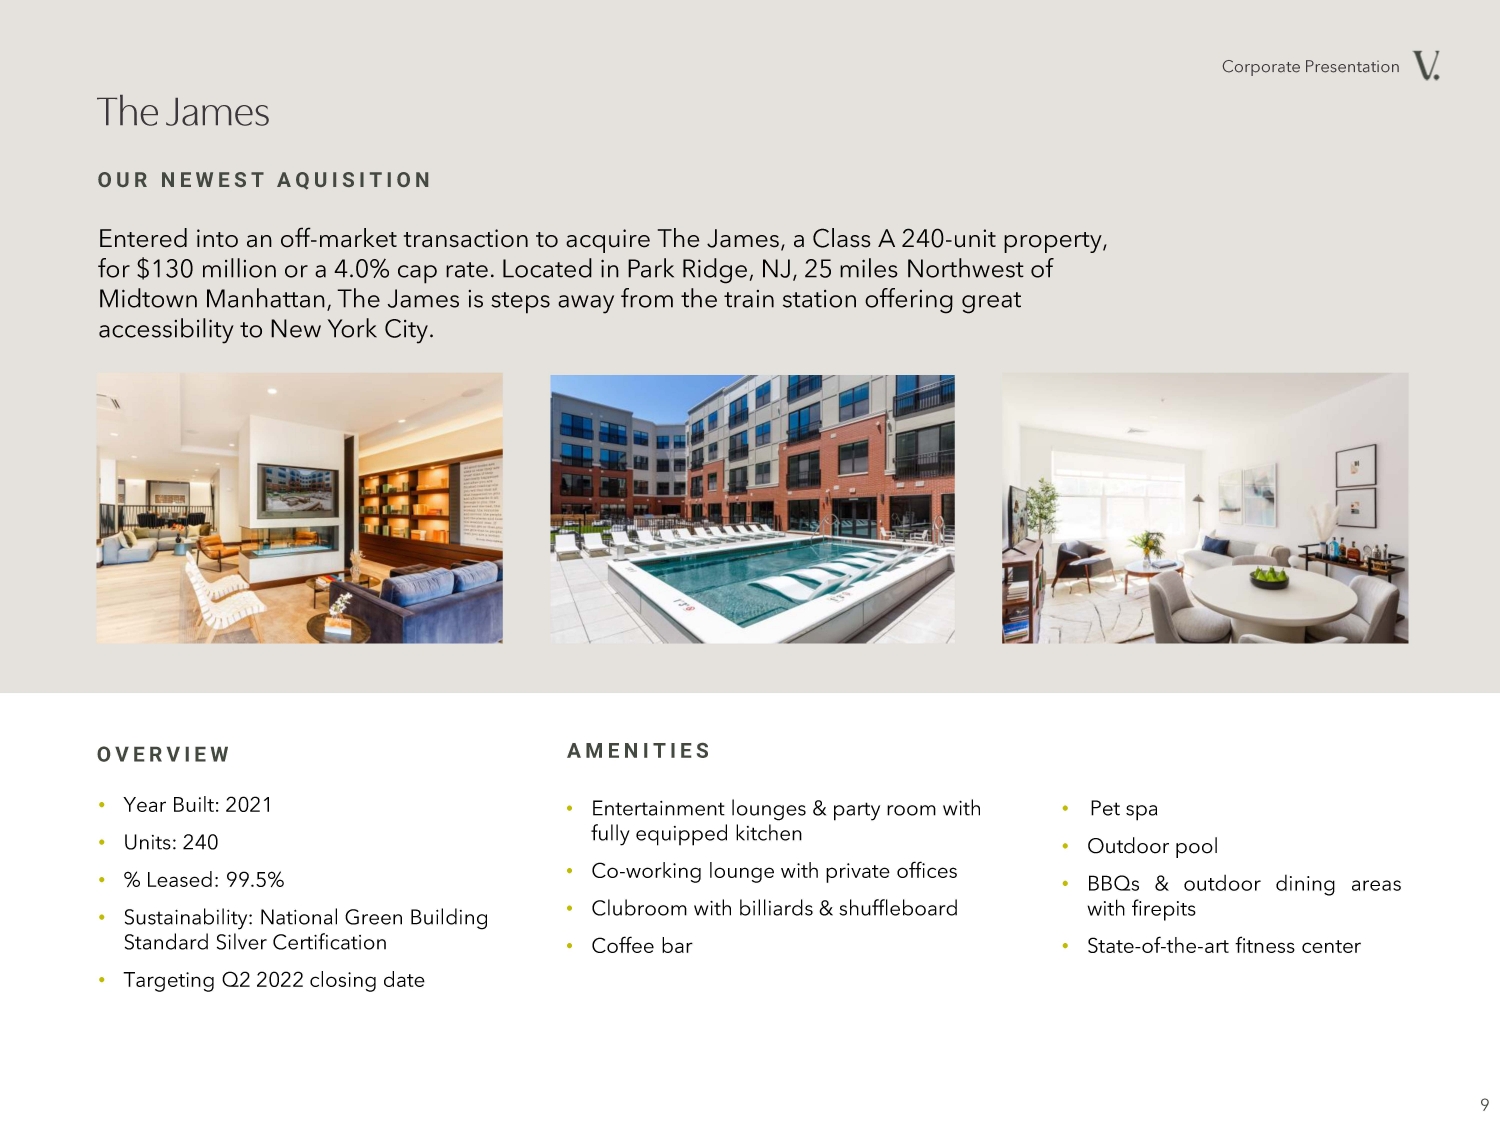
| • Year Built: 2021 • Units: 240 • % Leased: 99.5% • Sustainability: National Green Building Standard Silver Certification • Targeting Q2 2022 closing date • Entertainment lounges & party room with fully equipped kitchen • Co-working lounge with private offices • Clubroom with billiards & shuffleboard • Coffee bar AMENITIESOVERVIEW • Pet spa • Outdoor pool • BBQs & outdoor dining areas with firepits • State-of-the-art fitness center O U R N E W E S T A Q U I S I T I O N Entered into an off-market transaction to acquire The James, a Class A 240-unit property, for $130 million or a 4.0% cap rate. Located in Park Ridge, NJ, 25 miles Northwest of Midtown Manhattan, The James is steps away from the train station offering great accessibility to New York City. |
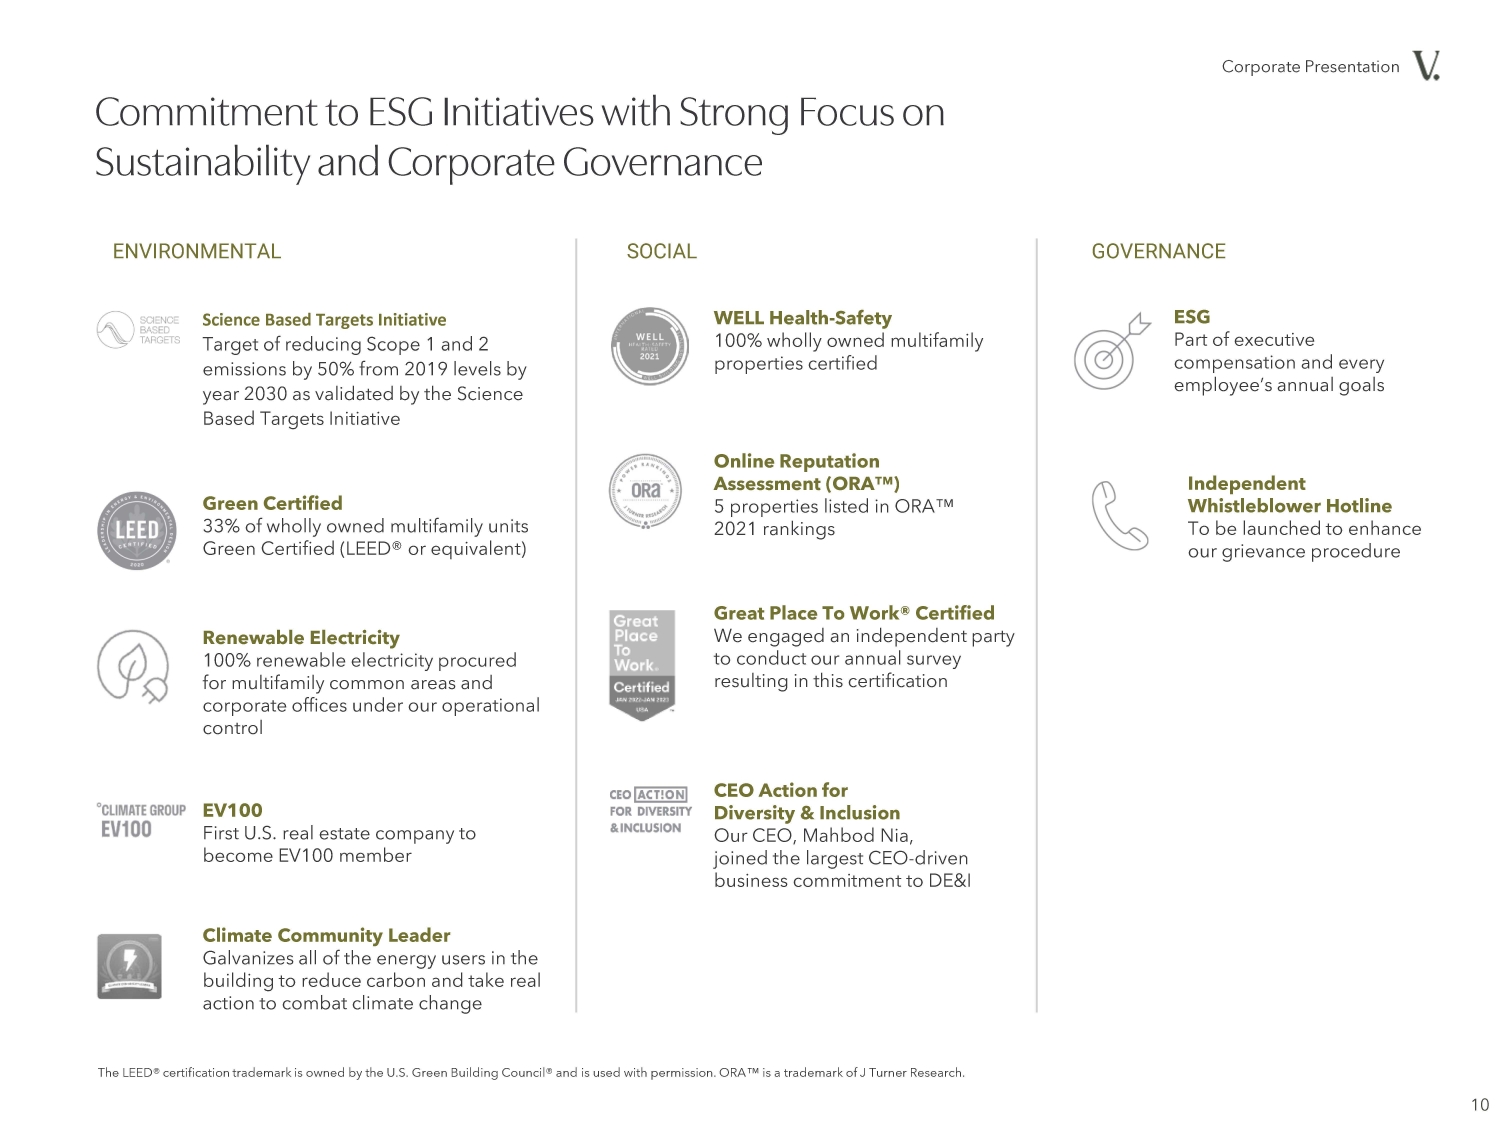
| ENVIRONMENTAL SOCIAL GOVERNANCE Science Based Targets Initiative Target of reducing Scope 1 and 2 emissions by 50% from 2019 levels by year 2030 as validated by the Science Based Targets Initiative Green Certified 33% of wholly owned multifamily units Green Certified (LEED® or equivalent) Renewable Electricity 100% renewable electricity procured for multifamily common areas and corporate offices under our operational control EV100 First U.S. real estate company to become EV100 member Climate Community Leader Galvanizes all of the energy users in the building to reduce carbon and take real action to combat climate change WELL Health-Safety 100% wholly owned multifamily properties certified Online Reputation Assessment (ORA™) 5 properties listed in ORA™ 2021 rankings Great Place To Work® Certified We engaged an independent party to conduct our annual survey resulting in this certification CEO Action for Diversity & Inclusion Our CEO, Mahbod Nia, joined the largest CEO-driven business commitment to DE&I ESG Part of executive compensation and every employee’s annual goals Independent Whistleblower Hotline To be launched to enhance our grievance procedure The LEED® certification trademark is owned by the U.S. Green Building Council® and is used with permission. ORA™ is a trademark of J Turner Research. 10 |
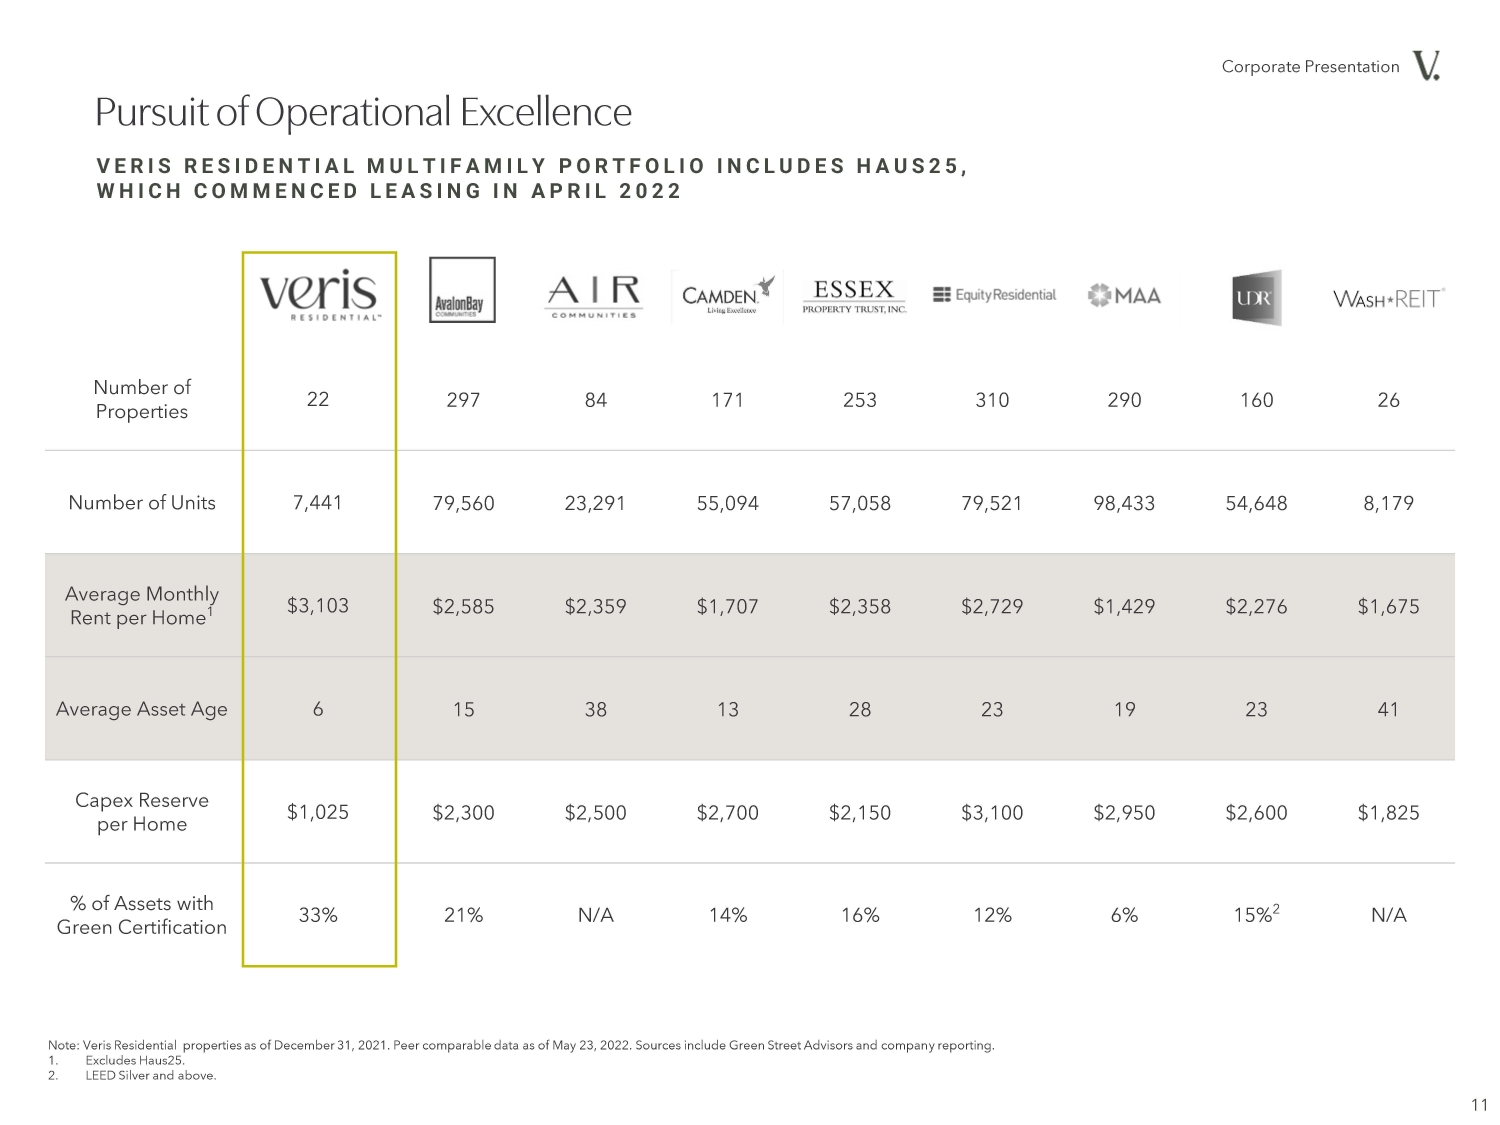
| Note: Veris Residential properties as of December 31, 2021. Peer comparable data as of May 23, 2022. Sources include Green Street Advisors and company reporting. 1. Excludes Haus25. 2. LEED Silver and above. Number of Properties 22 297 84 171 253 310 290 160 26 Number of Units 7,441 79,560 23,291 55,094 57,058 79,521 98,433 54,648 8,179 Average Monthly Rent per Home1 $3,103 $2,585 $2,359 $1,707 $2,358 $2,729 $1,429 $2,276 $1,675 Average Asset Age 6 15 38 13 28 23 19 23 41 Capex Reserve per Home $1,025 $2,300 $2,500 $2,700 $2,150 $3,100 $2,950 $2,600 $1,825 % of Assets with Green Certification 33% 21% N/A 14% 16% 12% 6% 15%2 N/A V E R I S RESIDENTIAL MULTIFAMILY PORTFOLIO INCLUDES HAUS25, WHICH COMMENCED LEASING IN APRIL 2022 |
|
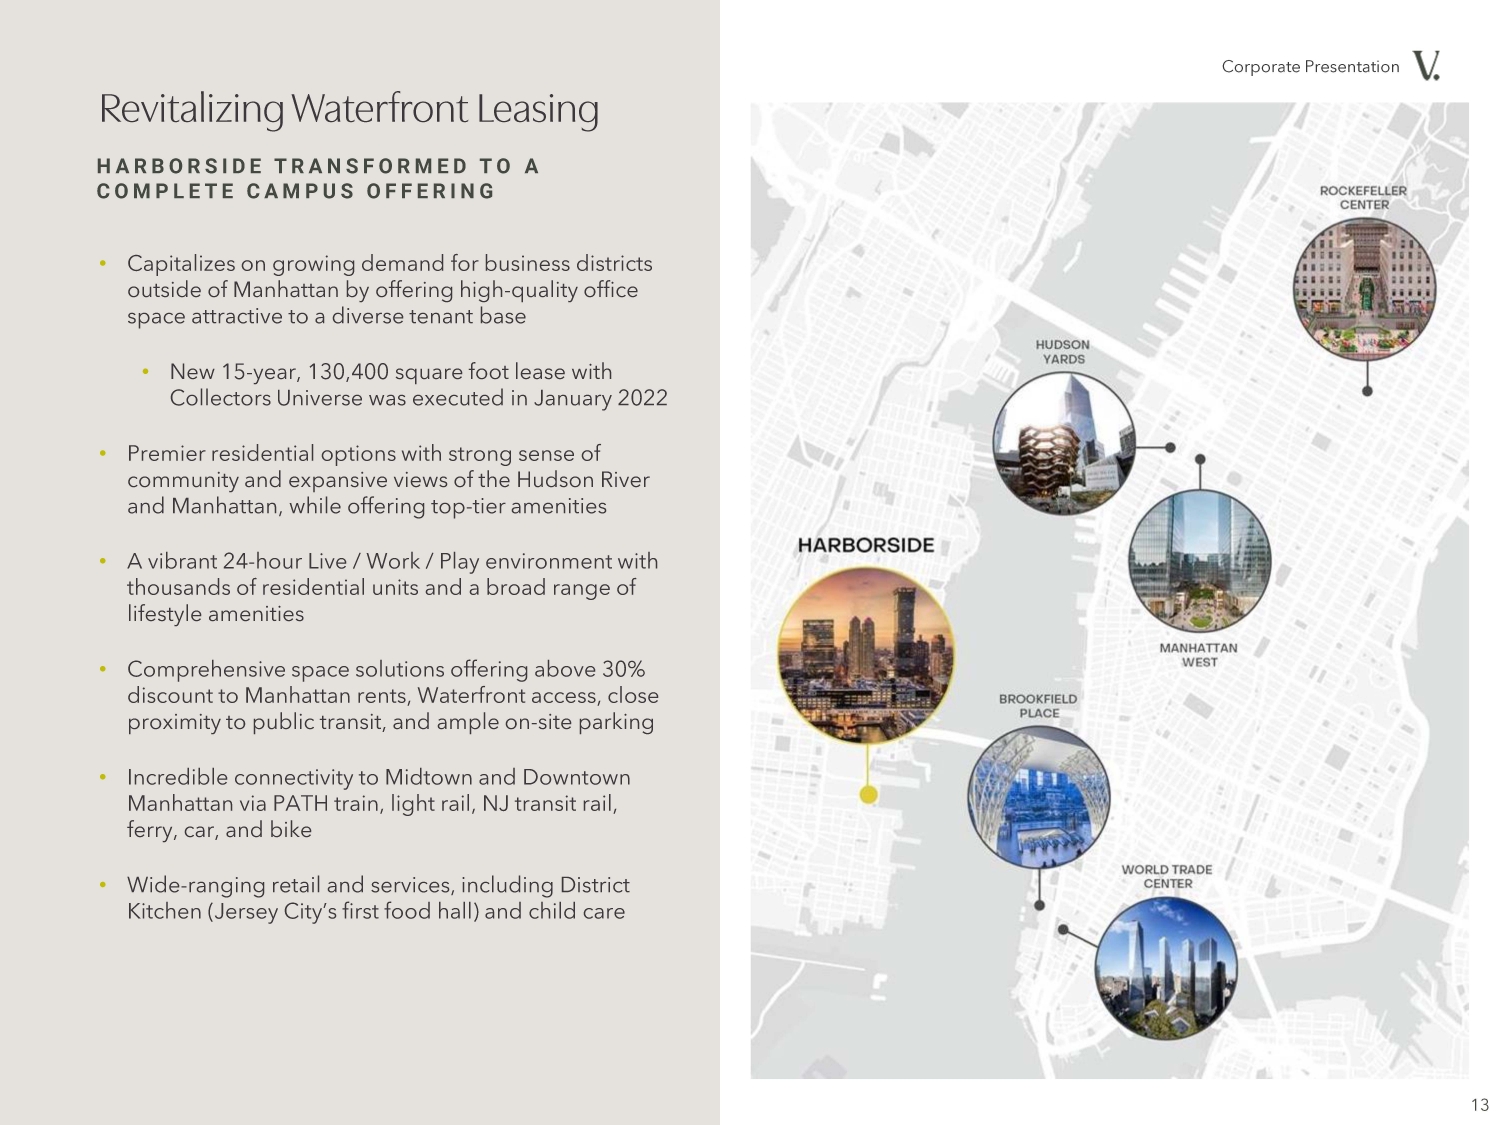
| • Capitalizes on growing demand for business districts outside of Manhattan by offering high-quality office space attractive to a diverse tenant base • New 15-year, 130,400 square foot lease with Collectors Universe was executed in January 2022 • Premier residential options with strong sense of community and expansive views of the Hudson River and Manhattan, while offering top-tier amenities • A vibrant 24-hour Live / Work / Play environment with thousands of residential units and a broad range of lifestyle amenities • Comprehensive space solutions offering above 30% discount to Manhattan rents, Waterfront access, close proximity to public transit, and ample on-site parking • Incredible connectivity to Midtown and Downtown Manhattan via PATH train, light rail, NJ transit rail, ferry, car, and bike • Wide-ranging retail and services, including District Kitchen (Jersey City’s first food hall) and child care HARBORSIDE TRANSFORMED TO A COMPLETE CAMPUS OFFERING |
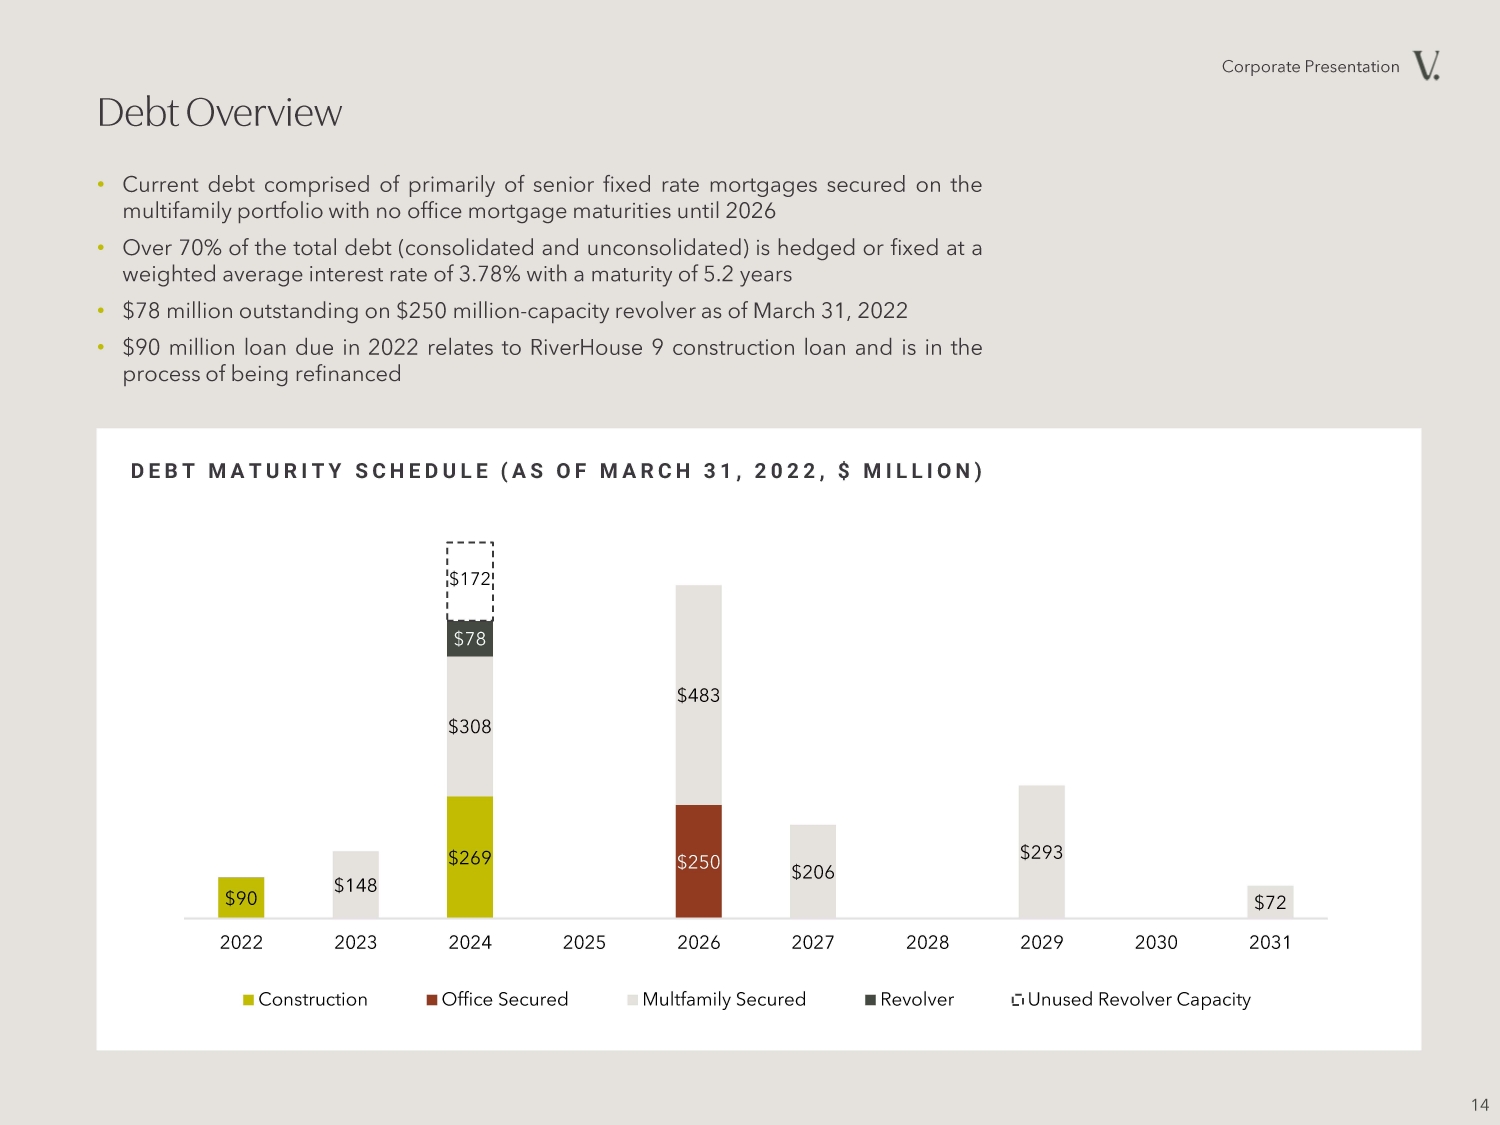
| • Current debt comprised of primarily of senior fixed rate mortgages secured on the multifamily portfolio with no office mortgage maturities until 2026 • Over 70% of the total debt (consolidated and unconsolidated) is hedged or fixed at a weighted average interest rate of 3.78% with a maturity of 5.2 years • $78 million outstanding on $250 million-capacity revolver as of March 31, 2022 • $90 million loan due in 2022 relates to RiverHouse 9 construction loan and is in the process of being refinanced DEBT MATURITY SCHEDULE (AS OF MARCH 31, 2022, $ MILLION) $90 $269 $250 $148 $308 $483 $206 $293 $72 $78 $172 2022 2023 2024 2025 2026 2027 2028 2029 2030 2031 Construction Office Secured Multfamily Secured Revolver Unused Revolver Capacity |
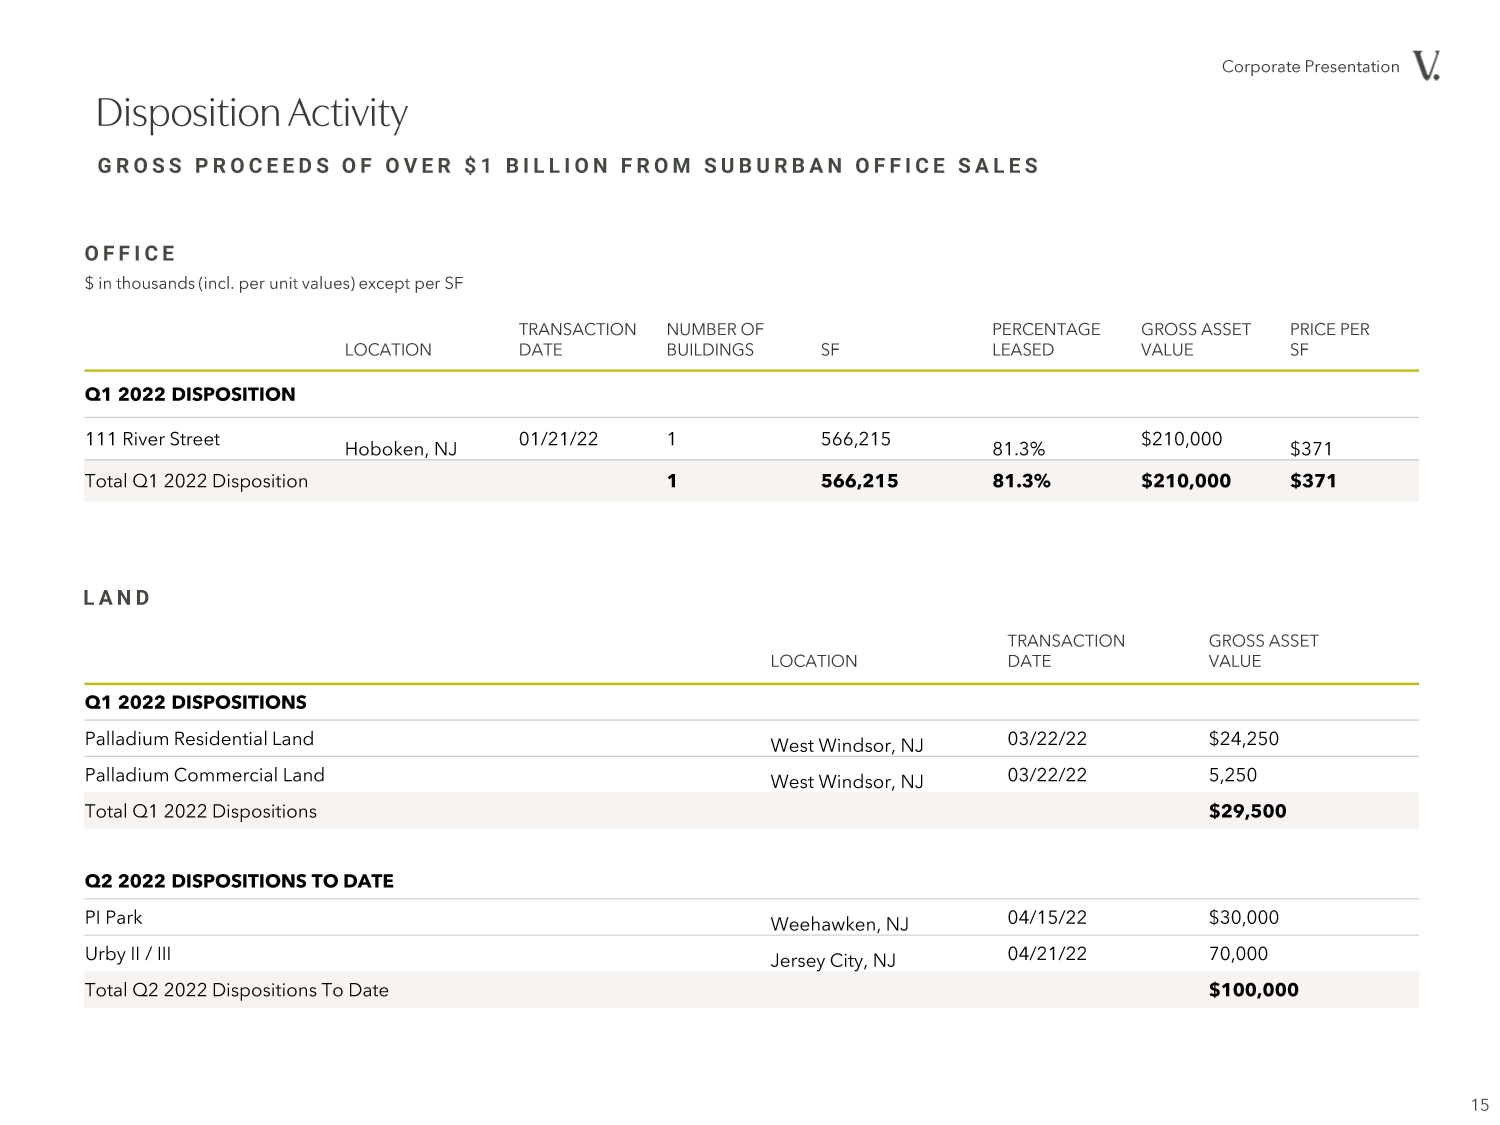
| TRANSACTION GROSS ASSET LOCATION DATE VALUE Q1 2022 DISPOSITIONS Palladium Residential Land West Windsor, NJ 03/22/22 $24,250 Palladium Commercial Land West Windsor, NJ 03/22/22 5,250 Total Q1 2022 Dispositions $29,500 Q2 2022 DISPOSITIONS TO DATE PI Park Weehawken, NJ 04/15/22 $30,000 Urby II / III Jersey City, NJ 04/21/22 70,000 Total Q2 2022 Dispositions To Date $100,000 TRANSACTION NUMBER OF PERCENTAGE GROSS ASSET PRICE PER LOCATION DATE BUILDINGS SF LEASED VALUE SF Q1 2022 DISPOSITION 111 River Street Hoboken, NJ 01/21/22 1 566,215 81.3% $210,000 $371 Total Q1 2022 Disposition 1 566,215 81.3% $210,000 $371 $ in thousands (incl. per unit values) except per SF GROSS PROCEEDS OF OVER $1 BILLION FROM SUBURBAN OFFICE SALES OFFICE LAND |
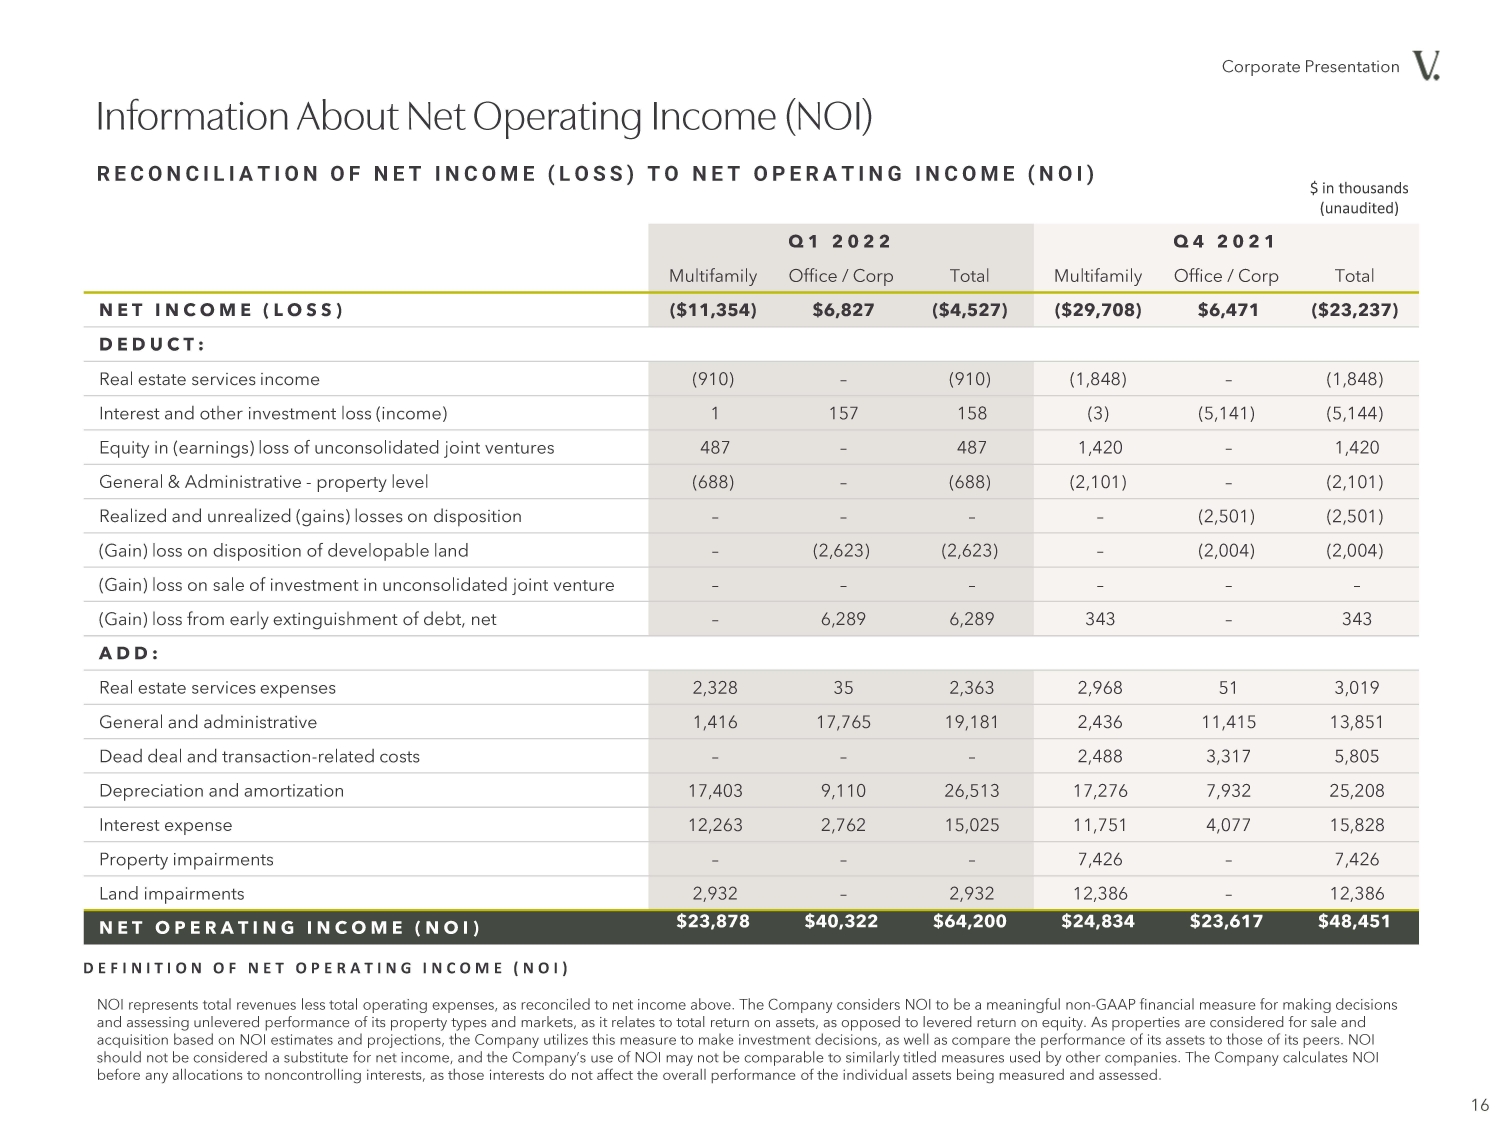
| DEFINITION OF NET OPERATING INCOME (NOI) $ in thousands (unaudited) Q 1 2 0 2 2 Q 4 2 0 2 1 Multifamily Office / Corp Total Multifamily Office / Corp Total NET INCOME (LOSS) ($11,354) $6,827 ($4,527) ($29,708) $6,471 ($23,237) DEDUCT: Real estate services income (910) –(910) (1,848) –(1,848) Interest and other investment loss (income) 1 157 158 (3) (5,141) (5,144) Equity in (earnings) loss of unconsolidated joint ventures 487 – 487 1,420 – 1,420 General & Administrative - property level (688) –(688) (2,101) –(2,101) Realized and unrealized (gains) losses on disposition ––––(2,501) (2,501) (Gain) loss on disposition of developable land –(2,623) (2,623) –(2,004) (2,004) (Gain) loss on sale of investment in unconsolidated joint venture –––––– (Gain) loss from early extinguishment of debt, net – 6,289 6,289 343 – 343 ADD: Real estate services expenses 2,328 35 2,363 2,968 51 3,019 General and administrative 1,416 17,765 19,181 2,436 11,415 13,851 Dead deal and transaction-related costs ––– 2,488 3,317 5,805 Depreciation and amortization 17,403 9,110 26,513 17,276 7,932 25,208 Interest expense 12,263 2,762 15,025 11,751 4,077 15,828 Property impairments ––– 7,426 – 7,426 Land impairments 2,932 – 2,932 12,386 – 12,386 NET OPERATING INCOME (NOI) $23,878 $40,322 $64,200 $24,834 $23,617 $48,451 RECONCILIATION OF NET INCOME (LOSS) TO NET OPERATING INCOME (NOI) |
| Corporate Presentation |
| VerisResidential.com |