
Exhibit 99.1
|
September 2020 Exhibit 99.1 |
 |
2 This Operating and Financial Data should be read in connection with our Quarterly Report on Form 10-Q for the quarter ended June 30, 2020. Statements made in this presentation may be forward-looking statements within the meaning of Section 21E of the Securities Exchange Act of 1934, as amended. Forward-looking statements can be identified by the use of words such as “may,” “will,” “plan,” “potential,” “projected,” “should,” “expect,” “anticipate,” “estimate,” “target,” “continue” or comparable terminology. Forward-looking statements are inherently subject to certain risks, trends and uncertainties, many of which we cannot predict with accuracy and some of which we might not even anticipate, and involve factors that may cause actual results to differ materially from those projected or suggested. Readers are cautioned not to place undue reliance on these forward-looking statements and are advised to consider the factors listed above together with the additional factors under the heading “Disclosure Regarding For ward-Looking Statements” and “Risk Factors” in our annual reports on Form 10-K, as may be supplemented or amended by our quarterly reports on Form 10-Q, which are incorporated herein by reference. We assume no obligation to update or supplement forward-looking statements that become untrue because of subsequent events, new information or otherwise. |
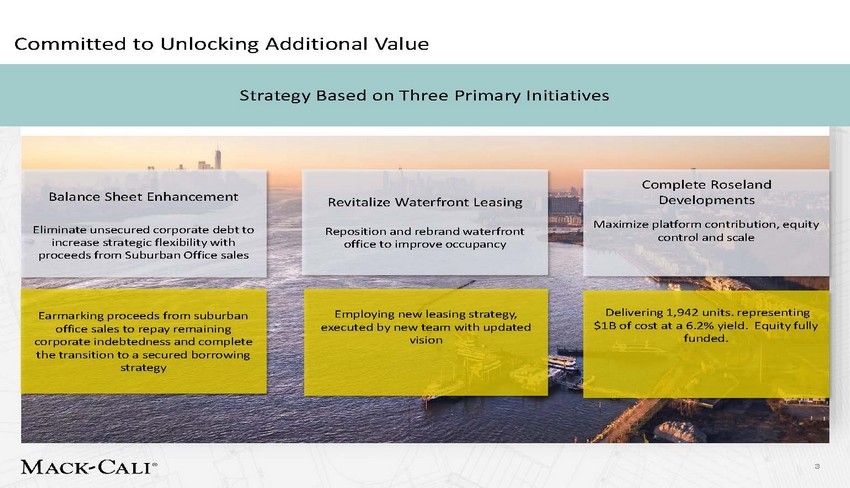 |
Committed to Unlocking Additional Value Strategy Based on Three Primary Initiatives Developments control and scale $1B of cost at a 6.2% yield. Equity fully 3 Balance Sheet Enhancement Eliminate unsecured corporate debt to increase strategic flexibility with proceeds from Suburban Office sales Complete Roseland Maximize platform contribution, equity Earmarking proceeds from suburban office sales to repay remaining corporate indebtedness and complete the transition to a secured borrowing strategy Delivering 1,942 units. representing funded. Employing new leasing strategy, executed by new team with updated vision Revitalize Waterfront Leasing Reposition and rebrand waterfront office to improve occupancy |
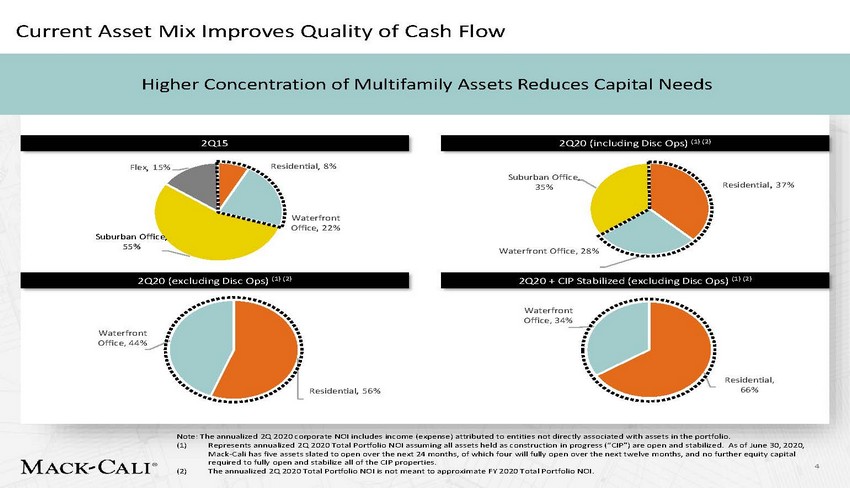 |
Current Asset Mix Improves Quality of Cash Flow Higher Concentration of Multifamily Assets Reduces Capital Needs Suburban Office, 35% Residential, 37% Waterfront Office, 28% Note: The annualized 2Q 2020 corporate NOI includes income (expense) attributed to entities not directly associated with assets in the portfolio. (1) Represents annualized 2Q 2020 Total Portfolio NOI assuming all assets held as construction in progress (“CIP”) are open and stabilized. As of June 30, 2020, Mack-Cali has five assets slated to open over the next 24 months, of which four will fully open over the next twelve months, and no further equity capital required to fully open and stabilize all of the CIP properties. The annualized 2Q 2020 Total Portfolio NOI is not meant to approximate FY 2020 Total Portfolio NOI. 4 (2) 2Q15 2Q20 (including Disc Ops) (1) (2) Flex, 15%Residential, 8% Waterfront Office, 22% Suburban Office, 55% 2Q20 (excluding Disc Ops) (1) (2) 2Q20 + CIP Stabilized (excluding Disc Ops) (1) (2) Waterfront Office, 34% Waterfront Office, 44% Residential, Residential, 56%66% |
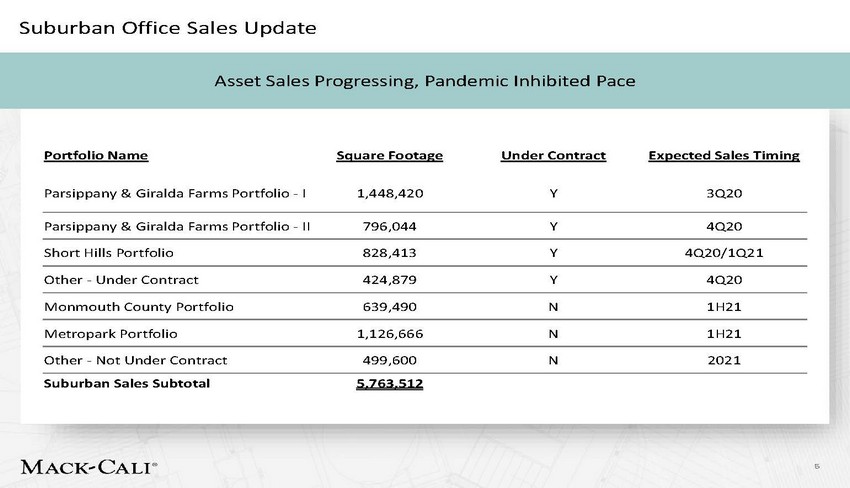 |
Suburban Office Sales Update Asset Sales Progressing, Pandemic Inhibited Pace 5 Portfolio NameSquare FootageUnder ContractExpected Sales Timing Parsippany & Giralda Farms Portfolio - I1,448,420Y3Q20 Parsippany & Giralda Farms Portfolio - II796,044Y4Q20 Short Hills Portfolio828,413Y4Q20/1Q21 Other - Under Contract424,879Y4Q20 Monmouth County Portfolio639,490N1H21 Metropark Portfolio1,126,666N1H21 Other - Not Under Contract499,600N2021 Suburban Sales Subtotal5,763,512 |
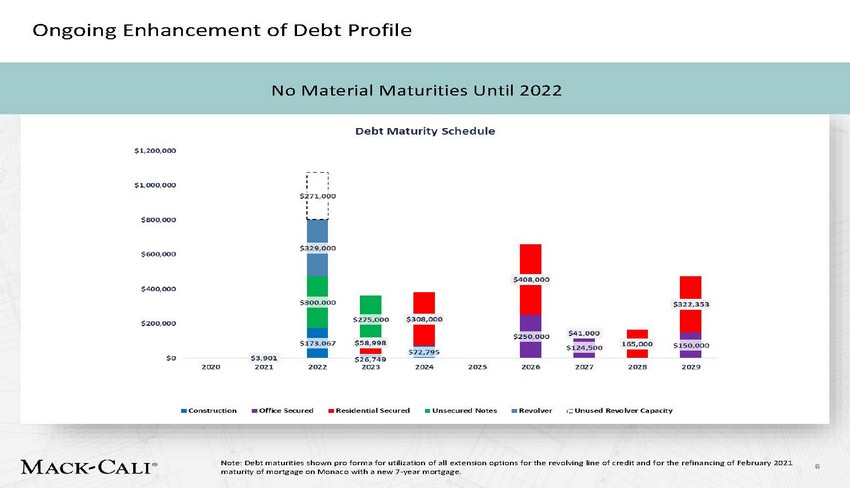 |
Ongoing Enhancement of Debt Profile No Material Maturities Until 2022 Note: Debt maturities shown pro forma for utilization of all extension options for the revolving line of credit and for the refinancing of February 2021 maturity of mortgage on Monaco with a new 7-year mortgage. 6 |
 |
Refreshed Vision and Strategy to Execute on Waterfront Office New Team, New Positioning • Hired integrated office and retail team from CBRE to execute strategy • Proactive targeting directed at existing New York City office users • Repositioning Harborside as a “Campus” • • • Large block opportunities, Proximity and variety of mass transit, Extensive amenities including essential retail, communal and private outdoor space • Selective build-out of office suites to allow for turn-key occupancy and provide marketing opportunity to drive the vision • Addition of Co-working / Flex Space to enhance flexibility for large tenants • Broad appeal to wide range of target industries – Tech, Financial Services, Life Science, Media, Education and Fashion 7 |
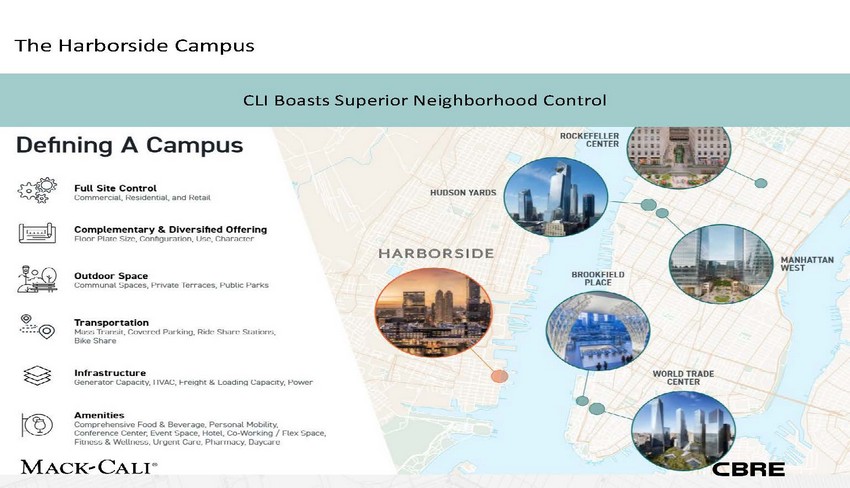 |
The Harborside Campus CLI Boasts Superior Neighborhood Control 8 |
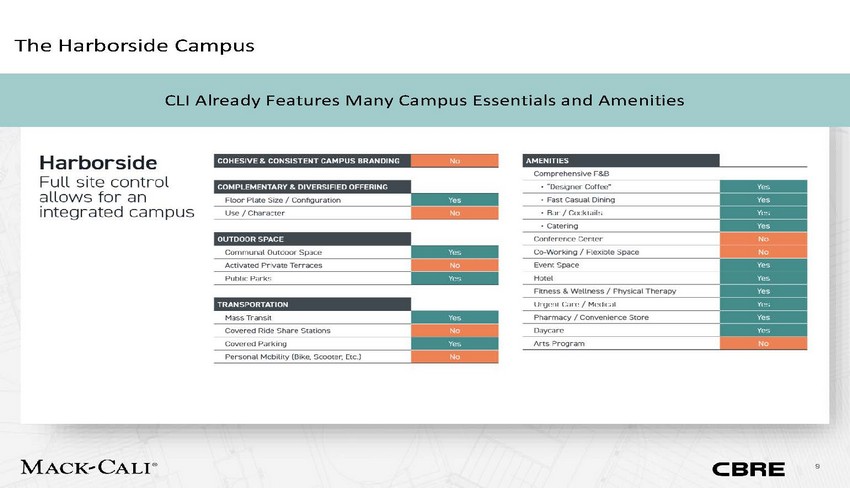 |
The Harborside Campus CLI Already Features Many Campus Essentials and Amenities 9 |
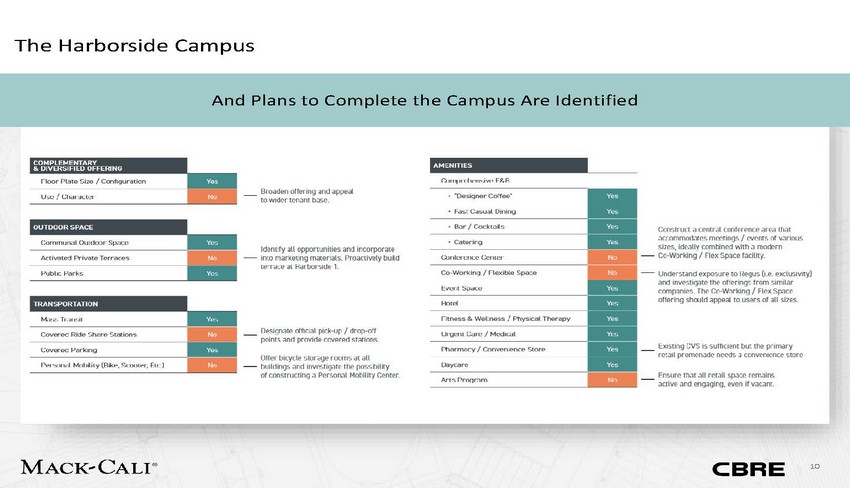 |
The Harborside Campus And Plans to Complete the Campus Are Identified 10 |
 |
The Harborside Campus Marketing Designed to Match the Campus Approach 11 |
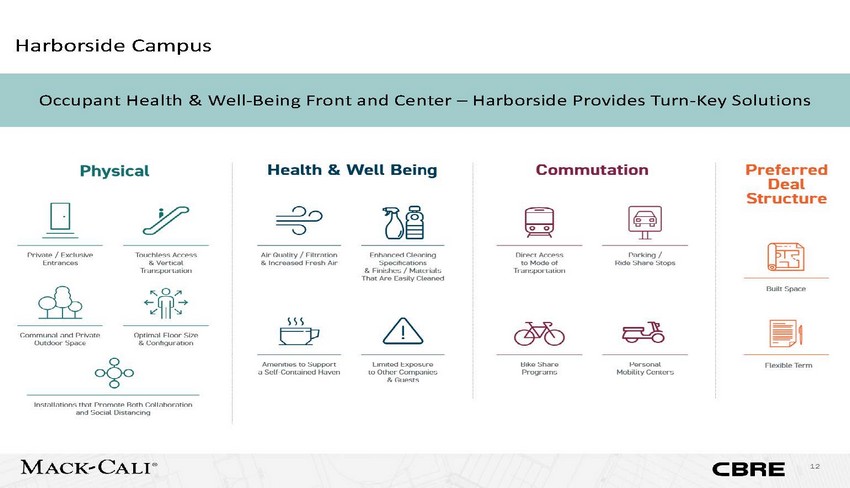 |
Harborside Campus Occupant Health & Well-Being Front and Center – Harborside Provides Turn-Key Solutions 12 |
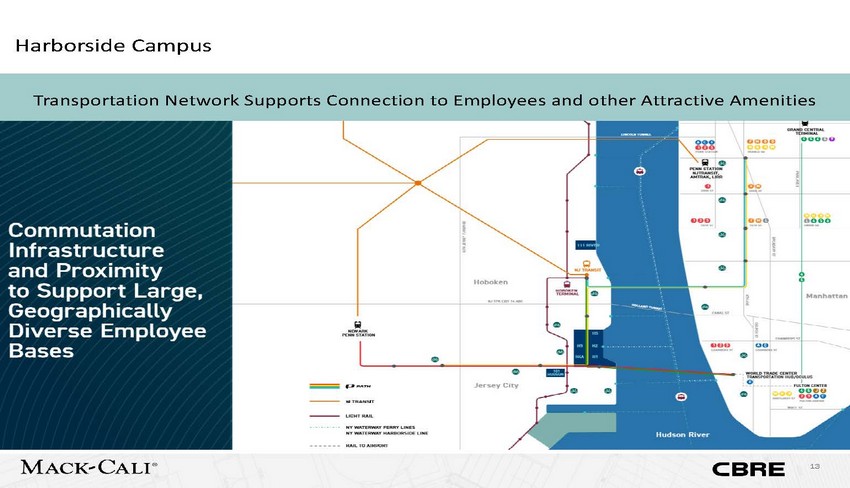 |
Harborside Campus Transportation Network Supports Connection to Employees and other Attractive Amenities 13 |
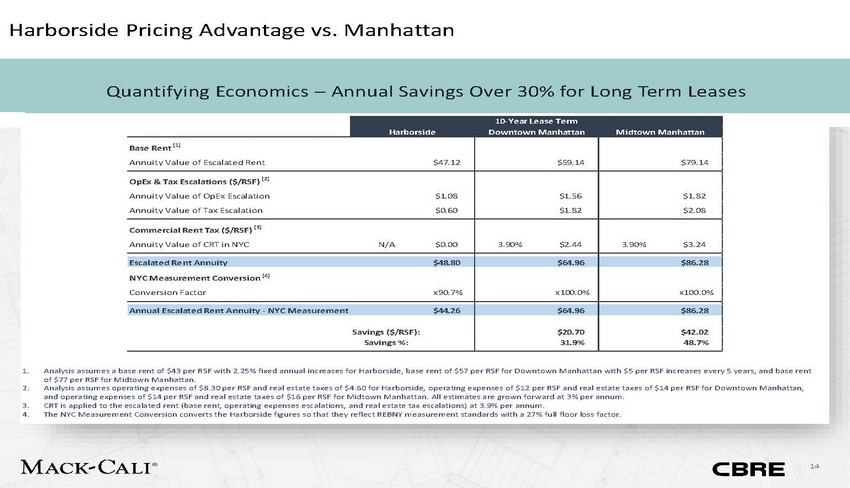 |
Harborside Pricing Advantage vs. Manhattan Quantifying Economics – Annual Savings Over 30% for Long Term Leases 14 1.Analysis assumes a base rent of $43 per RSF with 2.25% fixed annual increases for Harborside, base rent of $57 per RSF for Downtown Manhattan with $5 per RSF increases every 5 years, and base rent of $77 per RSF for Midtown Manhattan. 2.Analysis assumes operating expenses of $8.30 per RSF and real estate taxes of $4.60 for Harborside, operating expenses of $12 per RSF and real estate taxes of $14 per RSF for Downtown Manhattan, and operating expenses of $14 per RSF and real estate taxes of $16 per RSF for Midtown Manhattan. All estimates are grown forward at 3% per annum. 3.CRT is applied to the escalated rent (base rent, operating expenses escalations, and real estate tax escalations) at 3.9% per annum. 4.The NYC Measurement Conversion converts the Harborside figures so that they reflect REBNY measurement standards with a 27% full floor loss factor. 10-Year Lease Term Harborside Downtown Manhattan Midtown Manhattan Base Rent (1) Annuity Value of Escalated Rent $47.12 $59.14 $79.14 OpEx & Tax Escalations ($/RSF) (2) Annuity Value of OpEx Escalation $1.08 Annuity Value of Tax Escalation $0.60 $1.56 $1.82 $1.82 $2.08 Commercial Rent Tax ($/RSF) (3) Annuity Value of CRT in NYC N/A $0.00 3.90% $2.44 3.90% $3.24 Escalated Rent Annuity $48.80 $64.96 $86.28 NYC Measurement Conversion (4) Conversion Factor x90.7% x100.0% x100.0% Annual Escalated Rent Annuity - NYC Measurement $44.26 $64.96 $86.28 Savings ($/RSF): Savings %: $20.70 31.9% $42.02 48.7% |
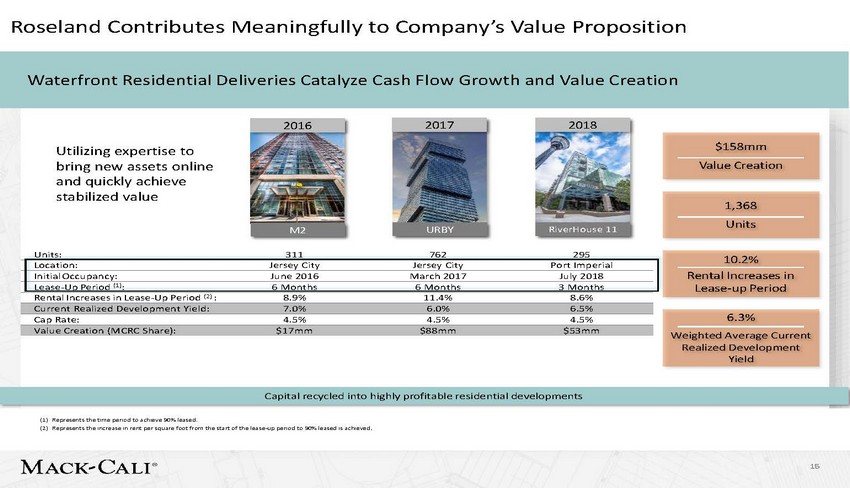 |
Roseland Contributes Meaningfully to Company’s Value Proposition Waterfront Residential Deliveries Catalyze Cash Flow Growth and Value Creation Capital recycled into highly profitable residential developments (1) Represents the time period to achieve 90% leased. (2) Represents the increase in rent per square foot from the start of the lease-up period to 90% leased is achieved. 15 Utilizing expertise to bring new assets online and quickly achieve stabilized value URBYRiverHouse 11 Units:311762295 Location:Jersey CityJersey CityPort Imperial Initial Occupancy:June 2016March 2017July 2018 Lease-Up Period (1): 6 Months6 Months3 Months Rental Increases in Lease-Up Period (2) :8.9%11.4%8.6% Current Realized Development Yield:7.0%6.0%6.5% Cap Rate:4.5%4.5%4.5% Value Creation (MCRC Share):$17mm$88mm$53mm 6.3% Weighted Average Current Realized Development Yield 10.2% Rental Increases in Lease-up Period M2 1,368 Units $158mm Value Creation 2018 2017 2016 |
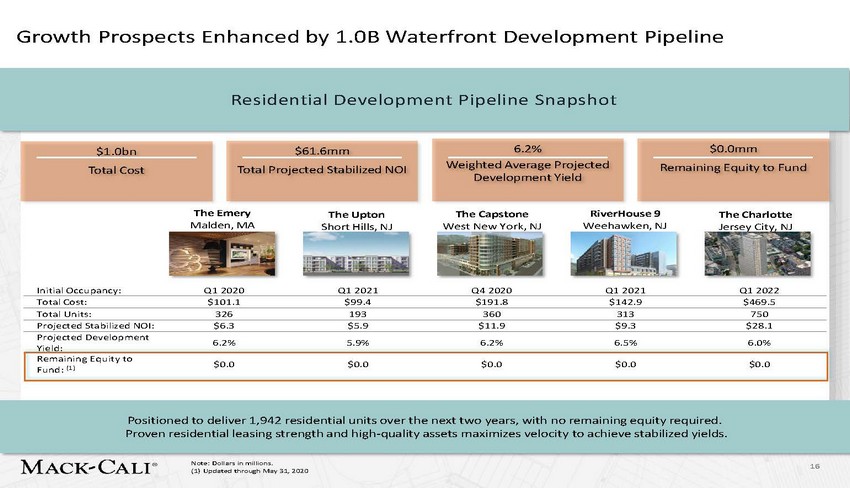 |
Growth Prospects Enhanced by 1.0B Waterfront Development Pipeline 6.2% 5.9% 6.2% 6.5% 6.0% Yield: $0.0 $0.0 $0.0 $0.0 $0.0 Fund: (1) Positioned to deliver 1,942 residential units over the next two years, with no remaining equity required. Proven residential leasing strength and high-quality assets maximizes velocity to achieve stabilized yields. Note: Dollars in millions. (1) Updated through May 31, 2020 16 $0.0mm Remaining Equity to Fund $1.0bn Total Cost The EmeryThe UptonThe CapstoneRiverHouse 9The Charlotte Malden, MAShort Hills, NJWest New York, NJWeehawken, NJJersey City, NJ Initial Occupancy:Q1 2020Q1 2021Q4 2020Q1 2021Q1 2022 Total Cost:$101.1$99.4$191.8$142.9$469.5 Total Units:326193360313750 Projected Stabilized NOI:$6.3$5.9$11.9$9.3$28.1 Projected Development Remaining Equity to $61.6mm Total Projected Stabilized NOI 6.2% Weighted Average Projected Development Yield Residential Development Pipeline Snapshot |
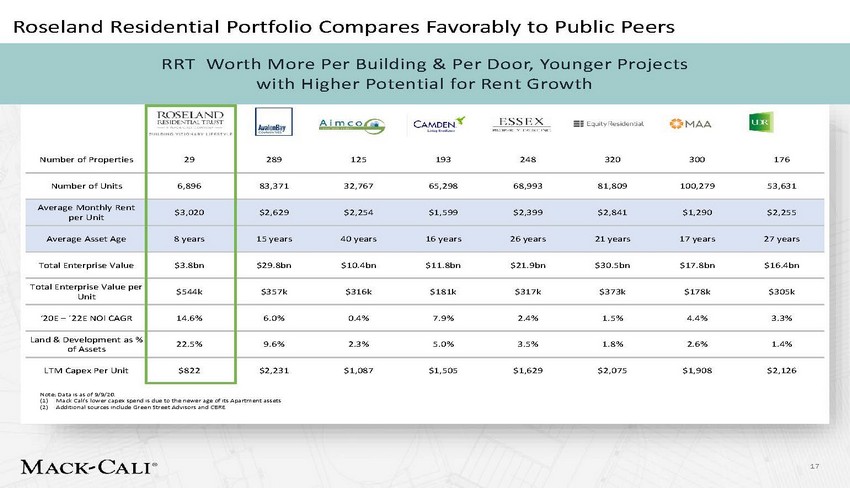 |
Roseland Residential Portfolio Compares Favorably to Public Peers RRT Worth More Per Building & Per Door, Younger Projects with Higher Potential for Rent Growth 17 Number of Properties 29 289125193248320300176 Number of Units 6,896 83,37132,76765,29868,99381,809100,27953,631 Average Monthly Rent per Unit $3,020 $2,629$2,254$1,599$2,399$2,841$1,290$2,255 Average Asset Age 8 years 15 years40 years16 years26 years21 years17 years27 years Total Enterprise Value $3.8bn $29.8bn$10.4bn$11.8bn$21.9bn$30.5bn$17.8bn$16.4bn Total Enterprise Value per Unit $544k $357k$316k$181k$317k$373k$178k$305k ‘20E – ’22E NOI CAGR 14.6% 6.0%0.4%7.9%2.4%1.5%4.4%3.3% Land & Development as % of Assets 22.5% 9.6%2.3%5.0%3.5%1.8%2.6%1.4% LTM Capex Per Unit $822 $2,231$1,087$1,505$1,629$2,075$1,908$2,126 Note: Data is as of 9/9/20. (1) Mack Cali’s lower capex spend is due to the newer age of its Apartment assets (2) Additional sources include Green Street Advisors and CBRE |
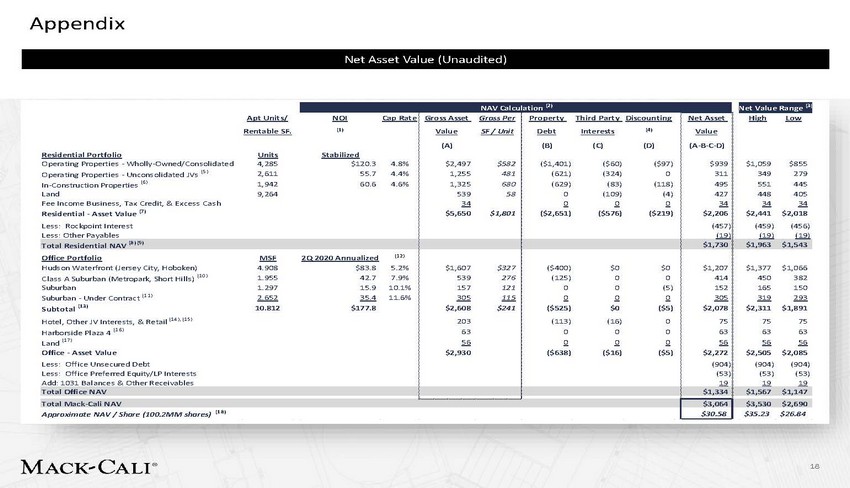 |
Appendix 18 NAV Calculation (2) Net Value Range (3 Apt Units/ NOI Cap Rate Rentable SF. (1) Residential Portfolio Units Stabilized Operating Properties - Wholly-Owned/Consolidated 4,285 $120.3 4.8% Operating Properties - Unconsolidated JVs (5) 2,611 55.7 4.4% In-Construction Properties (6) 1,942 60.6 4.6% Land 9,264 Fee Income Business, Tax Credit, & Excess Cash Residential - Asset Value (7) Less: Rockpoint Interest Less: Other Payables Gross Asset Gross Per Value SF / Unit (A) $2,497 $582 1,255 481 1,325 680 539 58 34 $5,650 $1,801 Property Third Party Discounting Debt Interests (4) (B) (C) (D) ($1,401) ($60) ($97) (621) (324) 0 (629) (83) (118) 0 (109) (4) 0 0 0 ($2,651) ($576) ($219) Net Asset Value (A-B-C-D) $939 311 495 427 34 $2,206 (457) (19) High Low $1,059 $855 349 279 551 445 448 405 34 34 $2,441 $2,018 (459) (456) (19) (19) Total Residential NAV (8) (9) $1,730 $1,963 $1,543 Office Portfolio MSF 2Q 2020 Annualized (12) Hudson Waterfront (Jersey City, Hoboken) 4.908 $83.8 5.2% Class A Suburban (Metropark, Short Hills) (10) 1.955 42.7 7.9% Suburban 1.297 15.9 10.1% Suburban - Under Contract (11) 2.652 35.4 11.6% Subtotal (13) 10.812 $177.8 Hotel, Other JV Interests, & Retail (14), (15) Harborside Plaza 4 (16) Land (17) Office - Asset Value Less: Office Unsecured Debt Less: Office Preferred Equity/LP Interests Add: 1031 Balances & Other Receivables $1,607 $327 539 276 157 121 305 115 $2,608 $241 203 63 56 $2,930 ($400) $0 $0 (125) 0 0 0 0 (5) 0 0 0 ($525) $0 ($5) (113) (16) 0 0 0 0 0 0 0 ($638) ($16) ($5) $1,207 414 152 305 $2,078 75 63 56 $2,272 (904) (53) 19 $1,377 $1,066 450 382 165 150 319 293 $2,311 $1,891 75 75 63 63 56 56 $2,505 $2,085 (904) (904) (53) (53) 19 19 Total Office NAV $1,334 $1,567 $1,147 Total Mack-Cali NAV $3,064 $3,530 $2,690 Approximate NAV / Share (100.2MM shares) (18) $30.58 $35.23 $26.84 Net Asset Value (Unaudited) |
 |
Appendix 1) Reflects 2Q 2020 Annualized Cash NOI for office assets; projected 12-month NOI for stabilized residential assets and the projected stabilized NOI for residential assets in-construction and lease-up. See Information About Net Operating Income on page 44. NAV is generally arrived at by calculating the estimated gross asset values for each of the Company’s real estate properties, investments and other significant assets and interests, and then deducting from such amounts the corresponding net debt and third parties’ interests in the assets. Gross asset values for stabilized operating multi-family real estate properties are calculated using the direct capitalization method by dividing projected net operating income for the next one-year period by an estimated market capitalization rate for each property. Gross asset values for operating office properties are presented by dividing projected net operating income for the next one-year period by an estimated year one imputed capitalization rate for each property. See Footnote 4 for a more detailed description of the methodology used by management to estimate gross asset values for its operating office properties. Management projects net operating income that it expects to receive for future periods from a combination of in-place lease contracts, prospective renewals of expiring leases and prospective lease-up of vacant space. Market capitalization rates are estimated for each property based on its asset class and geographic location and are based on information from recent property sale transactions as well as from publicly available information regarding unrelated third-party property transactions. The value range is determined by adding or subtracting 0.50% to the year 1 cap rate for office properties and 0.25% to the year 1 cap rate for residential properties. Property cash flows have been reduced by credit loss reserves, leasing and base building capital expenditures, including Harborside renovations. The Waterfront valuation includes $45 million in capital yet to be spent for the Harborside renovations. Additionally, the analysis includes approximately $65 million in base building capital during the first three years of the five-year discounted cash flow. The capital is allocated to physical building improvements and is estimated $43 million at the Waterfront, $16 million in the Class A Suburban, and $6 million in the Suburban portfolio’s, respectively. Furthermore, the analysis includes $10 million in leasing capital budgeted in eac h of the Waterfront, Class A Suburban and Suburban portfolios. This is in addition to the tenant improvements, leasing commissions and capital reserves budgeted. Represents the discount to stabilized value applied to assets that have not yet achieved their respective Projected Stabilized NOI due to construction, lease-up or renovation. See Information About Net Operating Income on page 41. Joint venture investments are generally valued by: applying a capitalization rate to projected NOI for the joint venture’s asset (which is similar to the process for valuing those assets wholly owned by the Company, as described above and previously), and deducting any joint venture level debt and any value allocable to joint venture partners’ interests. Includes Roseland’s last residential subordinate interest (Metropolitan at 40 Park) and commercial subordinate interests. Joint venture investments are generally valued by: applying a capitalization rate to projected NOI for the joint venture’s asset (which is similar to the process for valuing those assets wholly owned by the Company, as described above and previously), and deducting any joint venture level debt and any value allocable to joint venture partners’ interests. Includes Roseland’s last residential subordinate interest (Metropolitan at 40 Park) and commercial subordinate interests. The valuation approach for assets in-construction or lease-up are similar to that applied to assets undergoing repositioning/repurposing, as described above. After applying an estimated capitalization rate, currently ranging from 4.5% to 5.25%, to a projected stabilized net operating income, estimated to total approximately $46.6 million upon completion of the construction or lease-up activities, the Company deducts any estimated future costs totaling $565.9 million required to complete construction of the asset to arrive at an estimated value attributable to the asset. The Company then discounts the capitalized value back based on the projected number of periods to reach stabilization. The discount rate applied, currently ranging from 7% to 9.75%, is determined based on a risk assessment of the development activities and comparable target returns in the marketplace. The Company then adds back the discounted projected interim cash flows expected to be generated during the projected lease-up period to reach stabilization. The residential valuation analysis totals to a Roseland NAV of $2,206,000,000, with the company’s share of this NAV of $1,730,000,000 (“MCRC Share”). This latter amount represents the company's share of Roseland NAV, net of the $457,000,000 attributable to Rockpoint's noncontrolling interest. PLEASE NOTE: The Company’s Net Asset Value estimates at June 30, 2020 contained herein were produced based on conditions for the Company and its market and industry under normalized circumstances, exclusive of the uncertainties described below as a result of the worldwide COVID-19 pandemic. The recent outbreak of COVID-19 worldwide has significantly slowed global economic activity and caused significant volatility in financial markets. As such, there is currently significant uncertainty around the breadth and duration of business disruptions related to COVID-19, as well as its impact on the U.S. economy. The current economic environment can and will be significantly adversely affected by many factors beyond our control. The extent to which COVID-19 impacts our Net Asset Value estimates currently and into the future will depend on developments going forward, many of which are highly uncertain and cannot be predicted. As such, as a result of the magnitude of such uncertainties under the current climate, the Company has made the decision to provide its NAV estimates at June 30, 2020 under more normalized conditions to provide its investors with a more useful measure at this time. 2) 3) 4) 5) 6) 7) 8) 19 Notes: Net Asset Value (Unaudited) |
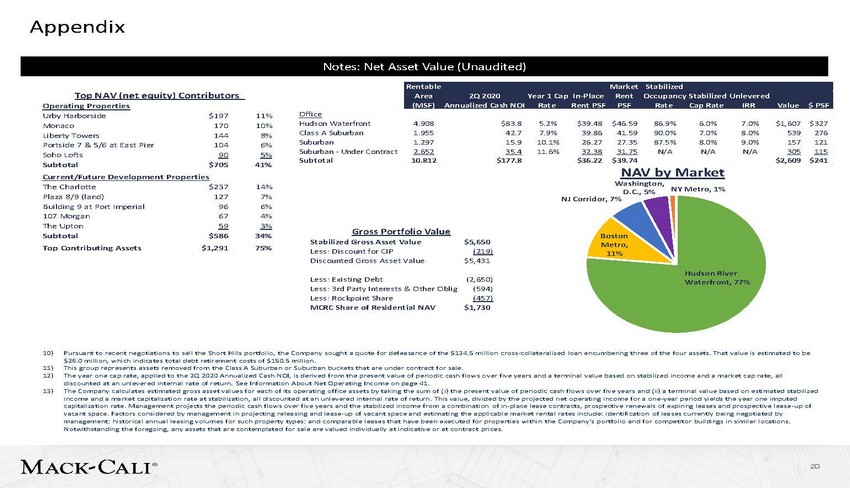 |
Appendix Top NAV (net equity) Contributors Operating Properties Office Hudson Waterfront Class A Suburban Suburban Suburban - Under Contract Subtotal Urby Harborside Monaco Liberty Towers Portside 7 & 5/6 at East Pier Soho Lofts Subtotal $197 170 144 104 90 $705 11% 10% 8% 6% 5% 41% 4.908 1.955 1.297 2.652 10.812 $83.8 42.7 15.9 35.4 $177.8 5.2% 7.9% 10.1% 11.6% $39.48 39.86 26.27 32.38 $36.22 $46.59 41.59 27.35 31.75 $39.74 86.9% 90.0% 87.5% N/A 6.0% 7.0% 8.0% N/A 7.0% 8.0% 9.0% N/A $1,607 539 157 305 $2,609 $327 276 121 115 $241 NAV by Market Current/Future Development Properties Washington, The Charlotte Plaza 8/9 (land) Building 9 at Port Imperial 107 Morgan The Upton Subtotal Top Contributing Assets $237 127 96 67 59 $586 $1,291 14% 7% 6% 4% 3% 34% 75% NY Metro, 1% D.C., 5% NJ Corridor, 7% Gross Portfolio Value Boston Metro, 11% Stabilized Gross Asset Value Less: Discount for CIP Discounted Gross Asset Value $5,650 (219) $5,431 Hudson River Waterfront, 77% Less: Existing Debt Less: 3rd Party Interests & Other Oblig Less: Rockpoint Share MCRC Share of Residential NAV (2,650) (594) (457) $1,730 10) Pursuant to recent negotiations to sell the Short Hills portfolio, the Company sought a quote for defeasance of the $124.5 mi llion cross-collateralized loan encumbering three of the four assets. That value is estimated to be $26.0 million, which indicates total debt retirement costs of $150.5 million. This group represents assets removed from the Class A Suburban or Suburban buckets that are under contract for sale. The year one cap rate, applied to the 2Q 2020 Annualized Cash NOI, is derived from the present value of periodic cash flows o ver five years and a terminal value based on stabilized income and a market cap rate, all discounted at an unlevered internal rate of return. See Information About Net Operating Income on page 41. The Company calculates estimated gross asset values for each of its operating office assets by taking the sum of ( i) the present value of periodic cash flows over five years and (ii) a terminal value based on estimated stabilized income and a market capitalization rate at stabilization, all discounted at an unlevered internal rate of return. This value, divided by the projected net operating income for a one-year period yields the year one imputed capitalization rate. Management projects the periodic cash flows over five years and the stabilized income from a combination of in-place lease contracts, prospective renewals of expiring leases and prospective lease-up of vacant space. Factors considered by management in projecting releasing and lease-up of vacant space and estimating the applicable market rental rates include: identification of leases currently being negotiated by management; historical annual leasing volumes for such property types; and comparable leases that have been executed for prop erties within the Company’s portfolio and for competitor buildings in similar locations. Notwithstanding the foregoing, any assets that are contemplated for sale are valued individually at indicative or at contract prices. 11) 12) 13) 20 Rentable Market Stabilized Area 2Q 2020 Year 1 Cap In-Place Rent Occupancy Stabilized Unlevered (MSF) Annualized Cash NOI Rate Rent PSF PSF Rate Cap Rate IRR Value $ PSF Notes: Net Asset Value (Unaudited) |
 |
Appendix 14) See Information About Net Operating Income on page 44. Valuations for properties planned for or undergoing a repositioning or repurposing utilize a projected stabilized net operating income for the asset upon completion of the repositioning/repurposing activities. After applying an estimated capitalization rate to a projected stabilized net operating income, the capitalized value is next discounted back based on the projected number of periods to re-stabilize the asset. The discount rate applied is determined based on a risk assessment of the repositioning/repurposing activities and comparable target returns in the marketplace, and further validated by outside market sources, when available for that market. Additionally, adjustments are made to the estimated value by deducting any estimated future costs necessary to complete the planned activities, as well as adding back the discounted projected interim operating cash flows expected to be generated by the property until re-stabilization has been achieved. Includes the Company's ownership interests in the Hyatt Regency Jersey City and two office joint venture properties. The Company updated its valuation method of the Harborside Plaza 4 land to reflect an $80K per unit value for 792 residential units. The value of land is based on a combination of recent or pending transactions for land parcels within our relevant markets and unrelated third parties, and sometimes may utilize land appraisals for certain markets, if available for other purposes, such as for transaction financing. Further, we consider what a land parcel’s value would need to be when combined with all other development costs to yield what we believe to be an appropriate target rate of return for a development project. The per apartment unit or per square foot office space values are derived by dividing the aggregate land value by the number of potential apartment units or square feet of office space the land can accommodate. The number of potential units or square feet of office space a land parcel can accommodate is most commonly governed by either in-place governmental approvals or density regulations set forth by existing zoning guidelines. The decrease in the approximate NAV per share of $2.35 from March 31, 2020 to June 30, 2020 is due primarily to internal re-assessment of market lease assumptions relating to the office portfolio. 15) 16) 17) 18) Information About Net Asset Value (NAV) Overall, NAV is arrived at by calculating the estimated gross asset values for each of their real estate properties, investments and other significant assets and interests, and then deducting from such amounts the corresponding net debt and third parties’ interests in the assets. Gross asset values for the operating real estate properties are calculated using the direct capitalization method by dividing projected net operating income for a one-year period by an estimated current capitalization rate for each property. For each operating property, management projects net operating income that it expects to receive for future periods from a combination of in-place lease contracts, prospective renewals of expiring leases and prospective lease-up of vacant space. Factors considered by management in projecting releasing and lease-up of vacant space and estimating the applicable market rental rates include: identification of leases currently being negotiated by management; historical annual leasing volumes for such property types; and comparable leases that have been executed for properties within the Registrants’ portfolio and for competitor buildings in similar locations. A capitalization rate is estimated for each property based on its asset class and geographic location. Estimates of capitalization rates are based on information from recent property sale transactions as well as from publicly available information regarding unrelated third-party property transactions. The use of NAV as a measure of value is subject to certain inherent limitations. The assessment of the estimated NAV of a particular property is subjective in that it involves estimates and assumptions and can be calculated using various acceptable methods. The Company’s methods of determining NAV may differ from the methods used by other companies. Accordingly, the Company’s estimated NAV may not be comparable to measures used by other companies. As with any valuation methodology, the methodologies utilized by the Company in estimating NAV are based upon a number of estimates, assumptions, judgments or opinions that may or may not prove to be correct. Capitalization rates obtained from publicly available sources also are critical to the NAV calculation and are subject to the sources selected and variability of market conditions at the time. Investors in the Company are cautioned that NAV does not represent (i) the amount at which the Company’s securities would trade at a national securities exchange, (ii) the amount that a security holder would obtain if he or she tried to sell his or her securities, (iii) the amount that a security holder would receive if the Company liquidated its assets and distributed the proceeds after paying all of their expenses and liabilities or (iv) the book value of the Company’s real estate, which is generally based on the amortized cost of the property, subject to certain adjustments. 21 Notes: Net Asset Value (Unaudited) |