Exhibit 99.1
. MackCali Realty Corporation Supplemental Operating and Financial Data 2Q 2020

Ta ble of Contents Company Highlights Page 4 6 7 11 21 25 26 Company Overview Key Financial Metrics Net Asset Value Financial Schedules Debt Statistics Unconsolidated Joint Ventures Transaction Activity Multifamily Portfolio Operating Schedules Financial Statements 28 32 Office Portfolio Property Listing Operating Schedules 35 36 This Supplemental Operating and Financial Data should be read in connection with the company’s second quarter 2020 earnings press release (included as Exhibit 99.2 of the company’s Current Report on Form 8K, filed on August 3, 2020) as certain disclosures, definitions and reconciliations in such announcement have not been included in this Supplemental Operating and Financial Data. RiverHouse 9 Weehawken, NJ (InConstruction) The Charlotte Jersey City, NJ (InConstruction) Harborside 2 & 3 Jersey City, NJ 2Q 2020 2
Company Highlights 2Q 20203
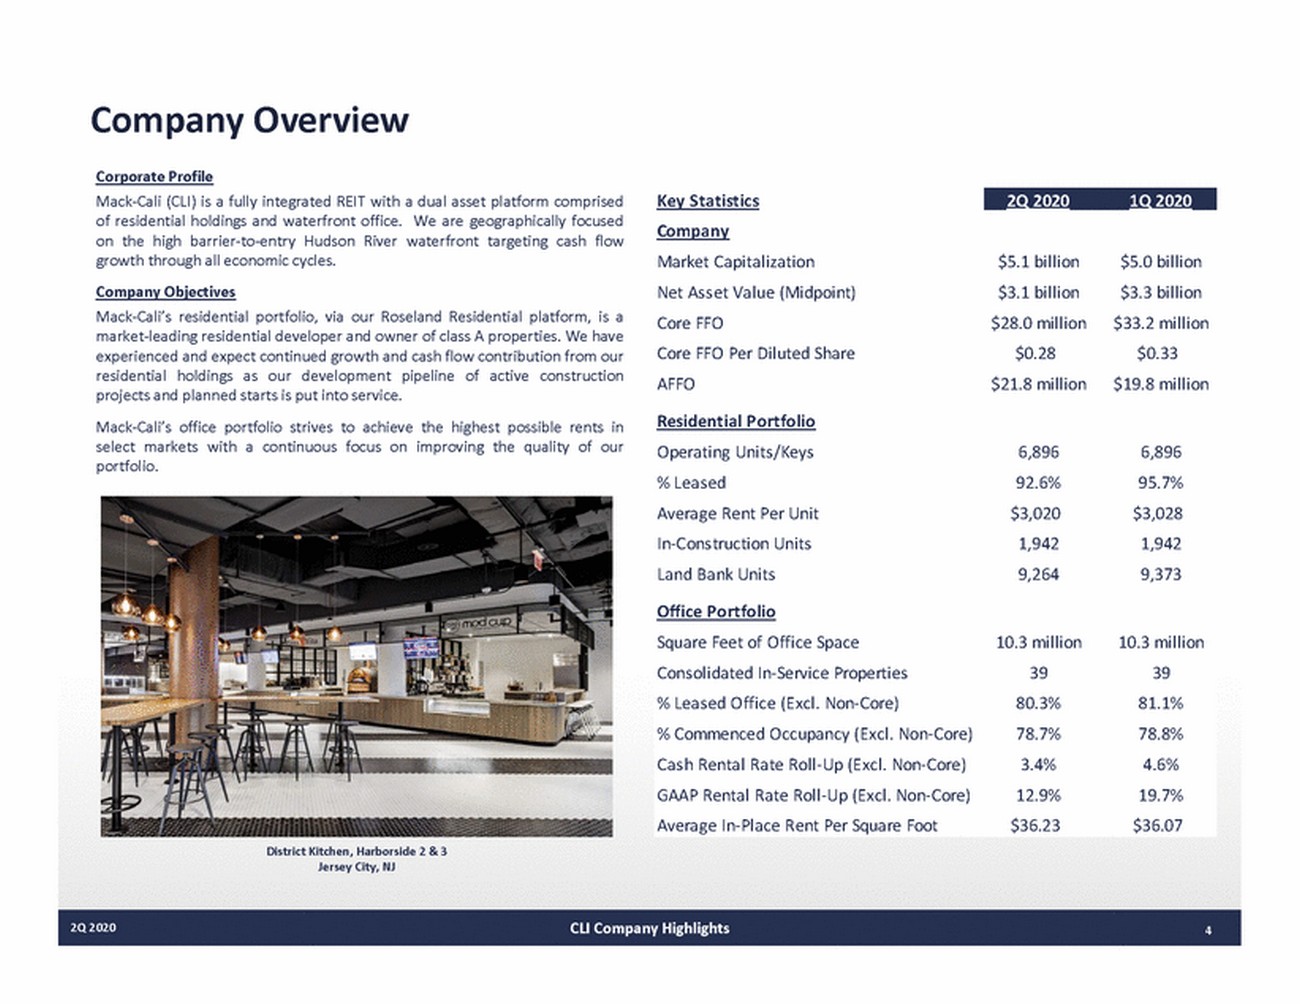
Company Overview Corporate Profile Key Statistics MackCali (CLI) is a fully integrated REIT with a dual asset platform comprised of residential holdings and waterfront office. We are geographically focused Co mpany on the high barriertoentry Hudson growth through all economic cycles. Company Objectives River waterfront targeting cash flow Market Capitalization Net Asset Value (Midpoint) Core FFO Core FFO Per Diluted Share AFFO $5.1 billion $3.1 billion $28.0 million $0.28 $21.8 million $5.0 billion $3.3 billion $33.2 million $0.33 $19.8 million MackCali’s residential portfolio, via our Roseland Residential platform, is a marketleading residential developer and owner of class A properties. We have experienced and expect continued growth and cash flow contribution from our residential holdings as our development pipeline of active construction projects and planned starts is put into service. MackCali’s office portfolio strives to achieve the highest possible rents in Residential Portfolio select markets portfolio. with a continuous focus on improving the quality of our Operating Units/Keys % Leased Average Rent Per Unit InConstruction Units Land Bank Units Office Portfolio 6,896 92.6% $3,020 1,942 9,264 6,896 95.7% $3,028 1,942 9,373 Square Feet of Office Space Consolidated InService Properties % Leased Office (Excl. NonCore) % Commenced Occupancy (Excl. NonCore) Cash Rental Rate RollUp (Excl. NonCore) GAAP Rental Rate RollUp (Excl. NonCore) Average InPlace Rent Per Square Foot 10.3 million 39 80.3% 78.7% 3.4% 12.9% $36.23 10.3 million 39 81.1% 78.8% 4.6% 19.7% $36.07 District Kitchen, Harborside 2 & 3 Jersey City, NJ 2Q 2020CLI Company Highlights4 2Q 20201Q 2020
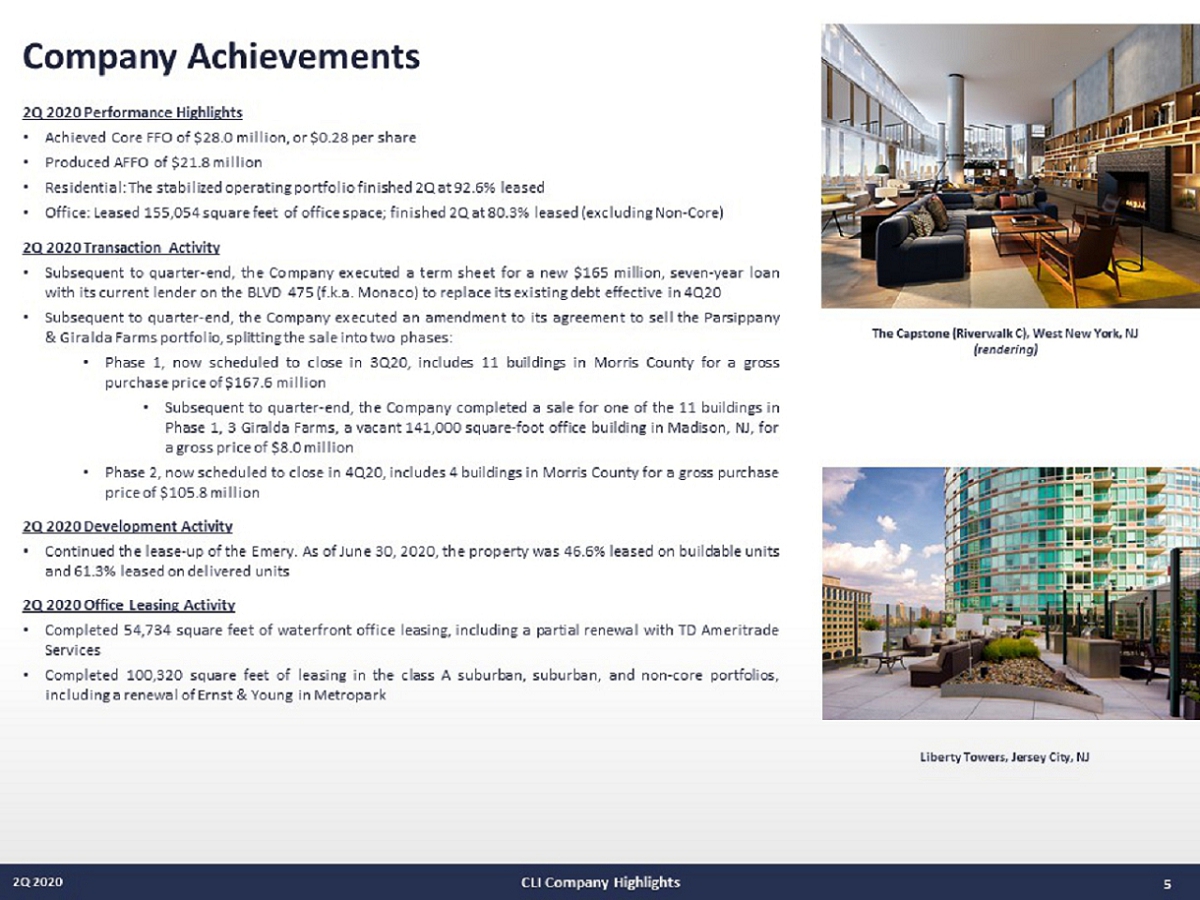
Company Achievements 2Q 2020 Performance Highlights • • • • Achieved Core FFO of $27.7 million, or $0.28 per share Produced AFFO of $21.6 million Residential: The stabilized operating portfolio finished 2Q at 92.6% leased Office: Leased 155,054 square feet of office space; finished 2Q at 80.3% leased (excluding NonCore) 2Q 2020 Transaction Activity •Subsequent to quarterend, the Company executed a term sheet for a new $165 million, sevenyear loan with its current lender on the BLVD 475 (f.k.a. Monaco) to replace its existing debt effective in 4Q20 •Subsequent to quarterend, the Company executed an amendment to its agreement to sell the Parsippany & Giralda Farms portfolio, splitting the sale into two phases: •Phase 1, now scheduled to close in 3Q20, includes 11 buildings in Morris County for a gross purchase price of $167.6 million •Subsequent to quarterend, the Company completed a sale for one of the 11 buildings in Phase 1, 3 Giralda Farms, a vacant 141,000 squarefoot office building in Madison, NJ, for a gross price of $8.0 million •Phase 2, now scheduled to close in 4Q20, includes 4 buildings in Morris County for a gross purchase price of $105.8 million 2Q 2020 Development Activity The Capstone (Riverwalk C), West New York, NJ (rendering) •Continued the leaseup of the Emery. As of June 30, 2020, the property was 46.6% leased on buildable units and 61.3% leased on delivered units 2Q 2020 Office Leasing Activity •Completed 54,734 square feet of waterfront office leasing, including a partial renewal with TD Ameritrade Services •Completed 100,870 square feet of leasing in the class A suburban, suburban, and noncore portfolios, including a renewal of Ernst & Young in Metropark Liberty Towers, Jersey City, NJ 2Q 2020CLI Company Highlights5
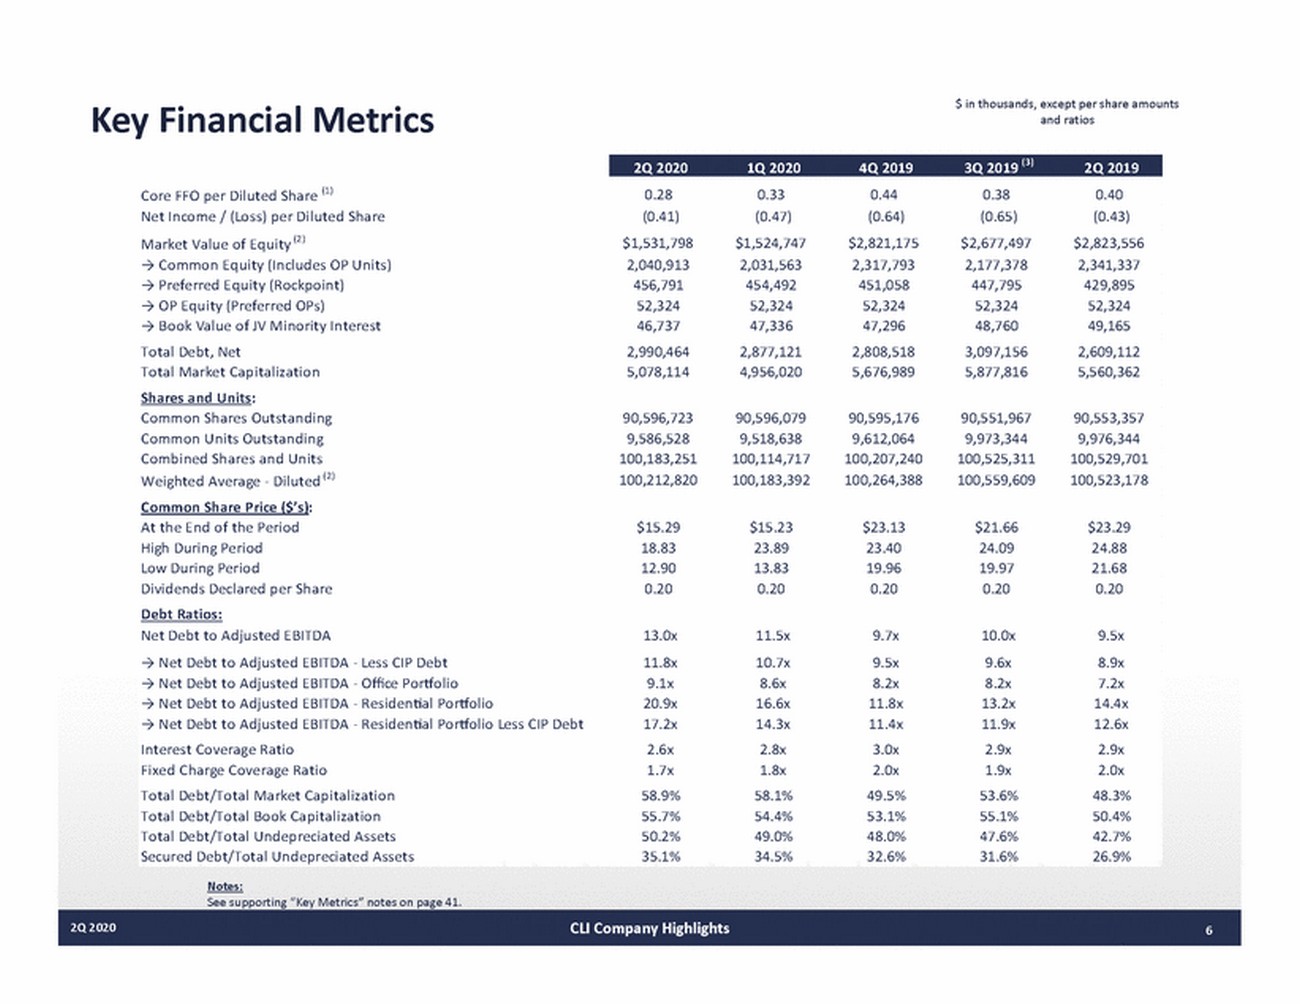
$ in thousands, except per share amounts and ratios Key Financial Metrics Core FFO per Diluted Share (1) Net Income / (Loss) per Diluted Share Market Value of Equity (2) Common Equity (Includes OP Units) Preferred Equity (Rockpoint) OP Equity (Preferred OPs) Book Value of JV Minority Interest Total Debt, Net Total Market Capitalization Shares and Units: 0.28 (0.41) $1,531,798 2,040,913 456,791 52,324 46,737 2,990,464 5,078,114 0.33 (0.47) $1,524,747 2,031,563 454,492 52,324 47,336 2,877,121 4,956,020 0.44 (0.64) $2,821,175 2,317,793 451,058 52,324 47,296 2,808,518 5,676,989 0.38 (0.65) $2,677,497 2,177,378 447,795 52,324 48,760 3,097,156 5,877,816 0.40 (0.43) $2,823,556 2,341,337 429,895 52,324 49,165 2,609,112 5,560,362 Common Shares Outstanding Common Units Outstanding Combined Shares and Units Weighted Average Diluted (2) Common Share Price ($’s): 90,596,723 9,586,528 100,183,251 100,212,820 90,596,079 9,518,638 100,114,717 100,183,392 90,595,176 9,612,064 100,207,240 100,264,388 90,551,967 9,973,344 100,525,311 100,559,609 90,553,357 9,976,344 100,529,701 100,523,178 At the End of the Period High During Period Low During Period Dividends Declared per Share Debt Ratios: $15.29 18.83 12.90 0.20 $15.23 23.89 13.83 0.20 $23.13 23.40 19.96 0.20 $21.66 24.09 19.97 0.20 $23.29 24.88 21.68 0.20 Net Debt to Adjusted EBITDA Net Debt to Adjusted EBITDA Less CIP Debt Net Debt to Adjusted EBITDA Oce Porolio Net Debt to Adjusted EBITDA Residenal Porolio Net Debt to Adjusted EBITDA Residenal Porolio Less CIP Debt Interest Coverage Ratio Fixed Charge Coverage Ratio Total Debt/Total Market Capitalization Total Debt/Total Book Capitalization Total Debt/Total Undepreciated Assets Secured Debt/Total Undepreciated Assets Notes: See supporting “Key Metrics” notes on page 41. 13.0x 11.8x 9.1x 20.9x 17.2x 2.6x 1.7x 58.9% 55.7% 50.2% 35.1% 11.5x 10.7x 8.6x 16.6x 14.3x 2.8x 1.8x 58.1% 54.4% 49.0% 34.5% 9.7x 9.5x 8.2x 11.8x 11.4x 3.0x 2.0x 49.5% 53.1% 48.0% 32.6% 10.0x 9.6x 8.2x 13.2x 11.9x 2.9x 1.9x 53.6% 55.1% 47.6% 31.6% 9.5x 8.9x 7.2x 14.4x 12.6x 2.9x 2.0x 48.3% 50.4% 42.7% 26.9% 2Q 2020CLI Company Highlights6 2Q 20201Q 20204Q 20193Q 2019 (3) 2Q 2019
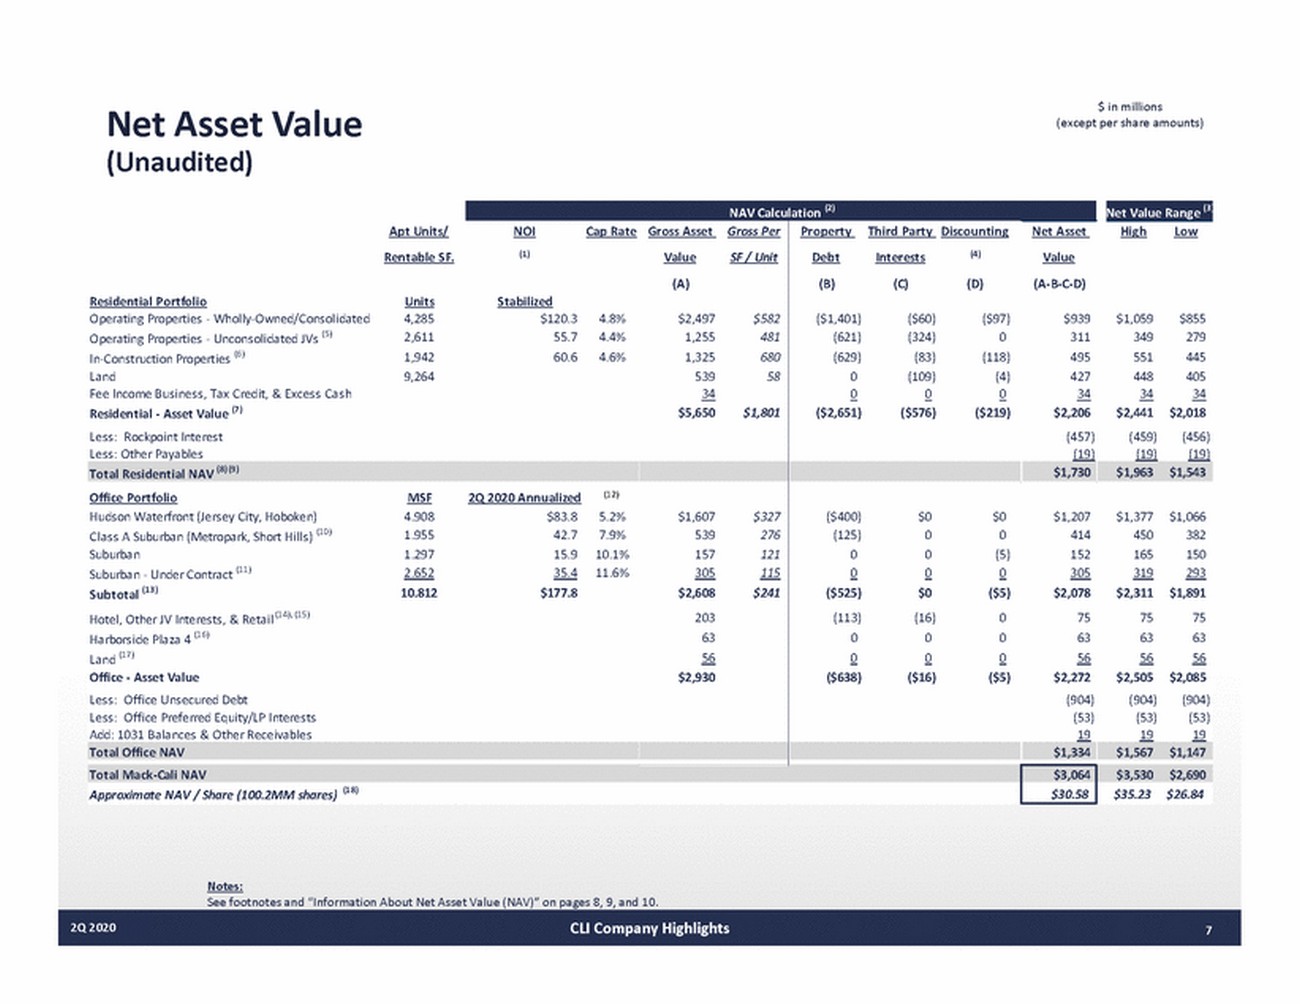
$ in millions (except per share amounts) Net Asset (Unaudited) Value Notes: See footnotes and “Information About Net Asset Value (NAV)” on pages 8, 9, and 10. 2Q 2020CLI Company Highlights7 NAV Calculation (2) High Low $1,059 $855 349 279 551 445 448 405 34 34 $2,441 $2,018 (459) (456) (19) (19) Apt Units/ NOI Cap Rate Rentable SF. (1) Residential Portfolio Un its Stabilized Operating Properties WhollyOwned/Consolidated 4,285 $120.3 4.8% Operating Properties Unconsolidated JVs (5) 2,611 55.7 4.4% InConstruction Properties (6) 1,942 60.6 4.6% Land 9,264 Fee Income Business, Tax Credit, & Excess Cash Residential Asset Value (7) Less: Rockpoint Interest Less: Other Payables Gross Asset Gross Per Value SF / Unit (A) $2,497 $582 1,255 481 1,325 680 539 58 34 $5,650 $1,801 Property Third Party Discounting Debt Interests (4) (B) (C) (D) ($1,401) ($60) ($97) (621) (324) 0 (629) (83) (118) 0 (109) (4) 0 0 0 ($2,651) ($576) ($219) Net Asset Value (ABCD) $939 311 495 427 34 $2,206 (457) (19) Total Residential NAV (8) (9) $1,730 $1,963 $1,543 Office Portfolio MSF 2Q 2020 Annualized (12) Hudson Waterfront (Jersey City, Hoboken) 4.908 $83.8 5.2% Class A Suburban (Metropark, Short Hills) (10) 1.955 42.7 7.9% Suburban 1.297 15.9 10.1% Suburban Under Contract (11) 2.652 35.4 11.6% Subtotal (13) 10.812 $177.8 Hotel, Other JV Interests, & Retail (14), (15) Harborside Plaza 4 (16) Land (17) Office Asset Value Less: Office Unsecured Debt Less: Office Preferred Equity/LP Interests Add: 1031 Balances & Other Receivables $1,607 $327 539 276 157 121 305 115 $2,608 $241 203 63 56 $2,930 ($400) $0 $0 (125) 0 0 0 0 (5) 0 0 0 ($525) $0 ($5) (113) (16) 0 0 0 0 0 0 0 ($638) ($16) ($5) $1,207 414 152 305 $2,078 75 63 56 $2,272 (904) (53) 19 $1,377 $1,066 450 382 165 150 319 293 $2,311 $1,891 75 75 63 63 56 56 $2,505 $2,085 (904) (904) (53) (53) 19 19 Total Office NAV $1,334 $1,567 $1,147 Total MackCali NAV $3,064 $3,530 $2,690 Approximate NAV / Share (100.2MM shares) (18) $30.58 $35.23 $26.84 Net Value Range (3
Notes: Net Asset Value (Unaudited) PLEASE NOTE: The Company’s Net Asset Value estimates at June 30, 2020 contained herein were produced based on conditions for the Company and its market and industry under normalized circumstances, exclusive of the uncertainties described below as a result of the worldwide COVID19 pandemic. The recent outbreak of COVID19 worldwide has significantly slowed global economic activity and caused significant volatility in financial markets. As such, there is currently significant uncertainty around the breadth and duration of business disruptions related to COVID19, as well as its impact on the U.S. economy. The current economic environment can and will be significantly adversely affected by many factors beyond our control. The extent to which COVID19 impacts our Net Asset Value estimates currently and into the future will depend on developments going forward, many of which are highly uncertain and cannot be predicted.As such, as a result of the magnitude of such uncertainties under the current climate, the Company has made the decision to provide its NAV estimates at June 30, 2020 under more normalized conditions to provide its investors with a more useful measure at this time. Reflects 2Q 2020 Annualized Cash NOI for office assets; projected 12month NOI for stabilized residential assets and the projected stabilized NOI for residential assets inconstruction and leaseup. See Information About Net Operating Income on page 44. NAV is generally arrived at by calculating the estimated gross asset values for each of the Company’s real estate properties, investments and other significant assets and interests, and then deducting from such amounts the corresponding net debt and third parties’ interests in the assets. Gross asset values for stabilized operating multifamily real estate properties are calculated using the direct capitalization method by dividing projected net operating income for the next oneyear period by an estimated market capitalization rate for each property. Gross asset values for operating office properties are presented by dividing projected net operating income for the next oneyear period by an estimated year one imputed capitalization rate for each property. See Footnote 4 for a more detailed description of the methodology used by management to estimate gross asset values for its operating office properties. Management projects net operating income that it expects to receive for future periods from a combination of inplace lease contracts, prospective renewals of expiring leases and prospective leaseup of vacant space. Market capitalization rates are estimated for each property based on its asset class and geographic location and are based on information from recent property sale transactions as well as from publicly available information regarding unrelated thirdparty property transactions. The value range is determined by adding or subtracting 0.50% to the year 1 cap rate for office properties and 0.25% to the year 1 cap rate for residential properties. Property cash flows have been reduced by credit loss reserves, leasing and base building capital expenditures, including Harborside renovations. The Waterfront valuation includes $45 million in capital yet to be spent for the Harborside renovations. Additionally, the analysis includes approximately $65 million in base building capital during the first three years of the fiveyear discounted cash flow. The capital is allocated to physical building improvements and is estimated $43 million at the Waterfront, $16 million in the Class A Suburban, and $6 million in the Suburban portfolio’s, respectively. Furthermore, the analysis includes $10 million in leasing capital budgeted in each of the Waterfront, Class A Suburban and Suburban portfolios. This is in addition to the tenant improvements, leasing commissions and capital reserves budgeted. Represents the discount to stabilized value applied to assets that have not yet achieved their respective Projected Stabilized NOI due to construction, leaseup or renovation. See Information About Net Operating Income on page 41. Joint venture investments are generally valued by: applying a capitalization rate to projected NOI for the joint venture’s asset (which is similar to the process for valuing those assets wholly owned by the Company, as described above and previously), and deducting any joint venture level debt and any value allocable to joint venture partners’ interests. Includes Roseland’s last residential subordinate interest (Metropolitan at 40 Park) and commercial subordinate interests. $ in millions 1) 2) 3) 4) 5) 2Q 2020CLI Company Highlights8
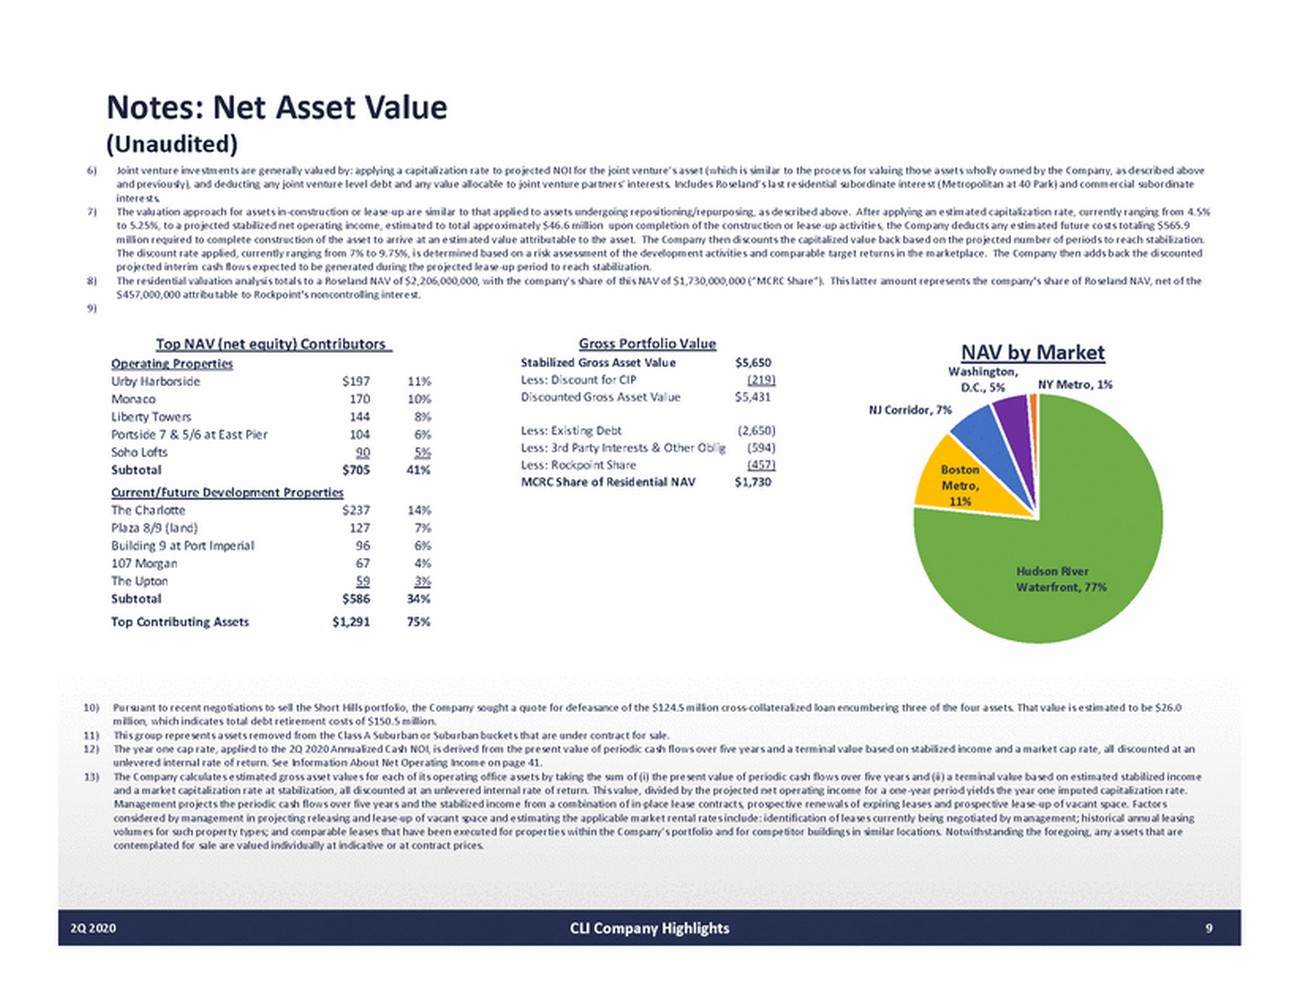
Notes: Net Asset Value (Unaudited) Joint venture investments are generally valued by: applying a capitalization rate to projected NOI for the joint venture’s asset (which is similar to the process for valuing those assets wholly owned by the Company, as described above and previously), and deducting any joint venture level debt and any value allocable to joint venture partners’ interests. Includes Roseland’s last residential subordinate interest (Metropolitan at 40 Park) and commercial subordinate interests. The valuation approach for assets inconstruction or leaseup are similar to that applied to assets undergoing repositioning/repurposing, as described above. After applying an estimated capitalization rate, currently ranging from 4.5% to 5.25%, to a projected stabilized net operating income, estimated to total approximately $46.6 million upon completion of the construction or leaseup activities, the Company deducts any estimated future costs totaling $565.9 million required to complete construction of the asset to arrive at an estimated value attributable to the asset. The Company then discounts the capitalized value back based on the projected number of periods to reach stabilization. The discount rate applied, currently ranging from 7% to 9.75%, is determined based on a risk assessment of the development activities and comparable target returns in the marketplace. The Company then adds back the discounted projected interim cash flows expected to be generated during the projected leaseup period to reach stabilization. The residential valuation analysis totals to a Roseland NAV of $2,206,000,000, with the company’s share of this NAV of $1,730,000,000 (“MCRC Share”). This latter amount represents the company's share of Roseland NAV, net of the $457,000,000 attributable to Rockpoint's noncontrolling interest. 6) 7) 8) 9) Top NAV (net equity) Contributors Gross Portfolio Value NAV by Market Operating Properties Stabilized Gross Asset Value Less: Discount for CIP Discounted Gross Asset Value $5,650 (219) $5,431 Washington, D.C., 5% NJ Corridor, 7% Urby Harborside Monaco Liberty Towers Portside 7 & 5/6 at East Pier Soho Lofts Subtotal $197 170 144 104 90 $705 11% 10% 8% 6% 5% 41% NY Metro, 1% Less: Existing Debt Less: 3rd Party Interests & Other Oblig Less: Rockpoint Share MCRC Share of Residential NAV (2,650) (594) (457) $1,730 Boston Metro, 11% Cu rrent/Future Development Properties The Charlotte Plaza 8/9 (land) Building 9 at Port Imperial 107 Morgan The Upton Subtotal Top Contributing Assets $237 127 96 67 59 $586 $1,291 14% 7% 6% 4% 3% 34% 75% Hudson River Waterfront, 77% 10) Pursuant to recent negotiations to sell the Short Hills portfolio, the Company sought a quote for defeasance of the $124.5 million crosscollateralized loan encumbering three of the four assets. That value is estimated to be $26.0 million, which indicates total debt retirement costs of $150.5 million. This group represents assets removed from the Class A Suburban or Suburban buckets that are under contract for sale. The year one cap rate, applied to the 2Q 2020 Annualized Cash NOI, is derived from the present value of periodic cash flows over five years and a terminal value based on stabilized income and a market cap rate, all discounted at an unlevered internal rate of return. See Information About Net Operating Income on page 41. The Company calculates estimated gross asset values for each of its operating office assets by taking the sum of (i) the present value of periodic cash flows over five years and (ii) a terminal value based on estimated stabilized income and a market capitalization rate at stabilization, all discounted at an unlevered internal rate of return. This value, divided by the projected net operating income for a oneyear period yields the year one imputed capitalization rate. Management projects the periodic cash flows over five years and the stabilized income from a combination of inplace lease contracts, prospective renewals of expiring leases and prospective leaseup of vacant space. Factors considered by management in projecting releasing and leaseup of vacant space and estimating the applicable market rental rates include: identification of leases currently being negotiated by management; historical annual leasing volumes for such property types; and comparable leases that have been executed for properties within the Company’s portfolio and for competitor buildings in similar locations. Notwithstanding the foregoing, any assets that are contemplated for sale are valued individually at indicative or at contract prices. 11) 12) 13) 2Q 2020CLI Company Highlights9
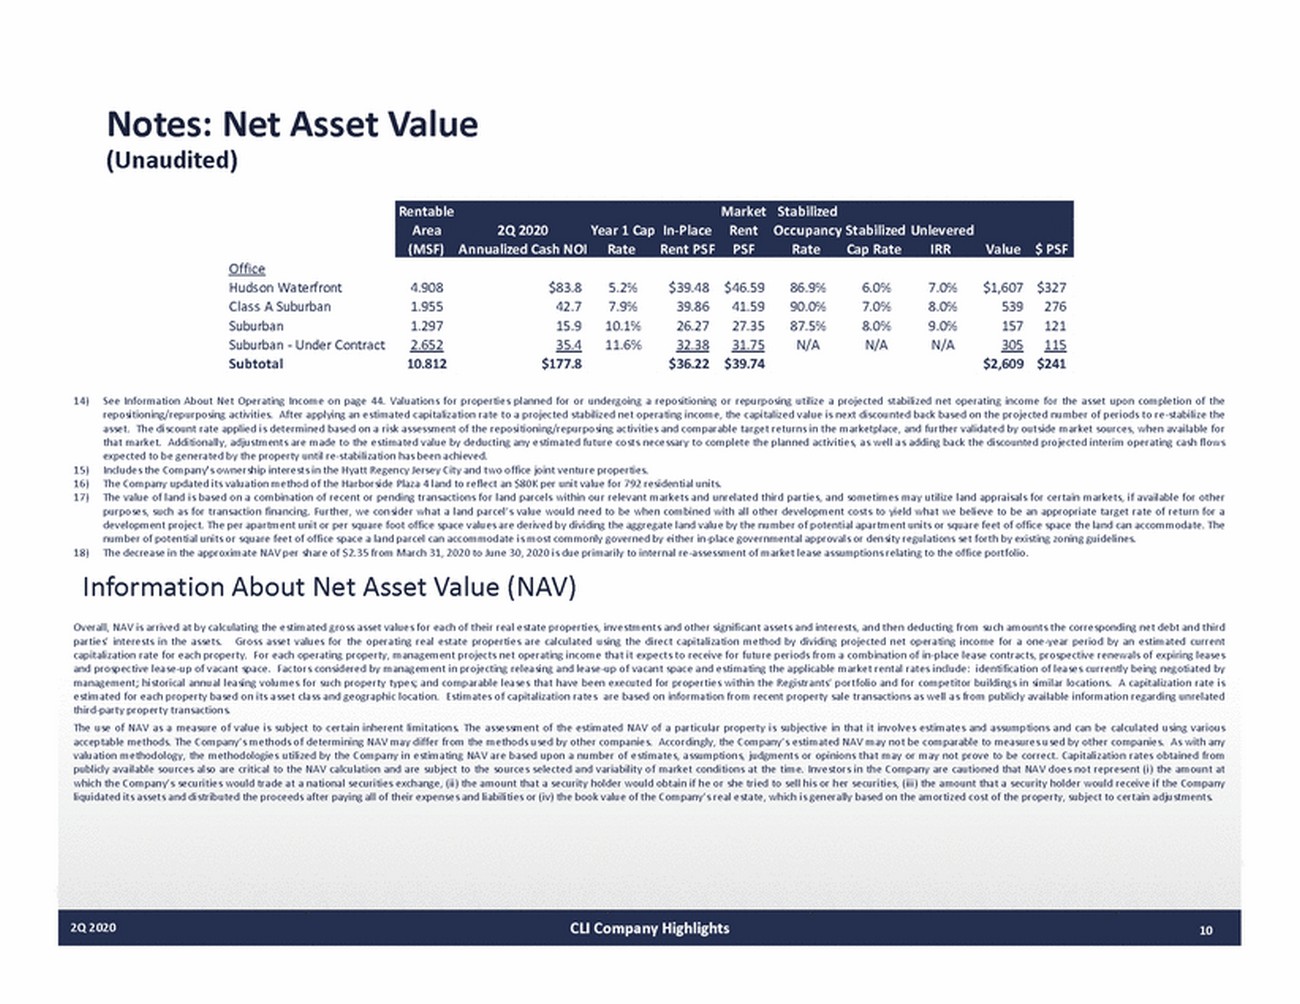
Notes: Net Asset (Unaudited) Value Office Hudson Waterfront Class A Suburban Suburban Suburban Under Contract Subtotal 4.908 1.955 1.297 2.652 10.812 $83.8 42.7 15.9 35.4 $177.8 5.2% 7.9% 10.1% 11.6% $39.48 39.86 26.27 32.38 $36.22 $46.59 41.59 27.35 31.75 $39.74 86.9% 90.0% 87.5% N/A 6.0% 7.0% 8.0% N/A 7.0% 8.0% 9.0% N/A $1,607 539 157 305 $2,609 $327 276 121 115 $241 14) See Information About Net Operating Income on page 44. Valuations for properties planned for or undergoing a repositioning or repurposing utilize a projected stabilized net operating income for the asset upon completion of the repositioning/repurposing activities. After applying an estimated capitalization rate to a projected stabilized net operating income, the capitalized value is next discounted back based on the projected number of periods to restabilize the asset. The discount rate applied is determined based on a risk assessment of the repositioning/repurposing activities and comparable target returns in the marketplace, and further validated by outside market sources, when available for that market. Additionally, adjustments are made to the estimated value by deducting any estimated future costs necessary to complete the planned activities, as well as adding back the discounted projected interim operating cash flows expected to be generated by the property until restabilization has been achieved. Includes the Company's ownership interests in the Hyatt Regency Jersey City and two office joint venture properties. The Company updated its valuation method of the Harborside Plaza 4 land to reflect an $80K per unit value for 792 residential units. The value of land is based on a combination of recent or pending transactions for land parcels within our relevant markets and unrelated third parties, and sometimes may utilize land appraisals for certain markets, if available for other purposes, such as for transaction financing. Further, we consider what a land parcel’s value would need to be when combined with all other development costs to yield what we believe to be an appropriate target rate of return for a development project. The per apartment unit or per square foot office space values are derived by dividing the aggregate land value by the number of potential apartment units or square feet of office space the land can accommodate. The number of potential units or square feet of office space a land parcel can accommodate is most commonly governed by either inplace governmental approvals or density regulations set forth by existing zoning guidelines. The decrease in the approximate NAV per share of $2.35 from March 31, 2020 to June 30, 2020 is due primarily to internal reassessment of market lease assumptions relating to the office portfolio. 15) 16) 17) 18) Information About Net Asset Value (NAV) Overall, NAV is arrived at by calculating the estimated gross asset values for each of their real estate properties, investments and other significant assets and interests, and then deducting from such amounts the corresponding net debt and third parties’ interests in the assets. Gross asset values for the operating real estate properties are calculated using the direct capitalization method by dividing projected net operating income for a oneyear period by an estimated current capitalization rate for each property. For each operating property, management projects net operating income that it expects to receive for future periods from a combination of inplace lease contracts, prospective renewals of expiring leases and prospective leaseup of vacant space. Factors considered by management in projecting releasing and leaseup of vacant space and estimating the applicable market rental rates include: identification of leases currently being negotiated by management; historical annual leasing volumes for such property types; and comparable leases that have been executed for properties within the Registrants’ portfolio and for competitor buildings in similar locations. A capitalization rate is estimated for each property based on its asset class and geographic location. Estimates of capitalization rates are based on information from recent property sale transactions as well as from publicly available information regarding unrelated thirdparty property transactions. The use of NAV as a measure of value is subject to certain inherent limitations. The assessment of the estimated NAV of a particular property is subjective in that it involves estimates and assumptions and can be calculated using various acceptable methods. The Company’s methods of determining NAV may differ from the methods used by other companies. Accordingly, the Company’s estimated NAV may not be comparable to measures used by other companies. As with any valuation methodology, the methodologies utilized by the Company in estimating NAV are based upon a number of estimates, assumptions, judgments or opinions that may or may not prove to be correct. Capitalization rates obtained from publicly available sources also are critical to the NAV calculation and are subject to the sources selected and variability of market conditions at the time. Investors in the Company are cautioned that NAV does not represent (i) the amount at which the Company’s securities would trade at a national securities exchange, (ii) the amount that a security holder would obtain if he or she tried to sell his or her securities, (iii) the amount that a security holder would receive if the Company liquidated its assets and distributed the proceeds after paying all of their expenses and liabilities or (iv) the book value of the Company’s real estate, which is generally based on the amortized cost of the property, subject to certain adjustments. 2Q 2020CLI Company Highlights10 Rentable Market Stabilized Area 2Q 2020 Year 1 Cap InPlace Rent Occupancy Stabilized Unlevered (MSF) Annualized Cash NOI Rate Rent PSF PSF Rate Cap Rate IRR Value $ PSF
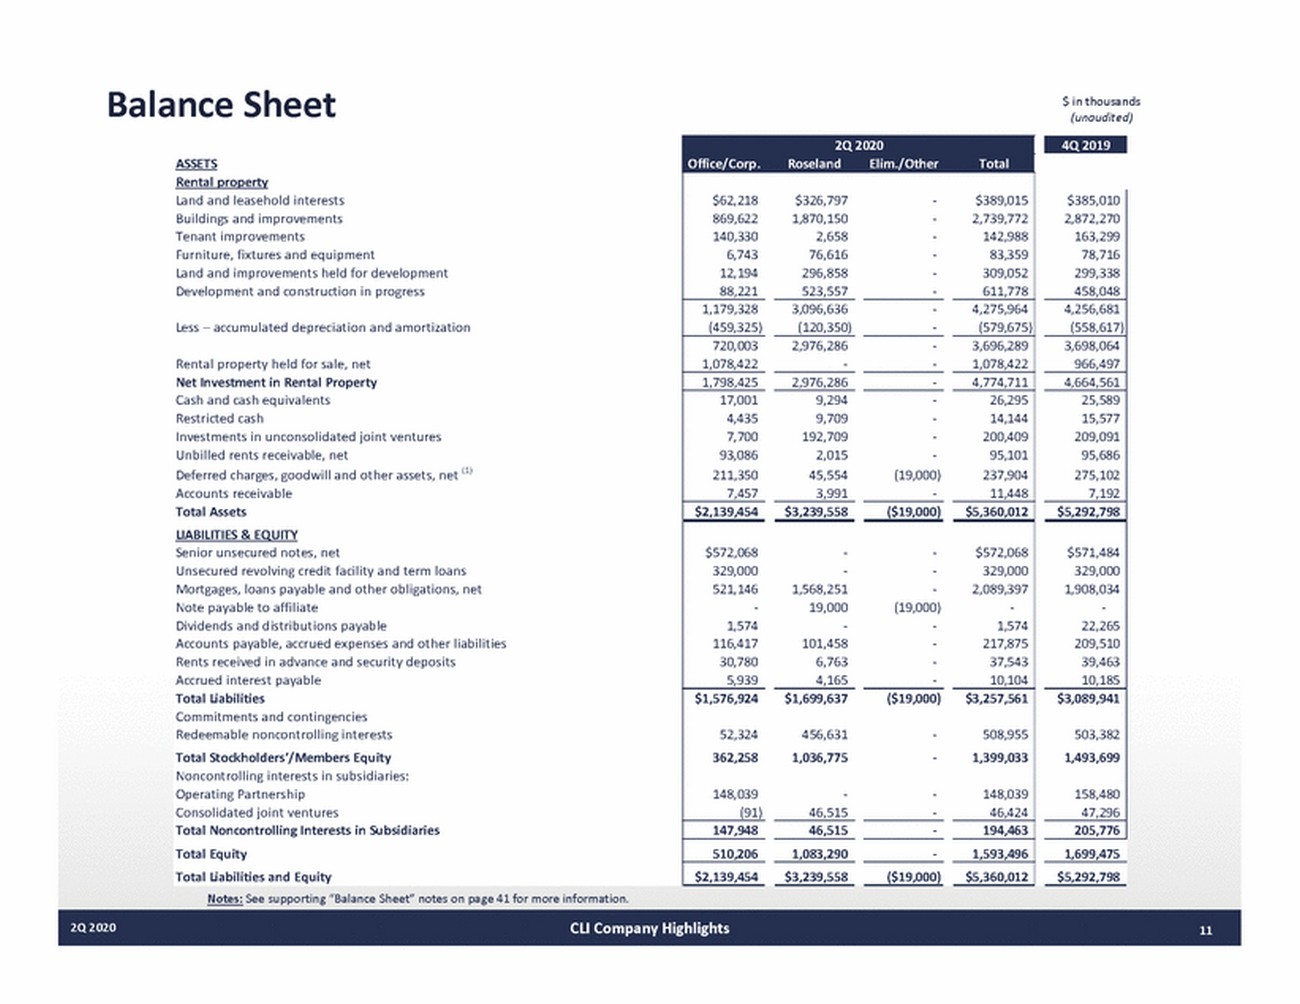
Balance Sheet ASSETS Rental property $ in thousands (unaudited) Land and leasehold interests Buildings and improvements Tenant improvements Furniture, fixtures and equipment Land and improvements held for development Development and construction in progress Less – accumulated depreciation and amortization Rental property held for sale, net Net Investment in Rental Property Cash and cash equivalents Restricted cash Investments in unconsolidated joint ventures Unbilled rents receivable, net Deferred charges, goodwill and other assets, net (1) Accounts receivable Total Assets LIABILITIES & EQUITY Senior unsecured notes, net Unsecured revolving credit facility and term loans Mortgages, loans payable and other obligations, net Note payable to affiliate Dividends and distributions payable Accounts payable, accrued expenses and other liabilities Rents received in advance and security deposits Accrued interest payable Total Liabilities Commitments and contingencies Redeemable noncontrolling interests Total Stockholders’/Members Equity Noncontrolling interests in subsidiaries: Operating Partnership Consolidated joint ventures Total Noncontrolling Interests in Subsidiaries Total Equity Total Liabilities and Equity Notes: See supporting “Balance Sheet” notes on page 41 for more information. 1,699,475 $5,292,798 2Q 2020CLI Company Highlights11 $385,010 2,872,270 163,299 78,716 299,338 458,048 4,256,681 (558,617) 3,698,064 966,497 4,664,561 25,589 15,577 209,091 95,686 275,102 7,192 $5,292,798 $571,484 329,000 1,908,034 22,265 209,510 39,463 10,185 $3,089,941 503,382 1,493,699 158,480 47,296 205,776 4Q 2019 2Q 2020 Office/Corp. Roseland Elim./OtherTotal $62,218 869,622 140,330 6,743 12,194 88,221 $326,797 1,870,150 2,658 76,616 296,858 523,557 3,096,636 (120,350) 2,976,286 2,976,286 9,294 9,709 192,709 2,015 45,554(19,000) 3,991 $3,239,558($19,000) 1,568,251 19,000(19,000) 101,458 6,763 4,165 $1,699,637($19,000) 456,631 1,036,775 46,515 46,515 1,083,290 $3,239,558 ($19,000) $389,015 2,739,772 142,988 83,359 309,052 611,778 1,179,328 (459,325) 4,275,964 (579,675) 720,003 1,078,422 3,696,289 1,078,422 1,798,425 4,774,711 17,001 4,435 7,700 93,086 211,350 7,457 26,295 14,144 200,409 95,101 237,904 11,448 $2,139,454 $5,360,012 $572,068 329,000 521,146 1,574 116,417 30,780 5,939 $572,068 329,000 2,089,397 1,574 217,875 37,543 10,104 $1,576,924 52,324 362,258 148,039 (91) $3,257,561 508,955 1,399,033 148,039 46,424 147,948 194,463 510,206 1,593,496 $2,139,454 $5,360,012
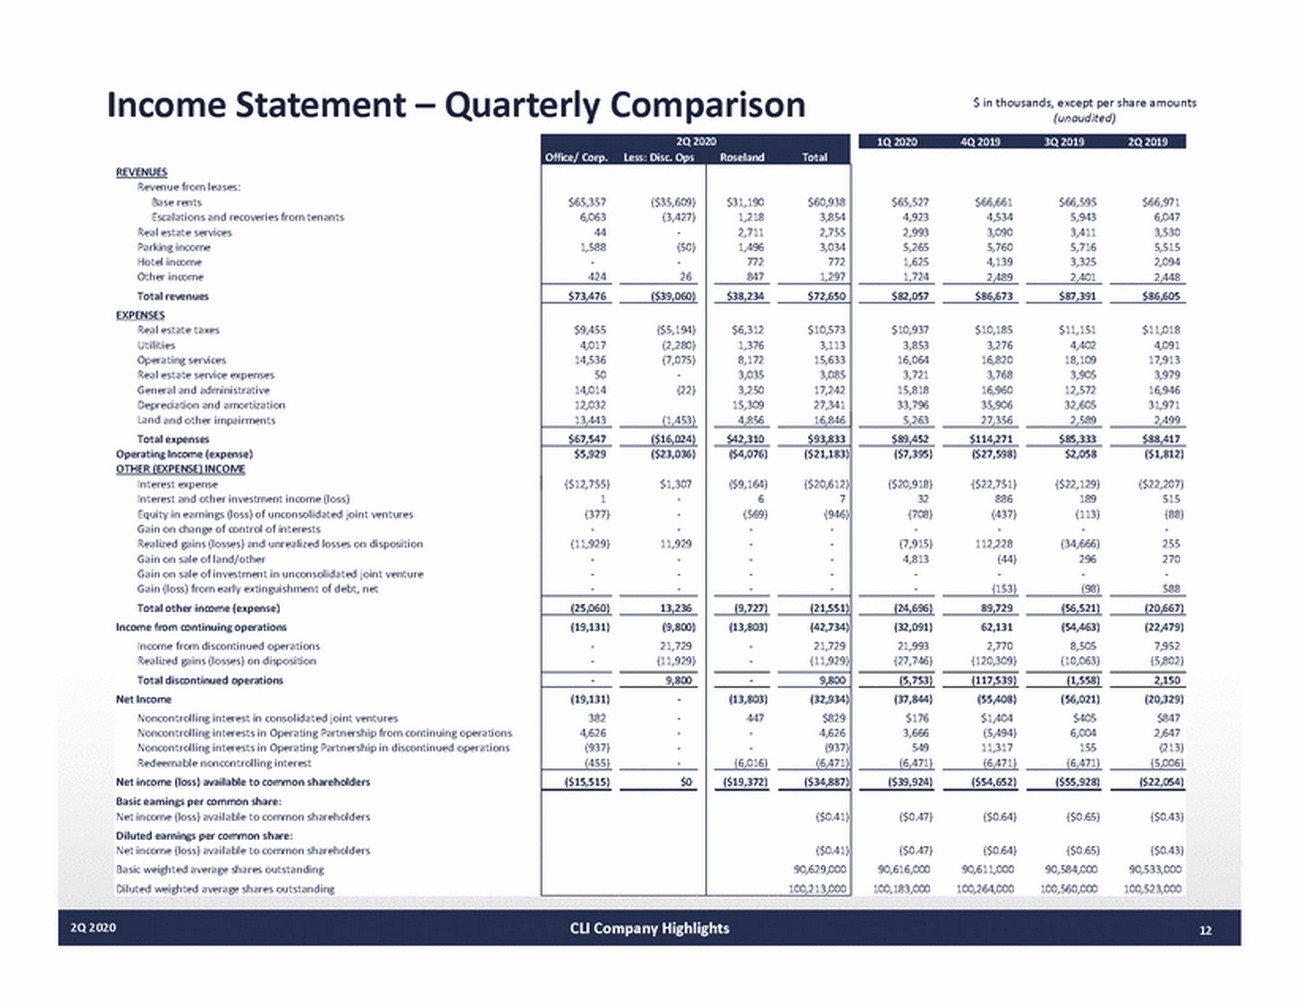
Income Statement – Quarterly Comparison $ in thousands, except per share amounts (unaudited) REVENUES Revenue from leases: Base rents Escalations and recoveries from tenants Real estate services Parking income Hotel income Other income Total revenues EXPENSES Real estate taxes Utilities Operating services Real estate service expenses General and administrative Depreciation and amortization Land and other impairments Total expenses Operating Income (expense) OTHER (EXPENSE) INCOME $65,527 4,923 2,993 5,265 1,625 $66,661 4,534 3,090 5,760 4,139 $66,595 5,943 3,411 5,716 3,325 $66,971 6,047 3,530 5,515 2,094 1,724 2,489 2,401 2,448 $82,057 $86,673 $87,391 $86,605 $10,937 3,853 16,064 3,721 15,818 33,796 $10,185 3,276 16,820 3,768 16,960 35,906 $11,151 4,402 18,109 3,905 12,572 32,605 $11,018 4,091 17,913 3,979 16,946 31,971 5,263 27,356 2,589 2,499 $89,452 $114,271 $85,333 $88,417 ($7,395) ($27,598) $2,058 ($1,812) Interest expense Interest and other investment income (loss) Equity in earnings (loss) of unconsolidated joint ventures Gain on change of control of interests Realized gains (losses) and unrealized losses on disposition Gain on sale of land/other Gain on sale of investment in unconsolidated joint venture Gain (loss) from early extinguishment of debt, net Total other income (expense) Income from continuing operations Income from discontinued operations Realized gains (losses) on disposition Total discontinued operations Net Income Noncontrolling interest in consolidated joint ventures Noncontrolling interests in Operating Partnership from continuing operations Noncontrolling interests in Operating Partnership in discontinued operations Redeemable noncontrolling interest Net income (loss) available to common shareholders Basic earnings per common share: Net income (loss) available to common shareholders Diluted earnings per common share: Net income (loss) available to common shareholders Basic weighted average shares outstanding Diluted weighted average shares outstanding ($20,918) 32 (708) (7,915) 4,813 ($22,751) 886 (437) 112,228 (44) ($22,129) 189 (113) (34,666) 296 (98) ($22,207) 515 (88) 255 270 588 (153) (24,696) 89,729 (56,521) (20,667) (32,091) 21,993 (27,746) 62,131 2,770 (120,309) (54,463) 8,505 (10,063) (22,479) 7,952 (5,802) (5,753) (117,539) (1,558) 2,150 (37,844) $176 3,666 549 (6,471) (55,408) $1,404 (5,494) 11,317 (6,471) (56,021) $405 6,004 155 (6,471) (20,329) $847 2,647 (213) (5,006) ($39,924) ($54,652) ($55,928) ($22,054) ($0.47) ($0.64) ($0.65) ($0.43) ($0.47) 90,616,000 100,183,000 ($0.64) 90,611,000 100,264,000 ($0.65) 90,584,000 100,560,000 ($0.43) 90,533,000 100,523,000 2Q 2020CLI Company Highlights12 1Q 20204Q 20193Q 20192Q 2019 2Q 2020 Office/ Corp. Less: Disc. OpsRoselandTotal $65,357 6,063 44 1,588 424 ($35,609) (3,427) (50) 26 ($39,060) ($5,194) (2,280) (7,075) (22) (1,453) ($16,024) ($23,036) $1,307 11,929 13,236 (9,800) 21,729 (11,929) 9,800 $0 $31,190 1,218 2,711 1,496 772 847 $38,234 $6,312 1,376 8,172 3,035 3,250 15,309 4,856 $42,310 ($4,076) ($9,164) 6 (569) (9,727) (13,803) (13,803) 447 (6,016) ($19,372) $60,938 3,854 2,755 3,034 772 1,297 $73,476 $72,650 $9,455 4,017 14,536 50 14,014 12,032 13,443 $10,573 3,113 15,633 3,085 17,242 27,341 16,846 $67,547 $93,833 $5,929 ($12,755) 1 (377) (11,929) ($21,183) ($20,612) 7 (946) (25,060) (21,551) (19,131) (42,734) 21,729 (11,929) 9,800 (19,131) 382 4,626 (937) (455) (32,934) $829 4,626 (937) (6,471) ($15,515) ($34,887) ($0.41) ($0.41) 90,629,000 100,213,000
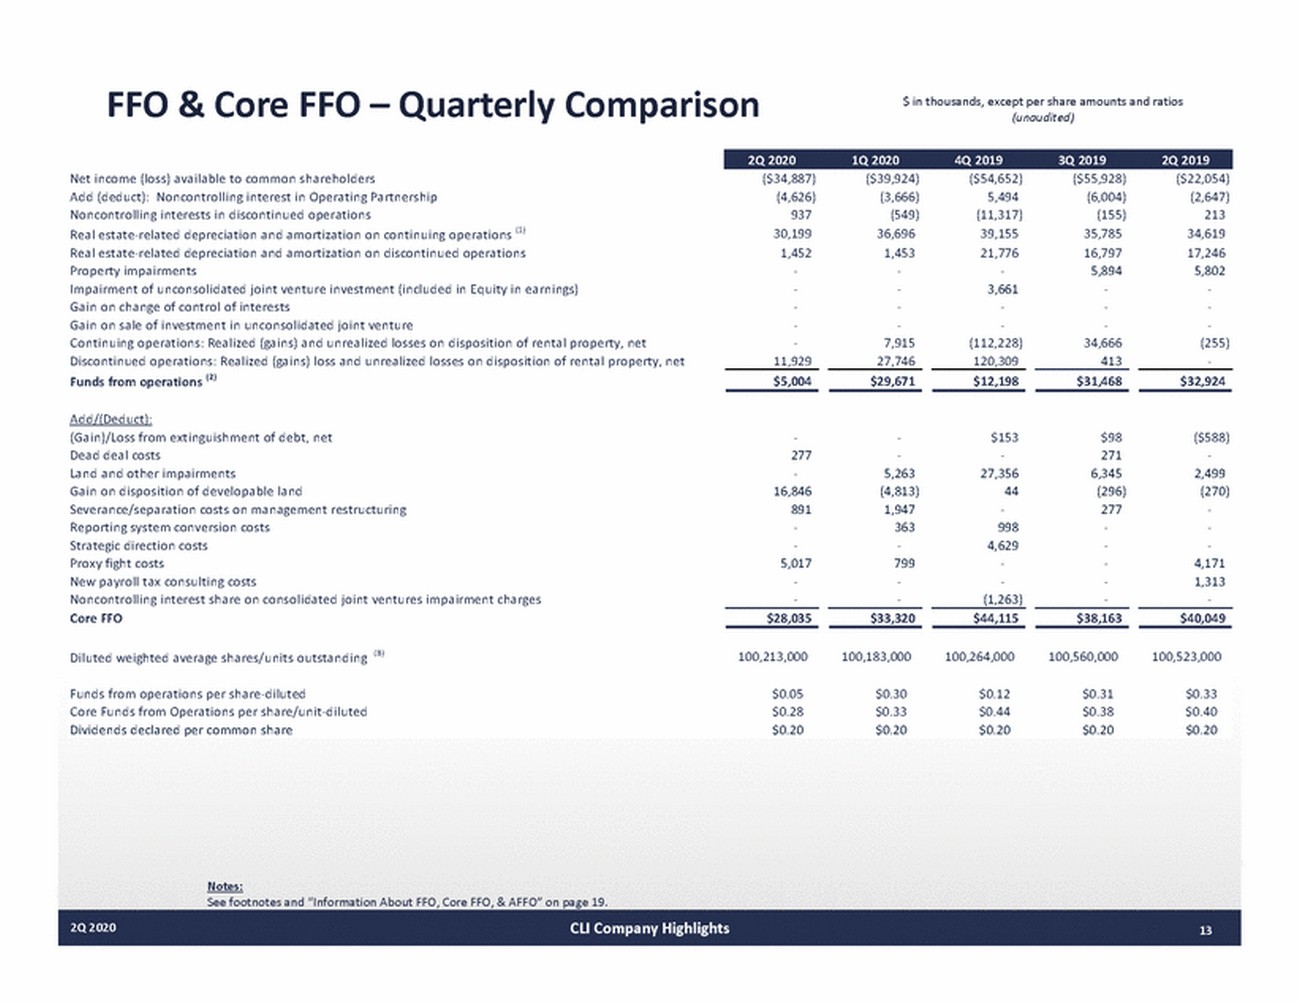
FFO & Core FFO – Quarterly Comparison $ in thousands, except per share amounts and ratios (unaudited) Net income (loss) available to common shareholders Add (deduct): Noncontrolling interest in Operating Partnership Noncontrolling interests in discontinued operations Real estaterelated depreciation and amortization on continuing operations (1) Real estaterelated depreciation and amortization on discontinued operations Property impairments Impairment of unconsolidated joint venture investment (included in Equity in earnings) Gain on change of control of interests Gain on sale of investment in unconsolidated joint venture Continuing operations: Realized (gains) and unrealized losses on disposition of rental property, net Discontinued operations: Realized (gains) loss and unrealized losses on disposition of rental property, net Funds from operations (2) ($34,887) (4,626) 937 30,199 1,452 11,929 ($39,924) (3,666) (549) 36,696 1,453 7,915 27,746 ($54,652) 5,494 (11,317) 39,155 21,776 3,661 (112,228) 120,309 ($55,928) (6,004) (155) 35,785 16,797 5,894 34,666 413 ($22,054) (2,647) 213 34,619 17,246 5,802 (255) $5,004 $29,671 $12,198 $31,468 $32,924 Add/(Deduct): (Gain)/Loss from extinguishment of debt, net Dead deal costs Land and other impairments Gain on disposition of developable land Severance/separation costs on management restructuring Reporting system conversion costs Strategic direction costs Proxy fight costs New payroll tax consulting costs Noncontrolling interest share on consolidated joint ventures impairment charges Core FFO 277 16,846 891 5,017 5,263 (4,813) 1,947 363 799 $153 27,356 44 998 4,629 (1,263) $98 271 6,345 (296) 277 ($588) 2,499 (270) 4,171 1,313 $28,035 $33,320 $44,115 $38,163 $40,049 Diluted weighted average shares/units outstanding (8) 100,213,000 100,183,000 100,264,000 100,560,000 100,523,000 Funds from operations per sharediluted Core Funds from Operations per share/unitdiluted Dividends declared per common share $0.05 $0.28 $0.20 $0.30 $0.33 $0.20 $0.12 $0.44 $0.20 $0.31 $0.38 $0.20 $0.33 $0.40 $0.20 Notes: See footnotes and “Information About FFO, Core FFO, & AFFO” on page 19. 2Q 2020CLI Company Highlights13 2Q 2020 1Q 2020 4Q 2019 3Q 2019 2Q 2019
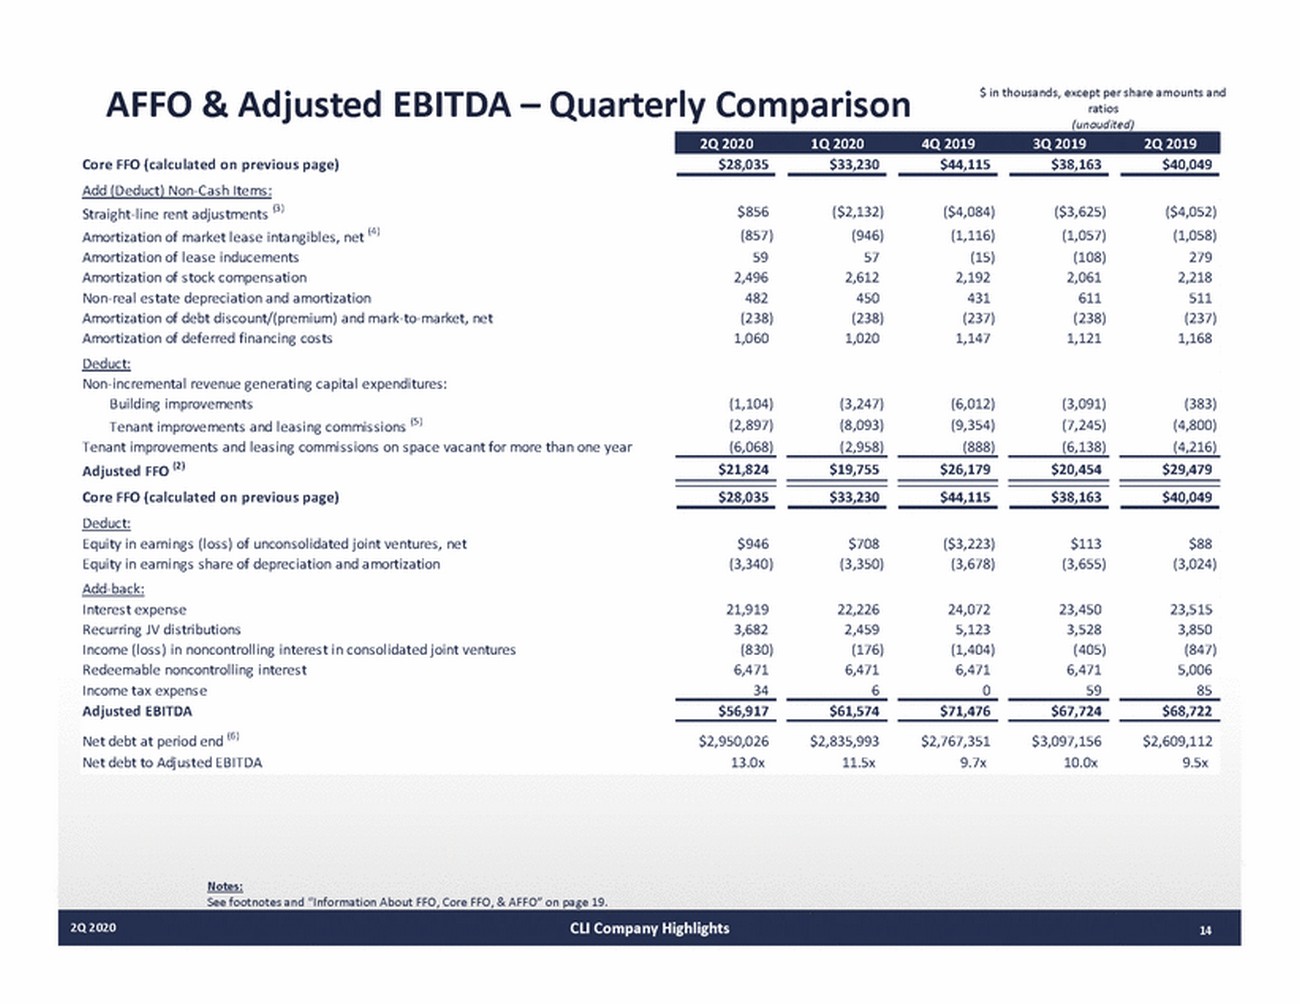
AFFO & Adjusted EBITDA – Quarterly Comparison $ in thousands, except per share amounts and ratios (unaudited) Core FFO (calculated on previous page) Add (Deduct) NonCash Items: $28,035 $33,230 $44,115 $38,163 $40,049 Straightline rent adjustments (3) Amortization of market lease intangibles, net (4) Amortization of lease inducements Amortization of stock compensation Nonreal estate depreciation and amortization Amortization of debt discount/(premium) and marktomarket, net Amortization of deferred financing costs Deduct: Nonincremental revenue generating capital expenditures: Building improvements Tenant improvements and leasing commissions (5) Tenant improvements and leasing commissions on space vacant for more than one year Adjusted FFO (2) Core FFO (calculated on previous page) Deduct: Equity in earnings (loss) of unconsolidated joint ventures, net Equity in earnings share of depreciation and amortization Addback: Interest expense Recurring JV distributions Income (loss) in noncontrolling interest in consolidated joint ventures Redeemable noncontrolling interest Income tax expense Adjusted EBITDA Net debt at period end (6) Net debt to Adjusted EBITDA $856 (857) 59 2,496 482 (238) 1,060 ($2,132) (946) 57 2,612 450 (238) 1,020 ($4,084) (1,116) (15) 2,192 431 (237) 1,147 ($3,625) (1,057) (108) 2,061 611 (238) 1,121 ($4,052) (1,058) 279 2,218 511 (237) 1,168 (1,104) (2,897) (6,068) (3,247) (8,093) (2,958) (6,012) (9,354) (888) (3,091) (7,245) (6,138) (383) (4,800) (4,216) $21,824 $19,755 $26,179 $20,454 $29,479 $28,035 $33,230 $44,115 $38,163 $40,049 $946 (3,340) $708 (3,350) ($3,223) (3,678) $113 (3,655) $88 (3,024) 21,919 3,682 (830) 6,471 34 22,226 2,459 (176) 6,471 6 24,072 5,123 (1,404) 6,471 0 23,450 3,528 (405) 6,471 59 23,515 3,850 (847) 5,006 85 $56,917 $61,574 $71,476 $67,724 $68,722 $2,950,026 13.0x $2,835,993 11.5x $2,767,351 9.7x $3,097,156 10.0x $2,609,112 9.5x Notes: See footnotes and “Information About FFO, Core FFO, & AFFO” on page 19. 2Q 2020CLI Company Highlights14 2Q 2020 1Q 2020 4Q 2019 3Q 2019 2Q 2019
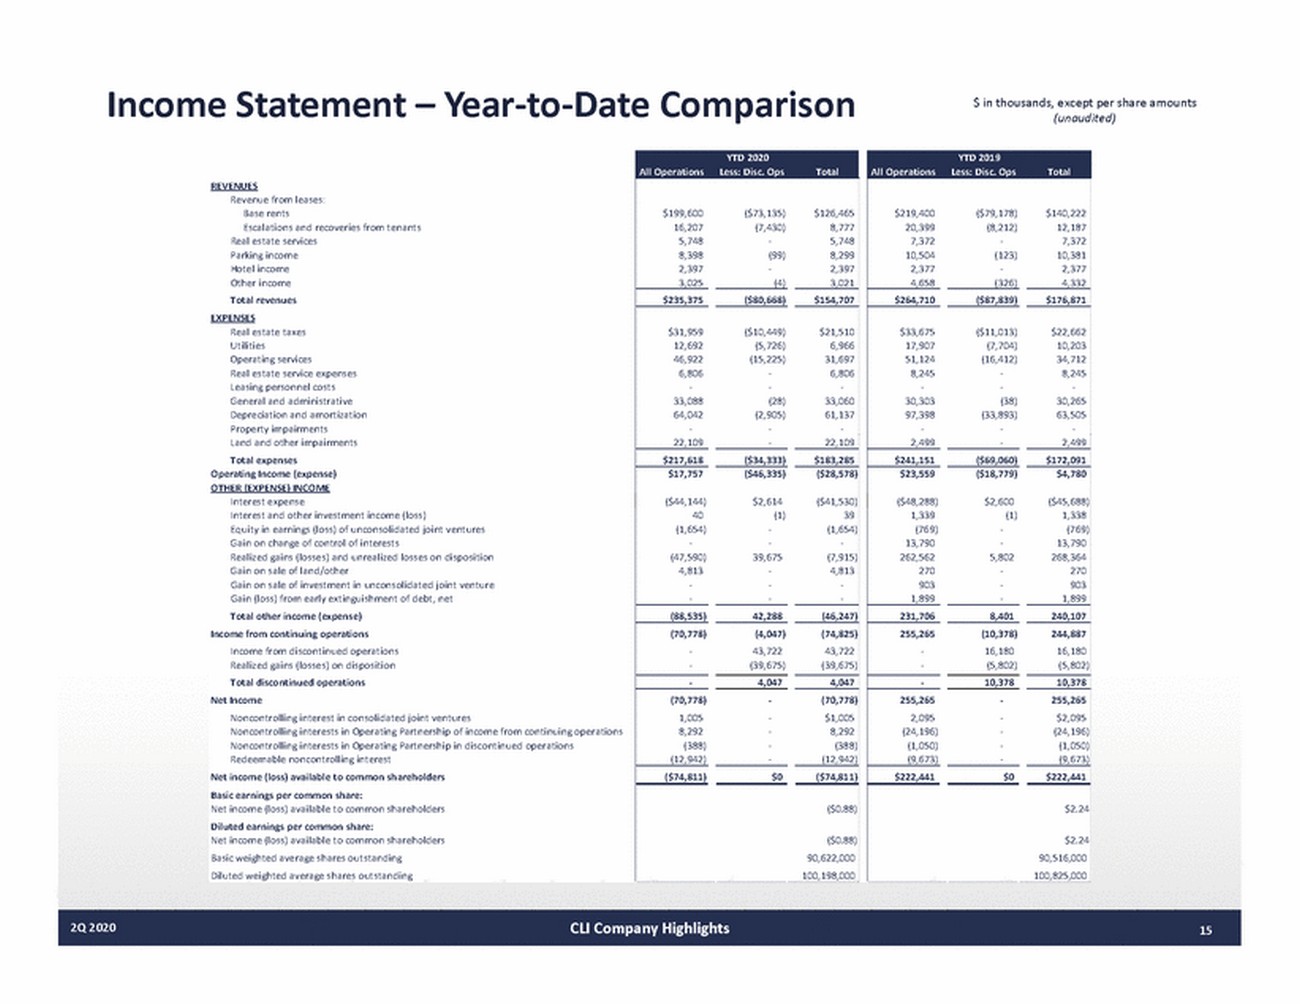
Income Statement – YeartoDate Comparison $ in thousands, except per share amounts (unaudited) REVENUES Revenue from leases: Base rents Escalations and recoveries from tenants Real estate services Parking income Hotel income Other income Total revenues EXPENSES Real estate taxes Utilities Operating services Real estate service expenses Leasing personnel costs General and administrative Depreciation and amortization Property impairments Land and other impairments Total expenses Operating Income (expense) OTHER (EXPENSE) INCOME Interest expense Interest and other investment income (loss) Equity in earnings (loss) of unconsolidated joint ventures Gain on change of control of interests Realized gains (losses) and unrealized losses on disposition Gain on sale of land/other Gain on sale of investment in unconsolidated joint venture Gain (loss) from early extinguishment of debt, net Total other income (expense) Income from continuing operations Income from discontinued operations Realized gains (losses) on disposition Total discontinued operations Net Income Noncontrolling interest in consolidated joint ventures Noncontrolling interests in Operating Partnership of income from continuing operations Noncontrolling interests in Operating Partnership in discontinued operations Redeemable noncontrolling interest Net income (loss) available to common shareholders Basic earnings per common share: Net income (loss) available to common shareholders Diluted earnings per common share: Net income (loss) available to common shareholders Basic weighted average shares outstanding Diluted weighted average shares outstanding 2Q 2020CLI Company Highlights15 YTD 2019 All Operations Less: Disc. OpsTotal $219,400 20,399 7,372 10,504 2,377 4,658 ($79,178) (8,212) (123) (326) ($87,839) ($11,013) (7,704) (16,412) (38) (33,893) ($69,060) ($18,779) $2,600 (1) 5,802 8,401 (10,378) 16,180 (5,802) 10,378 $0 $140,222 12,187 7,372 10,381 2,377 4,332 $264,710 $176,871 $33,675 17,907 51,124 8,245 30,303 97,398 2,499 $22,662 10,203 34,712 8,245 30,265 63,505 2,499 $241,151 $172,091 $23,559 ($48,288) 1,339 (769) 13,790 262,562 270 903 1,899 $4,780 ($45,688) 1,338 (769) 13,790 268,364 270 903 1,899 231,706 240,107 255,265 244,887 16,180 (5,802) 10,378 255,265 2,095 (24,196) (1,050) (9,673) 255,265 $2,095 (24,196) (1,050) (9,673) $222,441 $222,441 $2.24 $2.24 90,516,000 100,825,000 YTD 2020 All Operations Less: Disc. OpsTotal $199,600 16,207 5,748 8,398 2,397 3,025 ($73,135) (7,430) (99) (4) ($80,668) ($10,449) (5,726) (15,225) (28) (2,905) ($34,333) ($46,335) $2,614 (1) 39,675 42,288 (4,047) 43,722 (39,675) 4,047 $0 $126,465 8,777 5,748 8,299 2,397 3,021 $235,375 $154,707 $31,959 12,692 46,922 6,806 33,088 64,042 22,109 $21,510 6,966 31,697 6,806 33,060 61,137 22,109 $217,618 $183,285 $17,757 ($44,144) 40 (1,654) (47,590) 4,813 ($28,578) ($41,530) 39 (1,654) (7,915) 4,813 (88,535) (46,247) (70,778) (74,825) 43,722 (39,675) 4,047 (70,778) 1,005 8,292 (388) (12,942) (70,778) $1,005 8,292 (388) (12,942) ($74,811) ($74,811) ($0.88) ($0.88) 90,622,000 100,198,000
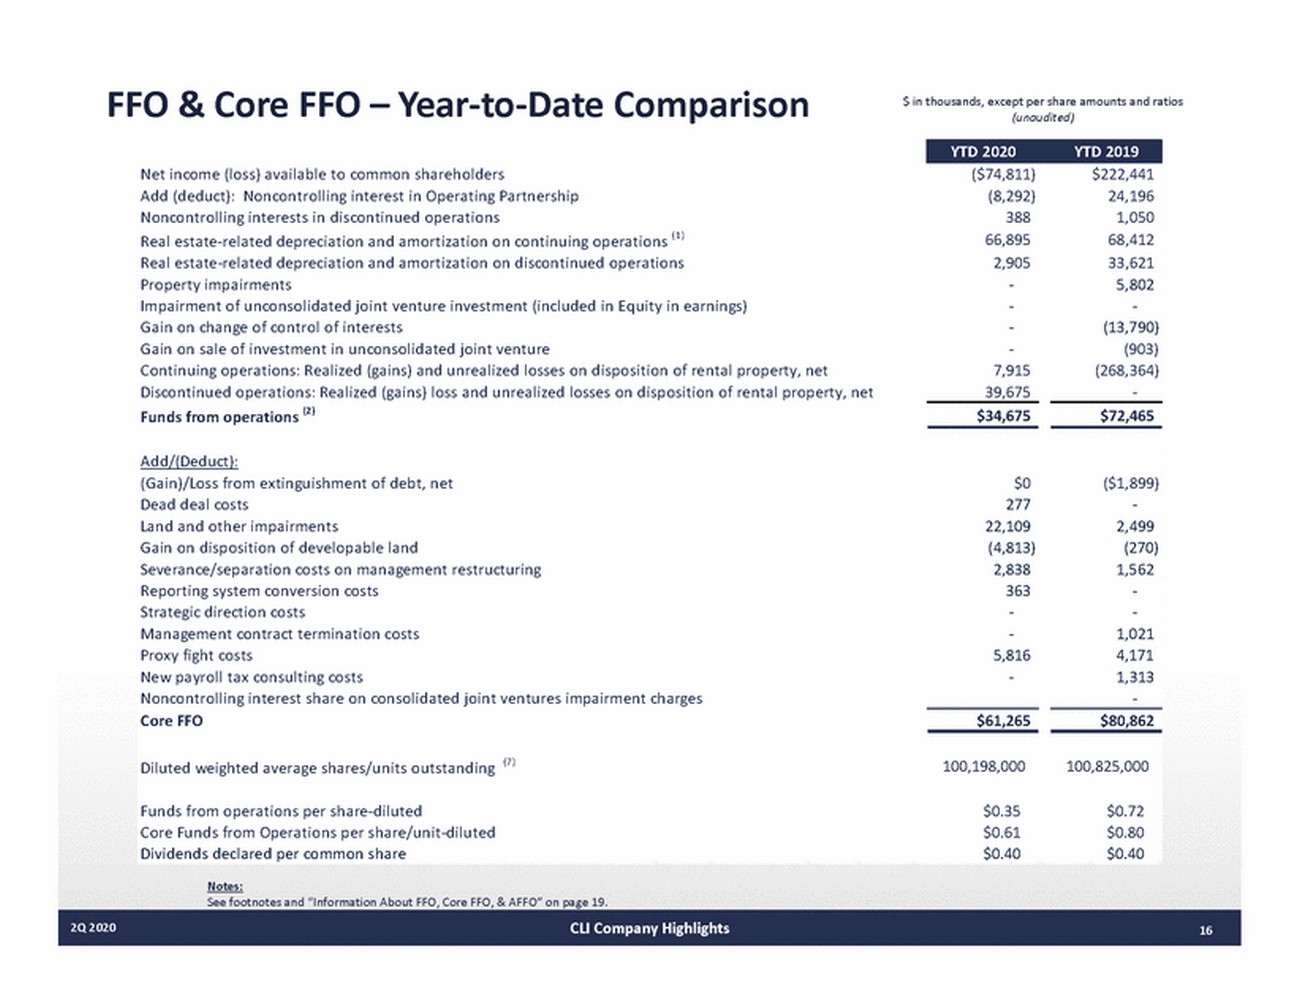
FFO & Core FFO – YeartoDate Comparison $ in thousands, except per share amounts and ratios (unaudited) Net income (loss) available to common shareholders Add (deduct): Noncontrolling interest in Operating Partnership Noncontrolling interests in discontinued operations Real estaterelated depreciation and amortization on continuing operations (1) Real estaterelated depreciation and amortization on discontinued operations Property impairments Impairment of unconsolidated joint venture investment (included in Equity in earnings) Gain on change of control of interests Gain on sale of investment in unconsolidated joint venture Continuing operations: Realized (gains) and unrealized losses on disposition of rental property, net Discontinued operations: Realized (gains) loss and unrealized losses on disposition of rental property, net Funds from operations (2) ($74,811) (8,292) 388 66,895 2,905 7,915 39,675 $222,441 24,196 1,050 68,412 33,621 5,802 (13,790) (903) (268,364) $34,675 $72,465 Add/(Deduct): (Gain)/Loss from extinguishment of debt, net Dead deal costs Land and other impairments Gain on disposition of developable land Severance/separation costs on management restructuring Reporting system conversion costs Strategic direction costs Management contract termination costs Proxy fight costs New payroll tax consulting costs Noncontrolling interest share on consolidated joint ventures impairment charges Core FFO $0 277 22,109 (4,813) 2,838 363 5,816 ($1,899) 2,499 (270) 1,562 1,021 4,171 1,313 $61,265 $80,862 Diluted weighted average shares/units outstanding (7) 100,198,000 100,825,000 Funds from operations per sharediluted Core Funds from Operations per share/unitdiluted Dividends declared per common share Notes: See footnotes and “Information About FFO, Core FFO, & AFFO” on page 19. $0.35 $0.61 $0.40 $0.72 $0.80 $0.40 2Q 2020CLI Company Highlights16 YTD 2020 YTD 2019
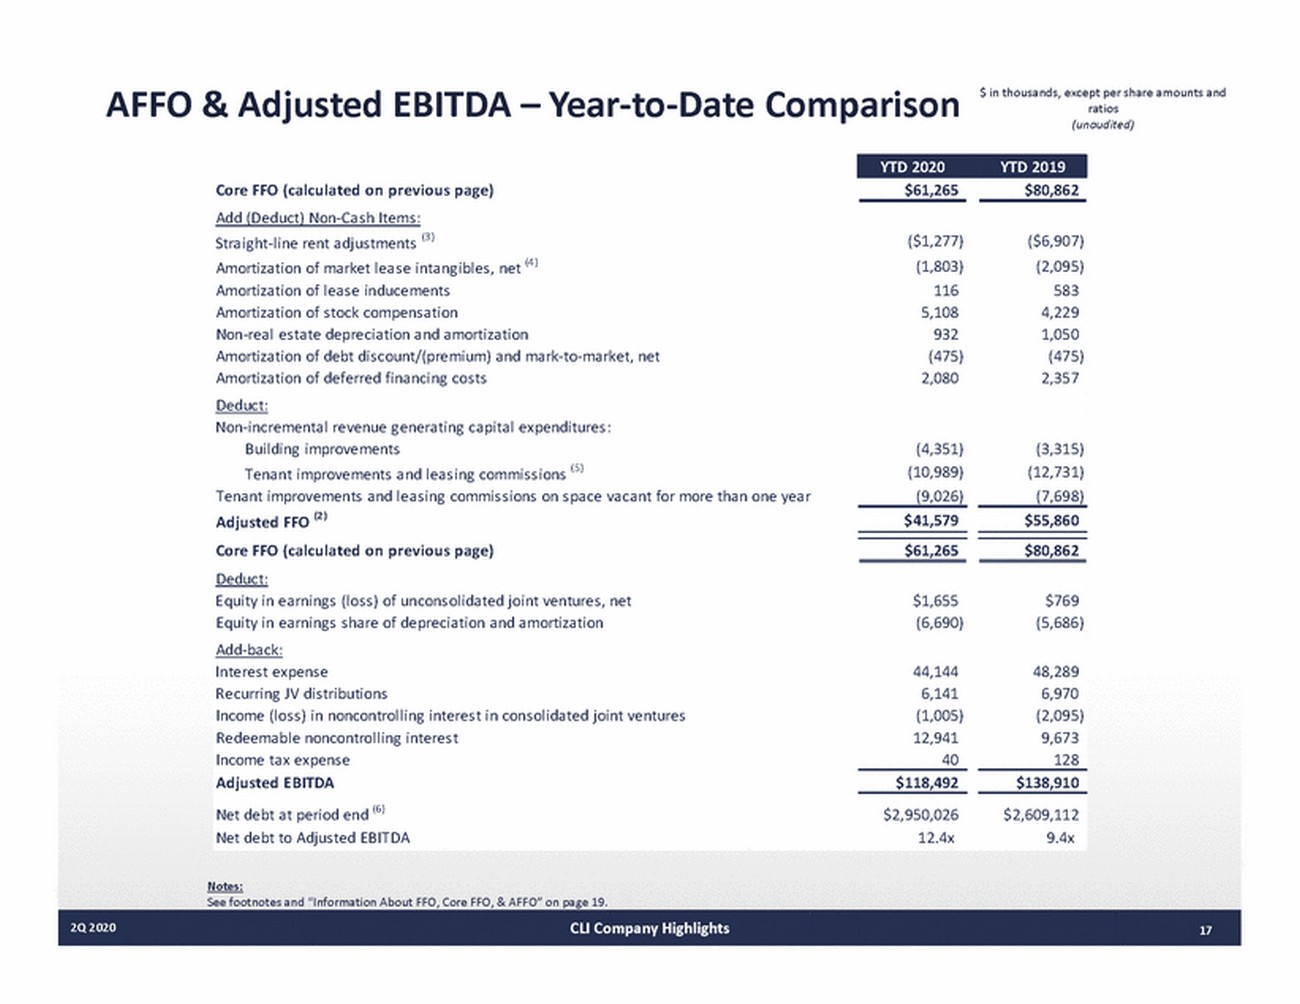
AFFO & Adjusted EBITDA – YeartoDate Comparison $ in thousands, except per share amounts and ratios (unaudited) Core FFO (calculated on previous page) Add (Deduct) NonCash Items: $61,265 $80,862 Straightline rent adjustments (3) Amortization of market lease intangibles, net (4) Amortization of lease inducements Amortization of stock compensation Nonreal estate depreciation and amortization Amortization of debt discount/(premium) and marktomarket, net Amortization of deferred financing costs Deduct: Nonincremental revenue generating capital expenditures: Building improvements Tenant improvements and leasing commissions (5) Tenant improvements and leasing commissions on space vacant for more than one year Adjusted FFO (2) Core FFO (calculated on previous page) Deduct: Equity in earnings (loss) of unconsolidated joint ventures, net Equity in earnings share of depreciation and amortization Addback: Interest expense Recurring JV distributions Income (loss) in noncontrolling interest in consolidated joint ventures Redeemable noncontrolling interest Income tax expense Adjusted EBITDA Net debt at period end (6) Net debt to Adjusted EBITDA ($1,277) (1,803) 116 5,108 932 (475) 2,080 ($6,907) (2,095) 583 4,229 1,050 (475) 2,357 (4,351) (10,989) (9,026) (3,315) (12,731) (7,698) $41,579 $55,860 $61,265 $80,862 $1,655 (6,690) $769 (5,686) 44,144 6,141 (1,005) 12,941 40 48,289 6,970 (2,095) 9,673 128 $118,492 $138,910 $2,950,026 12.4x $2,609,112 9.4x Notes: See footnotes and “Information About FFO, Core FFO, & AFFO” on page 19. 2Q 2020CLI Company Highlights17 YTD 2020 YTD 2019
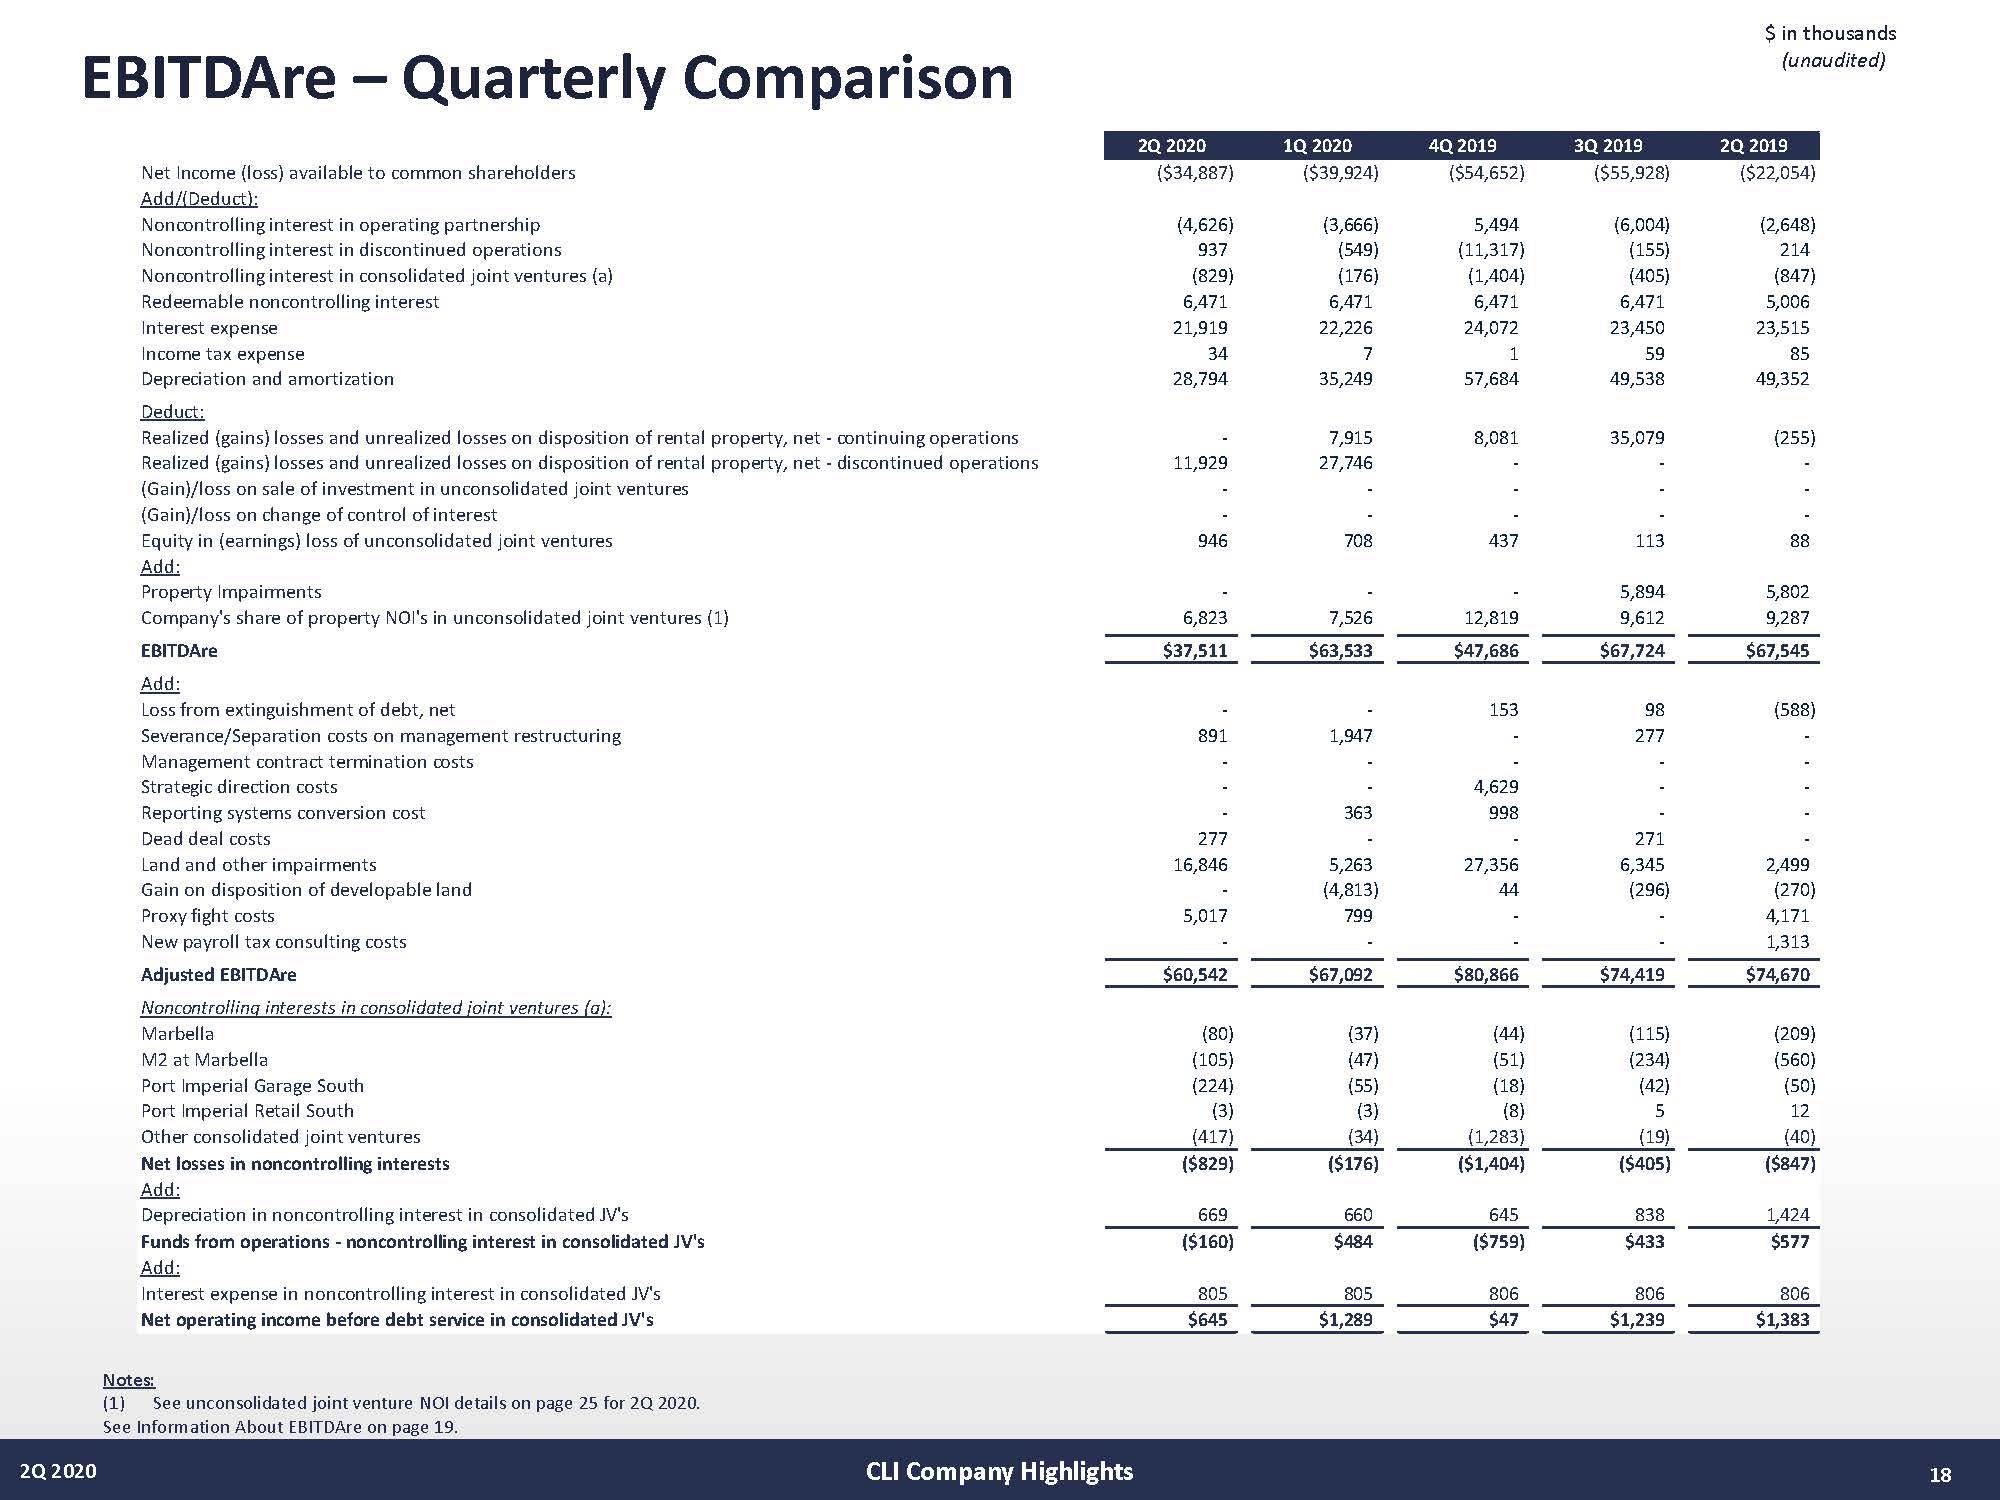
EBITDAre-Quarterly Comparison 2Q 2020 $ in thousands (unaudited) Notes: (1)See unconsolidated joint venture NOI details on page 25 for 2Q 2020. See Information About EBITDAreon page 19. CLI Company Highlights2Q 20201Q 20204Q 20193Q 20192Q 2019Net Income (loss) available to common shareholders($34,887)($39,924)($54,652)($55,928)($22,054)Add/(Deduct):Noncontrolling interest in operating partnership(4,626) (3,666) 5,494 (6,004) (2,648) Noncontrolling interest in discontinued operations937 (549) (11,317) (155) 214 Noncontrolling interest in consolidated joint ventures (a)(829) (176) (1,404) (405) (847) Redeemable noncontrolling interest6,471 6,471 6,471 6,471 5,006 Interest expense21,919 22,226 24,072 23,450 23,515 Income tax expense34 7 1 59 85 Depreciation and amortization28,794 35,249 57,684 49,538 49,352 Deduct:Realized (gains) losses and unrealized losses on disposition of rental property, net - continuing operations- 7,915 8,081 35,079 (255) Realized (gains) losses and unrealized losses on disposition of rental property, net - discontinued operations11,929 27,746 - - - (Gain)/loss on sale of investment in unconsolidated joint ventures- - - - - (Gain)/loss on change of control of interest- - - - - Equity in (earnings) loss of unconsolidated joint ventures946 708 437 113 88 Add:Property Impairments- - - 5,894 5,802 Company's share of property NOI's in unconsolidated joint ventures (1)6,823 7,526 12,819 9,612 9,287 EBITDAre$37,511$63,533$47,686$67,724$67,545Add:Loss from extinguishment of debt, net- - 153 98 (588) Severance/Separation costs on management restructuring891 1,947 - 277 - Management contract termination costs- - - - - Strategic direction costs- - 4,629 - - Reporting systems conversion cost- 363 998 - - Dead deal costs277 - - 271 - Land and other impairments16,846 5,263 27,356 6,345 2,499 Gain on disposition of developable land- (4,813) 44 (296) (270) Proxy fight costs5,017 799 - - 4,171 New payroll tax consulting costs- - - - 1,313 Adjusted EBITDAre$60,542$67,092$80,866$74,419$74,670Noncontrolling interests in consolidated joint ventures (a):Marbella (80) (37) (44) (115) (209) M2 at Marbella(105) (47) (51) (234) (560) Port Imperial Garage South(224) (55) (18) (42) (50) Port Imperial Retail South(3) (3) (8) 5 12 Other consolidated joint ventures(417)(34)(1,283)(19)(40)Net losses in noncontrolling interests($829)($176)($1,404)($405)($847)Add:Depreciation in noncontrolling interest in consolidated JV's669 660 645 838 1,424 Funds from operations - noncontrolling interest in consolidated JV's($160)$484($759)$433$577Add:Interest expense in noncontrolling interest in consolidated JV's805 805 806 806 806 Net operating income before debt service in consolidated JV's$645$1,289$47$1,239$1,38318
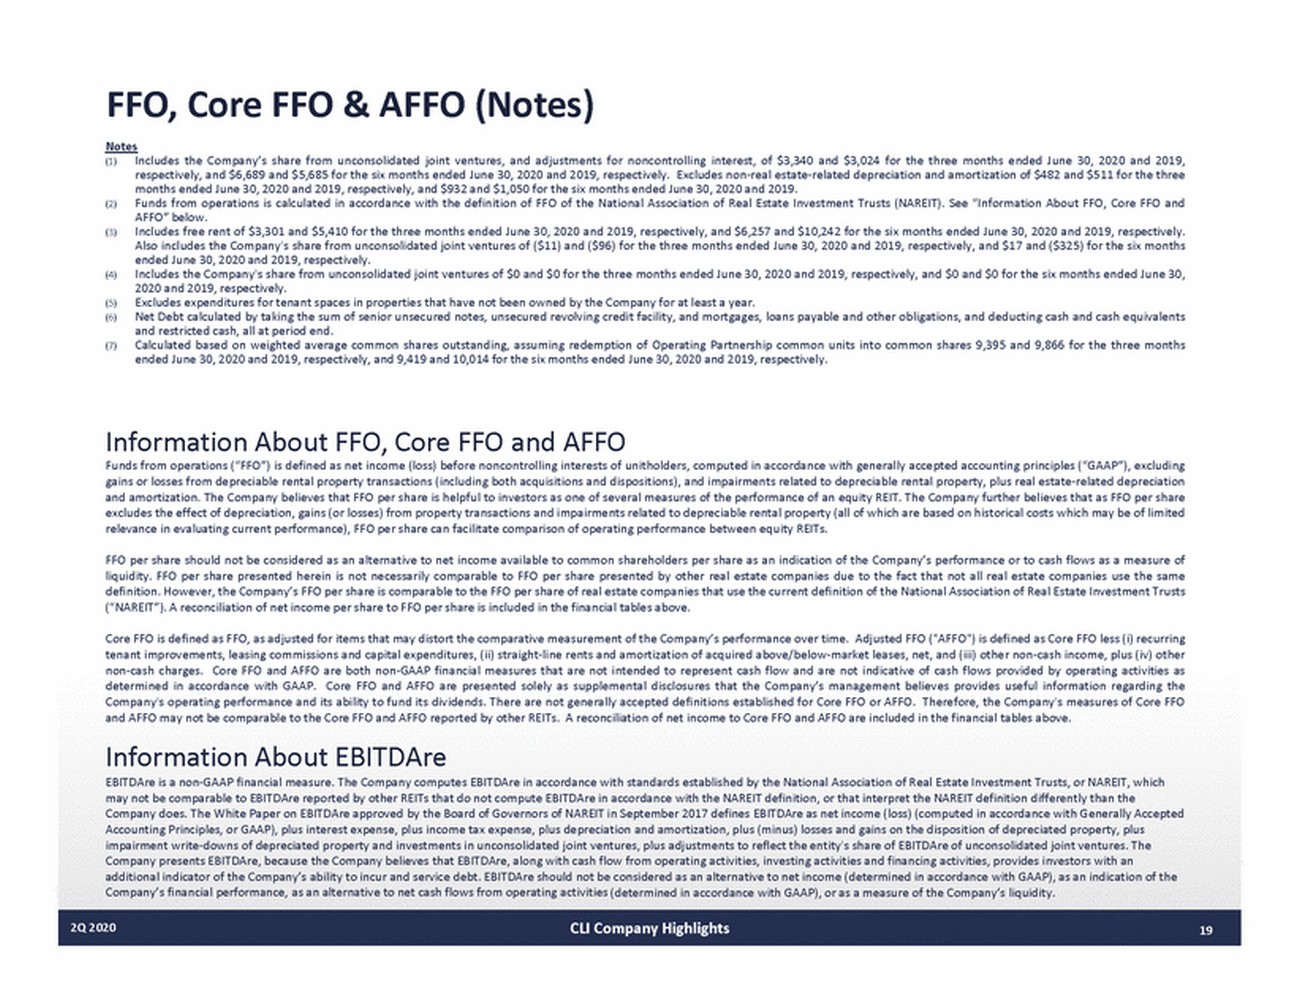
FFO, Core FFO & AFFO (Notes) Notes (1)Includes the Company’s share from unconsolidated joint ventures, and adjustments for noncontrolling interest, of $3,340 and $3,024 for the three months ended June 30, 2020 and 2019, respectively, and $6,689 and $5,685 for the six months ended June 30, 2020 and 2019, respectively. Excludes nonreal estaterelated depreciation and amortization of $482 and $511 for the three months ended June 30, 2020 and 2019, respectively, and $932 and $1,050 for the six months ended June 30, 2020 and 2019. (2)Funds from operations is calculated in accordance with the definition of FFO of the National Association of Real Estate Investment Trusts (NAREIT). See “Information About FFO, Core FFO and AFFO” below. (3)Includes free rent of $3,301 and $5,410 for the three months ended June 30, 2020 and 2019, respectively, and $6,257 and $10,242 for the six months ended June 30, 2020 and 2019, respectively. Also includes the Company's share from unconsolidated joint ventures of ($11) and ($96) for the three months ended June 30, 2020 and 2019, respectively, and $17 and ($325) for the six months ended June 30, 2020 and 2019, respectively. (4)Includes the Company's share from unconsolidated joint ventures of $0 and $0 for the three months ended June 30, 2020 and 2019, respectively, and $0 and $0 for the six months ended June 30, 2020 and 2019, respectively. (5)Excludes expenditures for tenant spaces in properties that have not been owned by the Company for at least a year. (6)Net Debt calculated by taking the sum of senior unsecured notes, unsecured revolving credit facility, and mortgages, loans payable and other obligations, and deducting cash and cash equivalents and restricted cash, all at period end. (7)Calculated based on weighted average common shares outstanding, assuming redemption of Operating Partnership common units into common shares 9,395 and 9,866 for the three months ended June 30, 2020 and 2019, respectively, and 9,419 and 10,014 for the six months ended June 30, 2020 and 2019, respectively. Information About FFO, Core FFO and AFFO Funds from operations (“FFO”) is defined as net income (loss) before noncontrolling interests of unitholders, computed in accordance with generally accepted accounting principles (“GAAP”), excluding gains or losses from depreciable rental property transactions (including both acquisitions and dispositions), and impairments related to depreciable rental property, plus real estaterelated depreciation and amortization. The Company believes that FFO per share is helpful to investors as one of several measures of the performance of an equity REIT. The Company further believes that as FFO per share excludes the effect of depreciation, gains (or losses) from property transactions and impairments related to depreciable rental property (all of which are based on historical costs which may be of limited relevance in evaluating current performance), FFO per share can facilitate comparison of operating performance between equity REITs. FFO per share should not be considered as an alternative to net income available to common shareholders per share as an indication of the Company’s performance or to cash flows as a measure of liquidity. FFO per share presented herein is not necessarily comparable to FFO per share presented by other real estate companies due to the fact that not all real estate companies use the same definition. However, the Company’s FFO per share is comparable to the FFO per share of real estate companies that use the current definition of the National Association of Real Estate Investment Trusts (“NAREIT”). A reconciliation of net income per share to FFO per share is included in the financial tables above. Core FFO is defined as FFO, as adjusted for items that may distort the comparative measurement of the Company’s performance over time. Adjusted FFO ("AFFO") is defined as Core FFO less (i) recurring tenant improvements, leasing commissions and capital expenditures, (ii) straightline rents and amortization of acquired above/belowmarket leases, net, and (iii) other noncash income, plus (iv) other noncash charges. Core FFO and AFFO are both nonGAAP financial measures that are not intended to represent cash flow and are not indicative of cash flows provided by operating activities as determined in accordance with GAAP. Core FFO and AFFO are presented solely as supplemental disclosures that the Company’s management believes provides useful information regarding the Company's operating performance and its ability to fund its dividends. There are not generally accepted definitions established for Core FFO or AFFO. Therefore, the Company's measures of Core FFO and AFFO may not be comparable to the Core FFO and AFFO reported by other REITs. A reconciliation of net income to Core FFO and AFFO are included in the financial tables above. Information About EBITDAre EBITDAre is a nonGAAP financial measure. The Company computes EBITDAre in accordance with standards established by the National Association of Real Estate Investment Trusts, or NAREIT, which may not be comparable to EBITDAre reported by other REITs that do not compute EBITDAre in accordance with the NAREIT definition, or that interpret the NAREIT definition differently than the Company does. The White Paper on EBITDAre approved by the Board of Governors of NAREIT in September 2017 defines EBITDAre as net income (loss) (computed in accordance with Generally Accepted Accounting Principles, or GAAP), plus interest expense, plus income tax expense, plus depreciation and amortization, plus (minus) losses and gains on the disposition of depreciated property, plus impairment writedowns of depreciated property and investments in unconsolidated joint ventures, plus adjustments to reflect the entity's share of EBITDAre of unconsolidated joint ventures. The Company presents EBITDAre, because the Company believes that EBITDAre, along with cash flow from operating activities, investing activities and financing activities, provides investors with an additional indicator of the Company’s ability to incur and service debt. EBITDAre should not be considered as an alternative to net income (determined in accordance with GAAP), as an indication of the Company’s financial performance, as an alternative to net cash flows from operating activities (determined in accordance with GAAP), or as a measure of the Company’s liquidity. 2Q 2020CLI Company Highlights19
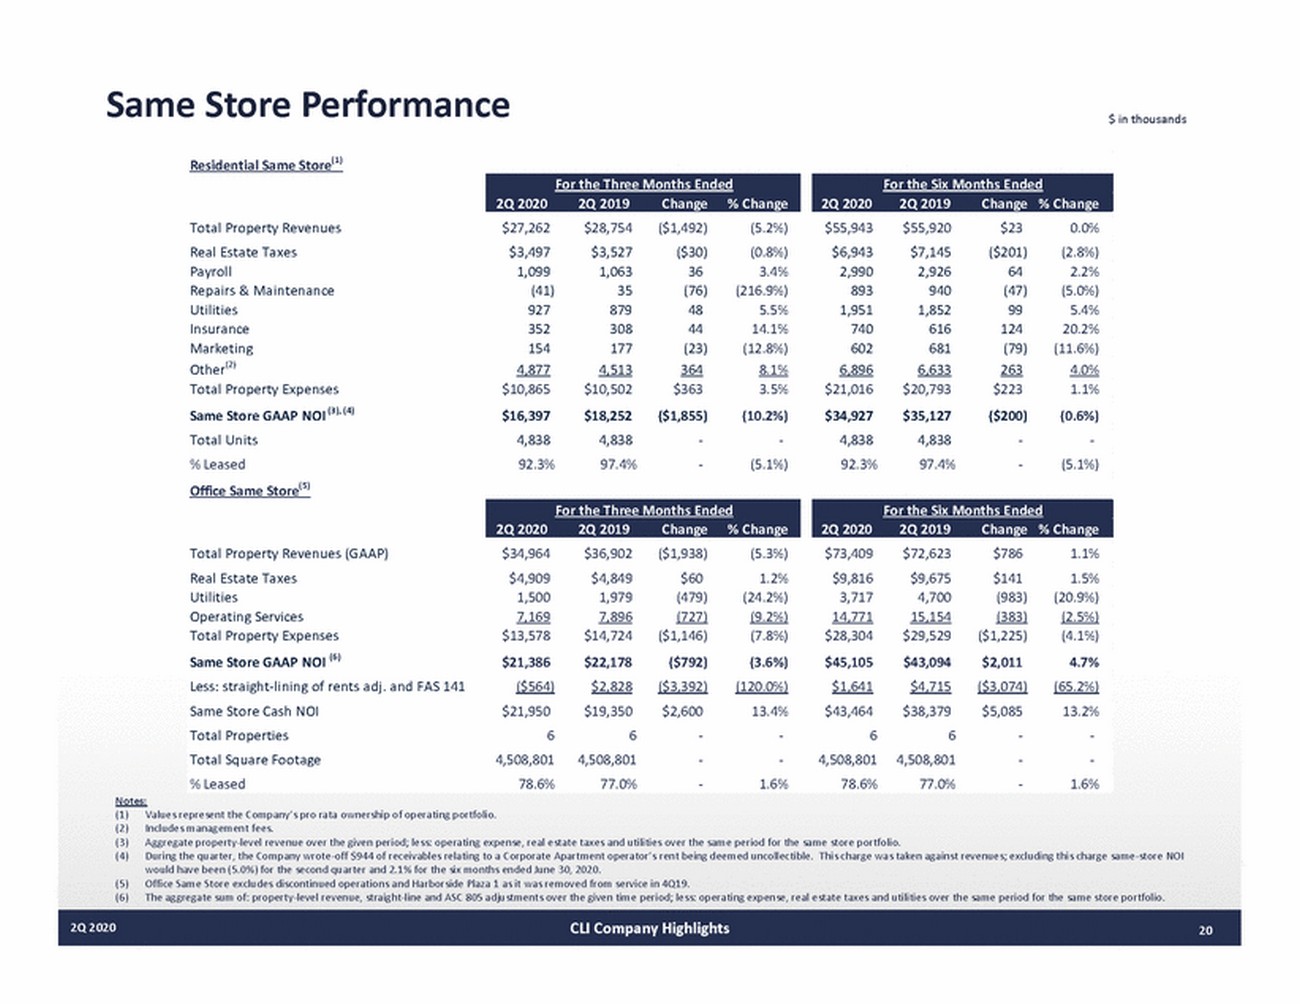
Same Store Performance $ in thousands Residential Same Store(1) Total Property Revenues Real Estate Taxes Payroll Repairs & Maintenance Utilities Insurance Marketing Other(2) Total Property Expenses Same Store GAAP NOI (3), (4) Total Units % Leased Office Same Store(5) $27,262 $3,497 1,099 (41) 927 352 154 4,877 $10,865 $16,397 4,838 92.3% $28,754 $3,527 1,063 35 879 308 177 4,513 $10,502 $18,252 4,838 97.4% ($1,492) ($30) 36 (76) 48 44 (23) 364 $363 ($1,855) (5.2%) (0.8%) 3.4% (216.9%) 5.5% 14.1% (12.8%) 8.1% 3.5% (10.2%) (5.1%) $55,943 $6,943 2,990 893 1,951 740 602 6,896 $21,016 $34,927 4,838 92.3% $55,920 $7,145 2,926 940 1,852 616 681 6,633 $20,793 $35,127 4,838 97.4% $23 ($201) 64 (47) 99 124 (79) 263 $223 ($200) 0.0% (2.8%) 2.2% (5.0%) 5.4% 20.2% (11.6%) 4.0% 1.1% (0.6%) (5.1%) Total Property Revenues (GAAP) Real Estate Taxes Utilities Operating Services Total Property Expenses Same Store GAAP NOI (6) Less: straightlining of rents adj. and FAS 141 Same Store Cash NOI Total Properties Total Square Footage % Leased $34,964 $4,909 1,500 7,169 $13,578 $21,386 ($564) $21,950 6 4,508,801 78.6% $36,902 $4,849 1,979 7,896 $14,724 $22,178 $2,828 $19,350 6 4,508,801 77.0% ($1,938) $60 (479) (727) ($1,146) ($792) ($3,392) $2,600 (5.3%) 1.2% (24.2%) (9.2%) (7.8%) (3.6%) (120.0%) 13.4% 1.6% $73,409 $9,816 3,717 14,771 $28,304 $45,105 $1,641 $43,464 6 4,508,801 78.6% $72,623 $9,675 4,700 15,154 $29,529 $43,094 $4,715 $38,379 6 4,508,801 77.0% $786 $141 (983) (383) ($1,225) $2,011 ($3,074) $5,085 1.1% 1.5% (20.9%) (2.5%) (4.1%) 4.7% (65.2%) 13.2% 1.6% Notes: (1) (2) (3) (4) Values represent the Company’s pro rata ownership of operating portfolio. Includes management fees. Aggregate propertylevel revenue over the given period; less: operating expense, real estate taxes and utilities over the same period for the same store portfolio. During the quarter, the Company wroteoff $944 of receivables relating to a Corporate Apartment operator’s rent being deemed uncollectible. This charge was taken against revenues; excluding this charge samestore NOI would have been (5.0%) for the second quarter and 2.1% for the six months ended June 30, 2020. Office Same Store excludes discontinued operations and Harborside Plaza 1 as it was removed from service in 4Q19. The aggregate sum of: propertylevel revenue, straightline and ASC 805 adjustments over the given time period; less: operating expense, real estate taxes and utilities over the same period for the same store portfolio. (5) (6) 2Q 2020CLI Company Highlights20 For the Three Months Ended 2Q 20202Q 2019Change% Change For the Six Months Ended 2Q 20202Q 2019Change % Change For the Three Months Ended 2Q 20202Q 2019Change% Change For the Six Months Ended 2Q 20202Q 2019Change % Change
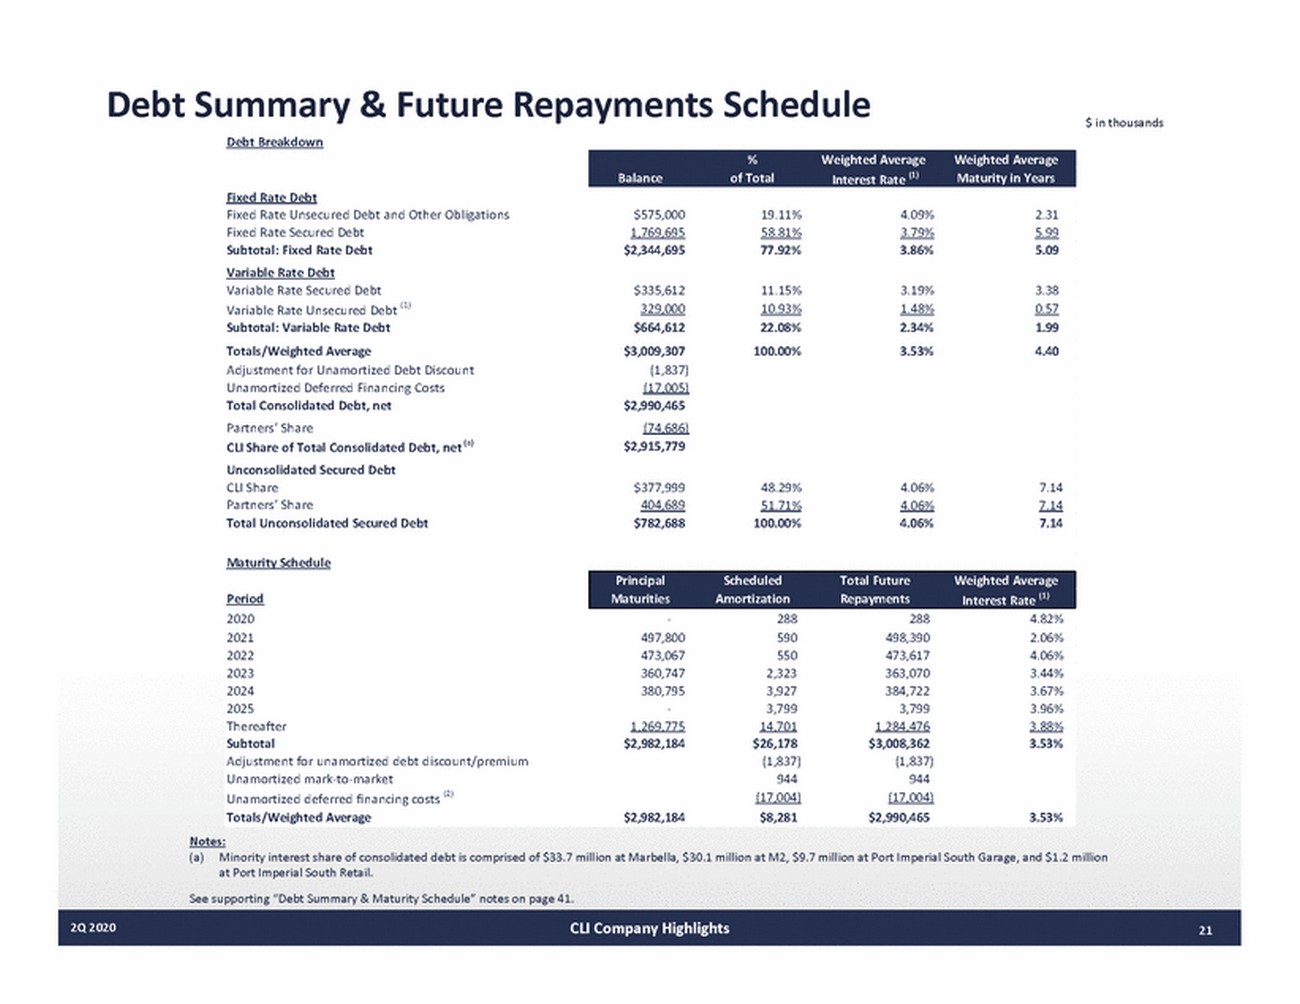
Debt Summary & Future Repayments Schedule $ in thousands Debt Breakdown Fixed Rate Debt Fixed Rate Unsecured Debt and Other Obligations Fixed Rate Secured Debt Subtotal: Fixed Rate Debt Variable Rate Debt $575,000 1,769,695 $2,344,695 19.11% 58.81% 77.92% 4.09% 3.79% 3.86% 2.31 5.99 5.09 Variable Rate Secured Debt Variable Rate Unsecured Debt (1) Subtotal: Variable Rate Debt Totals/Weighted Average Adjustment for Unamortized Debt Discount Unamortized Deferred Financing Costs Total Consolidated Debt, net Partners’ Share CLI Share of Total Consolidated Debt, net (a) Unconsolidated Secured Debt CLI Share Partners’ Share Total Unconsolidated Secured Debt $335,612 329,000 $664,612 $3,009,307 (1,837) (17,005) $2,990,465 (74,686) $2,915,779 11.15% 10.93% 22.08% 100.00% 3.19% 1.48% 2.34% 3.53% 3.38 0.57 1.99 4.40 $377,999 404,689 $782,688 48.29% 51.71% 100.00% 4.06% 4.06% 4.06% 7.14 7.14 7.14 Maturity Schedule Period 2020 2021 2022 2023 2024 2025 Thereafter Subtotal Adjustment for unamortized debt discount/premium Unamortized marktomarket Unamortized deferred financing costs (2) Totals/Weighted Average 497,800 473,067 360,747 380,795 1,269,775 $2,982,184 288 590 550 2,323 3,927 3,799 14,701 $26,178 (1,837) 944 (17,004) $8,281 288 498,390 473,617 363,070 384,722 3,799 1,284,476 $3,008,362 (1,837) 944 (17,004) $2,990,465 4.82% 2.06% 4.06% 3.44% 3.67% 3.96% 3.88% 3.53% $2,982,184 3.53% Notes: (a) Minority interest share of consolidated debt is comprised of $33.7 million at Marbella, $30.1 million at M2, $9.7 million at Port Imperial South Garage, and $1.2 million at Port Imperial South Retail. See supporting “Debt Summary & Maturity Schedule” notes on page 41. 2Q 2020CLI Company Highlights21 Principal Scheduled Total Future Weighted Average Maturities Amortization Repayments Interest Rate (1) % Weighted Average Weighted Average Balance of Total Interest Rate (1) Maturity in Years
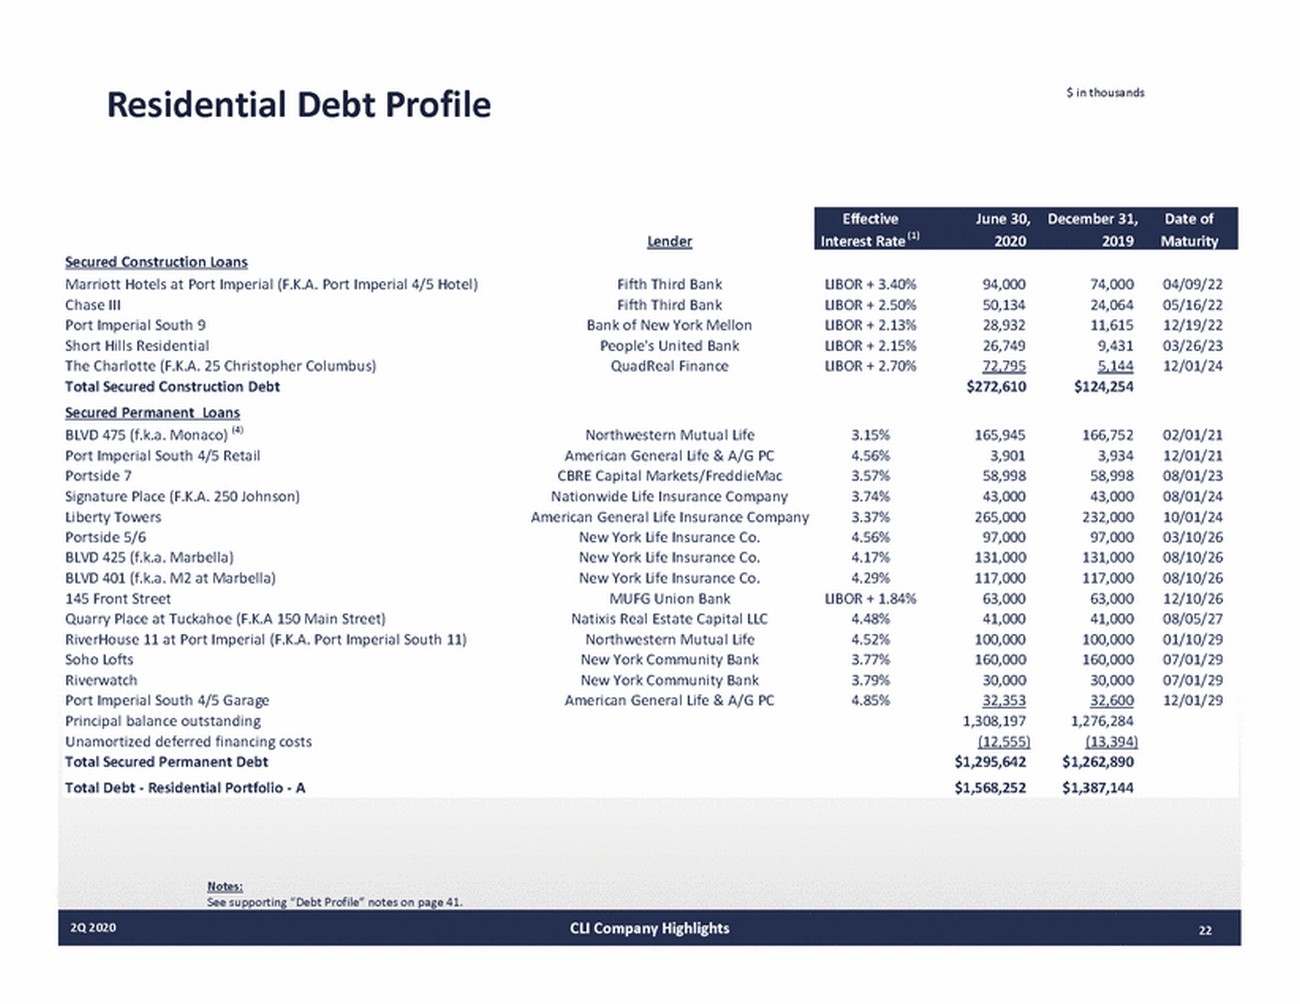
Residential Debt Profile $ in thousands Lender Secured Construction Loans Marriott Hotels at Port Imperial (F.K.A. Port Imperial 4/5 Hotel) Chase III Port Imperial South 9 Short Hills Residential The Charlotte (F.K.A. 25 Christopher Columbus) Total Secured Construction Debt Secured Permanent Loans Fifth Third Bank Fifth Third Bank Bank of New York Mellon People's United Bank QuadReal Finance LIBOR + 3.40% LIBOR + 2.50% LIBOR + 2.13% LIBOR + 2.15% LIBOR + 2.70% 94,000 50,134 28,932 26,749 72,795 $272,610 74,000 24,064 11,615 9,431 5,144 $124,254 04/09/22 05/16/22 12/19/22 03/26/23 12/01/24 BLVD 475 (f.k.a. Monaco) (4) Port Imperial South 4/5 Retail Portside 7 Signature Place (F.K.A. 250 Johnson) Liberty Towers Portside 5/6 BLVD 425 (f.k.a. Marbella) BLVD 401 (f.k.a. M2 at Marbella) 145 Front Street Quarry Place at Tuckahoe (F.K.A 150 Main Street) RiverHouse 11 at Port Imperial (F.K.A. Port Imperial South 11) Soho Lofts Riverwatch Port Imperial South 4/5 Garage Principal balance outstanding Unamortized deferred financing costs Total Secured Permanent Debt Total Debt Residential Portfolio A Northwestern Mutual Life American General Life & A/G PC CBRE Capital Markets/FreddieMac Nationwide Life Insurance Company American General Life Insurance Company New York Life Insurance Co. New York Life Insurance Co. New York Life Insurance Co. MUFG Union Bank Natixis Real Estate Capital LLC Northwestern Mutual Life New York Community Bank New York Community Bank American General Life & A/G PC 3.15% 4.56% 3.57% 3.74% 3.37% 4.56% 4.17% 4.29% LIBOR + 1.84% 4.48% 4.52% 3.77% 3.79% 4.85% 165,945 3,901 58,998 43,000 265,000 97,000 131,000 117,000 63,000 41,000 100,000 160,000 30,000 32,353 1,308,197 (12,555) $1,295,642 $1,568,252 166,752 3,934 58,998 43,000 232,000 97,000 131,000 117,000 63,000 41,000 100,000 160,000 30,000 32,600 1,276,284 (13,394) $1,262,890 $1,387,144 02/01/21 12/01/21 08/01/23 08/01/24 10/01/24 03/10/26 08/10/26 08/10/26 12/10/26 08/05/27 01/10/29 07/01/29 07/01/29 12/01/29 Notes: See supporting “Debt Profile” notes on page 41. 2Q 2020CLI Company Highlights22 EffectiveJune 30,December 31,Date of Interest Rate (1) 20202019Maturity
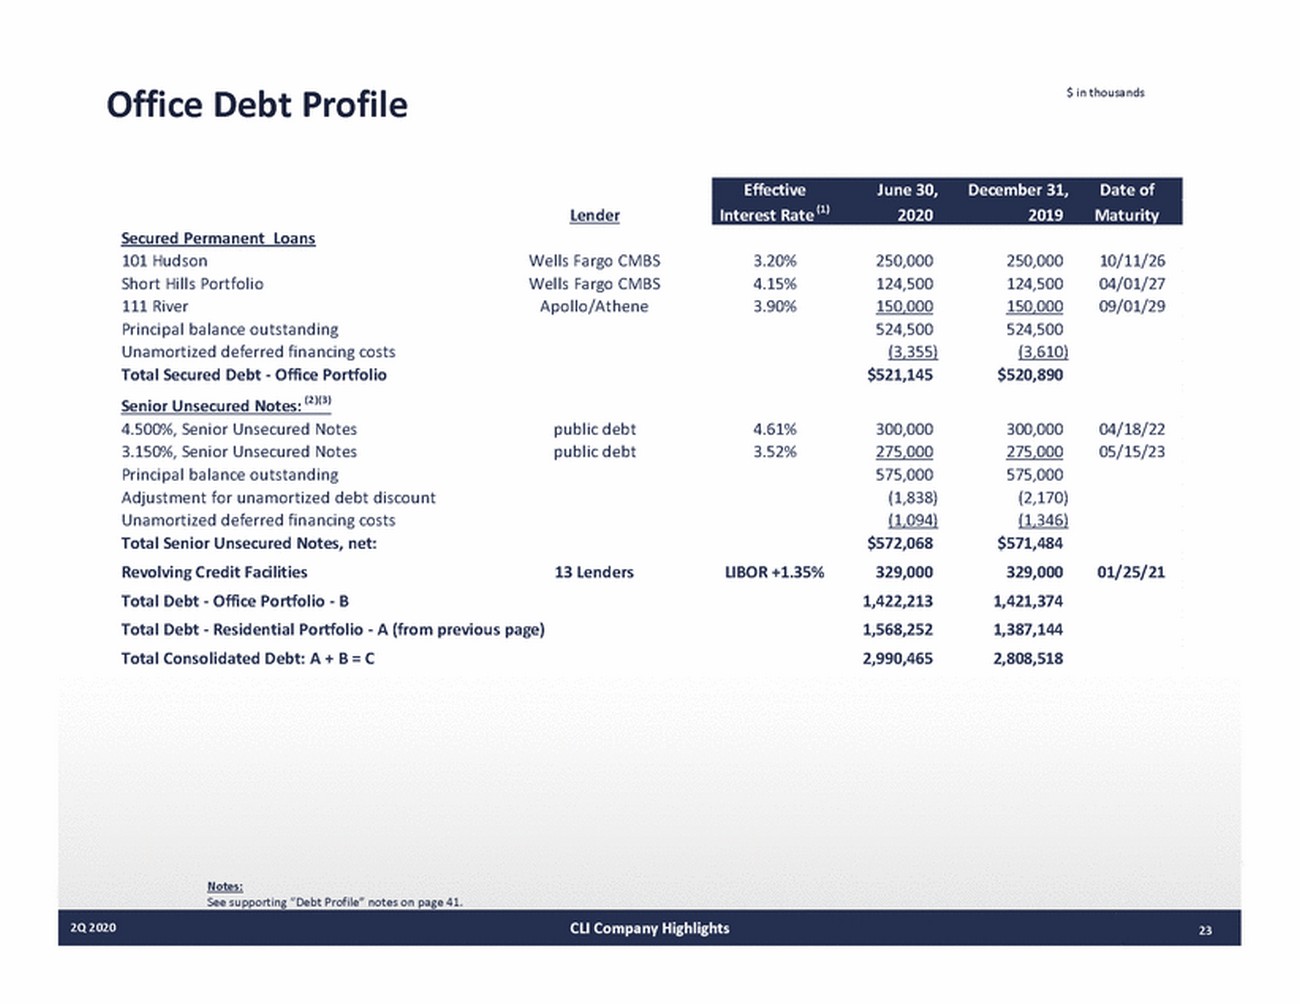
Office Debt Profile $ in thousands Lender Secured Permanent Loans 101 Hudson Short Hills Portfolio 111 River Principal balance outstanding Unamortized deferred financing costs Total Secured Debt Office Portfolio Senior Unsecured Notes: (2)(3) Wells Fargo CMBS Wells Fargo CMBS Apollo/Athene 3.20% 4.15% 3.90% 250,000 124,500 150,000 524,500 (3,355) $521,145 250,000 124,500 150,000 524,500 (3,610) $520,890 10/11/26 04/01/27 09/01/29 4.500%, Senior Unsecured Notes 3.150%, Senior Unsecured Notes Principal balance outstanding Adjustment for unamortized debt discount Unamortized deferred financing costs Total Senior Unsecured Notes, net: Revolving Credit Facilities Total Debt Office Portfolio B Total Debt Residential Portfolio A (from previous page) Total Consolidated Debt: A + B = C public debt public debt 4.61% 3.52% 300,000 275,000 575,000 (1,838) (1,094) $572,068 329,000 1,422,213 1,568,252 2,990,465 300,000 275,000 575,000 (2,170) (1,346) $571,484 329,000 1,421,374 1,387,144 2,808,518 04/18/22 05/15/23 13 Lenders LIBOR +1.35% 01/25/21 Notes: See supporting “Debt Profile” notes on page 41. 2Q 2020CLI Company Highlights23 Effective June 30, December 31, Date of Interest Rate (1)2020 2019 Maturity
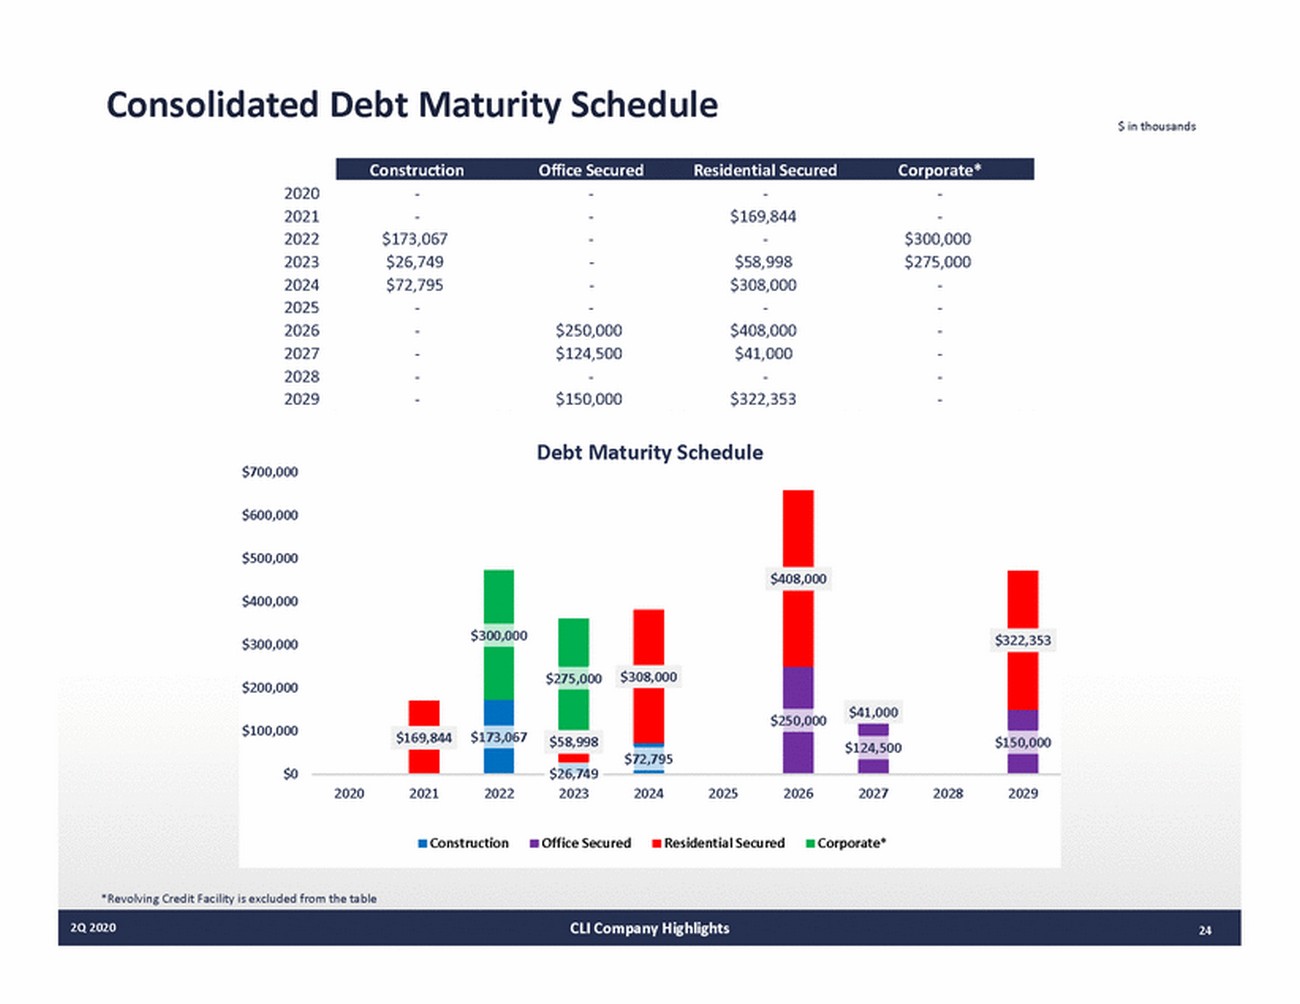
Consolidated Debt Maturity Schedule $ in thousands 2020 2021 2022 2023 2024 2025 2026 2027 2028 2029 $173,067 $26,749 $72,795 $250,000 $124,500 $150,000 $169,844 $58,998 $308,000 $408,000 $41,000 $322,353 $300,000 $275,000 Debt Maturity Schedule $700,000 $600,000 $500,000 $400,000 00,000 $300,000 $200,000 $250,000 $100,000 73,067 $150,000 $124,500 $72,795 $0 $26,749 2020 2021 2022 2023 2024 2025 2026 2027 2028 2029 Construction Office Secured Residential Secured Corporate* *Revolving Credit Facility is excluded from the table 2Q 2020CLI Company Highlights24 $408,000 $3 $169,844$1 75,000$3 $322,353 08,000 $41,000 $2 $58,998 Construction Office Secured Residential Secured Corporate*
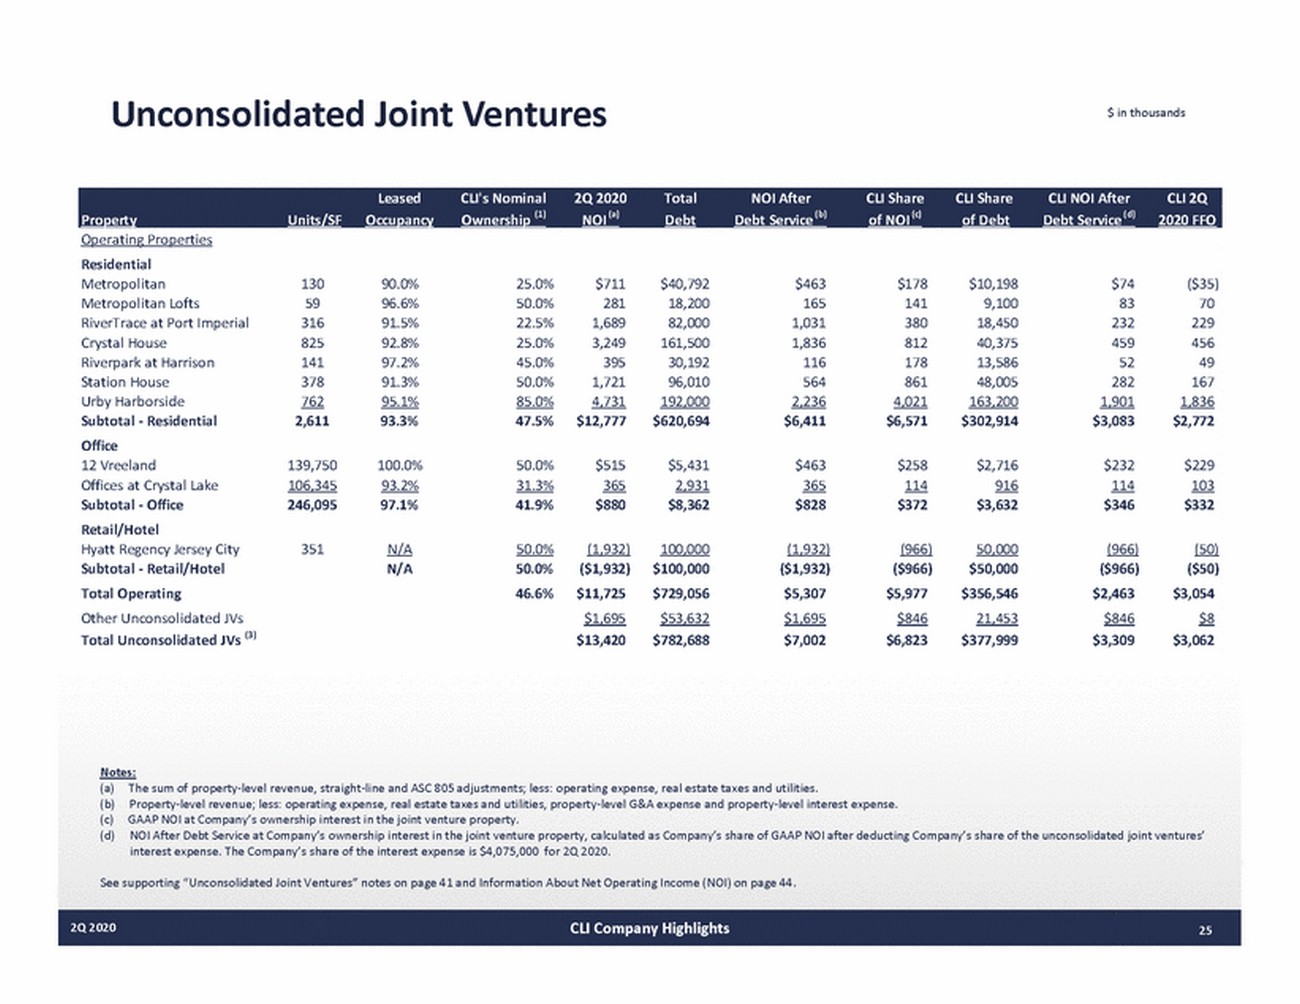
Unconsolidated Joint Ventures $ in thousands Operating Properties Residential Metropolitan Metropolitan Lofts RiverTrace at Port Imperial Crystal House Riverpark at Harrison Station House Urby Harborside Subtotal Residential Office 12 Vreeland Offices at Crystal Lake Subtotal Office Retail/Hotel Hyatt Regency Jersey City Subtotal Retail/Hotel Total Operating Other Unconsolidated JVs Total Unconsolidated JVs (3) 130 59 316 825 141 378 762 2,611 90.0% 96.6% 91.5% 92.8% 97.2% 91.3% 95.1% 93.3% 25.0% 50.0% 22.5% 25.0% 45.0% 50.0% 85.0% 47.5% $711 281 1,689 3,249 395 1,721 4,731 $12,777 $40,792 18,200 82,000 161,500 30,192 96,010 192,000 $620,694 $463 165 1,031 1,836 116 564 2,236 $6,411 $178 141 380 812 178 861 4,021 $6,571 $10,198 9,100 18,450 40,375 13,586 48,005 163,200 $302,914 $74 83 232 459 52 282 1,901 $3,083 ($35) 70 229 456 49 167 1,836 $2,772 139,750 106,345 246,095 100.0% 93.2% 97.1% 50.0% 31.3% 41.9% $515 365 $880 $5,431 2,931 $8,362 $463 365 $828 $258 114 $372 $2,716 916 $3,632 $232 114 $346 $229 103 $332 351 N/A N/A 50.0% 50.0% 46.6% (1,932) ($1,932) $11,725 $1,695 $13,420 100,000 $100,000 $729,056 $53,632 $782,688 (1,932) ($1,932) $5,307 $1,695 $7,002 (966) ($966) $5,977 $846 $6,823 50,000 $50,000 $356,546 21,453 $377,999 (966) ($966) $2,463 $846 $3,309 (50) ($50) $3,054 $8 $3,062 Notes: (a) (b) (c) (d) The sum of propertylevel revenue, straightline and ASC 805 adjustments; less: operating expense, real estate taxes and utilities. Propertylevel revenue; less: operating expense, real estate taxes and utilities, propertylevel G&A expense and propertylevel interest expense. GAAP NOI at Company’s ownership interest in the joint venture property. NOI After Debt Service at Company’s ownership interest in the joint venture property, calculated as Company’s share of GAAP NOI after deducting Company’s share of the unconsolidated joint ventures’ interest expense. The Company’s share of the interest expense is $4,075,000 for 2Q 2020. See supporting “Unconsolidated Joint Ventures” notes on page 41 and Information About Net Operating Income (NOI) on page 44. 2Q 2020CLI Company Highlights25 Leased CLI's Nominal 2Q 2020 Total NOI After CLI Share CLI Share CLI NOI After CLI 2Q Property Units/SF Occupancy Ownership (1) NOI (a)Debt Debt Service (b)of NOI (c) of Debt Debt Service (d)2020 FFO
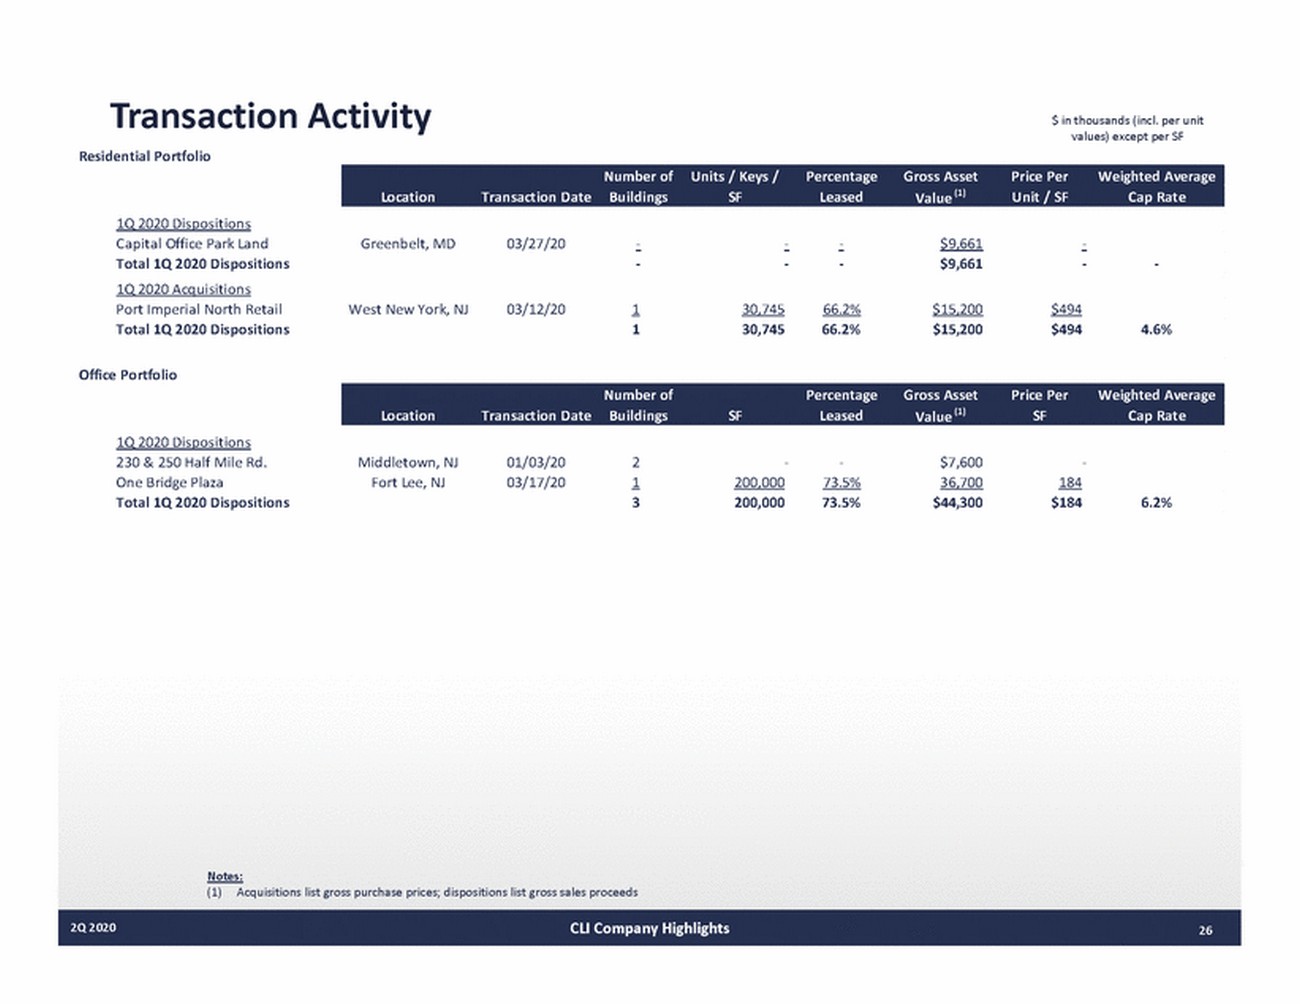
Transaction Residential Portfolio Activity $ in thousands (incl. per unit values) except per SF 1Q 2020 Dispositions Capital Office Park Land Total 1Q 2020 Dispositions 1Q 2020 Acquisitions Greenbelt, MD 03/27/20 $9,661 $9,661 Port Imperial North Retail Total 1Q 2020 Dispositions West New York, NJ 03/12/20 1 1 30,745 30,745 66.2% 66.2% $15,200 $15,200 $494 $494 4.6% Office Portfolio 1Q 2020 Dispositions 230 & 250 Half Mile Rd. One Bridge Plaza Total 1Q 2020 Dispositions Middletown, NJ Fort Lee, NJ 01/03/20 03/17/20 2 1 3 200,000 200,000 73.5% 73.5% $7,600 36,700 $44,300 184 $184 6.2% Notes: (1) Acquisitions list gross purchase prices; dispositions list gross sales proceeds 2Q 2020CLI Company Highlights26 Number of Percentage Gross Asset Price Per Weighted Average Location Transaction Date Buildings SF Leased Value (1) SF Cap Rate Number of Units / Keys / Percentage Gross Asset Price Per Weighted Average Location Transaction Date Buildings SF Leased Value (1) Unit / SF Cap Rate
Multifamily Portfolio 2Q 202027
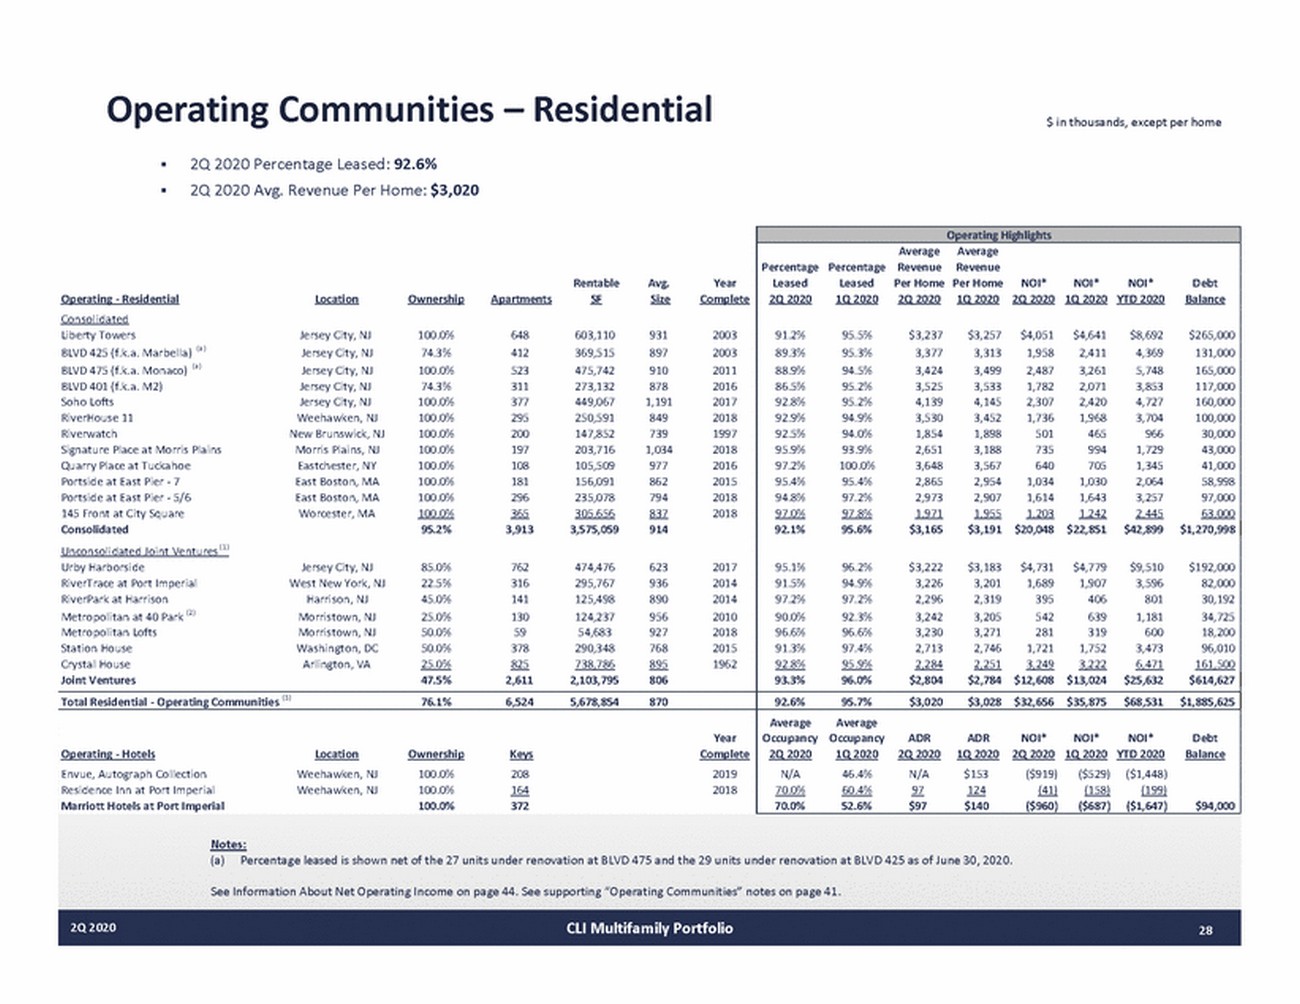
Operating Communities – Residential $ in thousands, except per home 2Q 2020 Percentage Leased: 92.6% 2Q 2020 Avg. Revenue Per Home: $3,020 Notes: (a) Percentage leased is shown net of the 27 units under renovation at BLVD 475 and the 29 units under renovation at BLVD 425 as of June 30, 2020. See Information About Net Operating Income on page 44. See supporting “Operating Communities” notes on page 41. 2Q 2020CLI Multifamily Portfolio28 RentableAvg.Year Operating ResidentialLocation Ownership Apartments SF Size Complete Consolidated Liberty TowersJersey City, NJ100.0%648603,1109312003 BLVD 425 (f.k.a. Marbella) (a ) Jersey City, NJ74.3%412369,5158972003 BLVD 475 (f.k.a. Monaco) (a ) Jersey City, NJ100.0%523475,7429102011 BLVD 401 (f.k.a. M2)Jersey City, NJ74.3%311273,1328782016 Soho LoftsJersey City, NJ100.0%377449,0671,1912017 RiverHouse 11Weehawken, NJ100.0%295250,5918492018 RiverwatchNew Brunswick, NJ100.0%200147,8527391997 Signature Place at Morris PlainsMorris Plains, NJ100.0%197203,7161,0342018 Quarry Place at TuckahoeEastchester, NY100.0%108105,5099772016 Portside at East Pier 7East Boston, MA100.0%181156,0918622015 Portside at East Pier 5/6East Boston, MA100.0%296235,0787942018 145 Front at City SquareWorcester, MA100.0% 365 305,656 837 2018 Consolidated95.2%3,9133,575,059914 Unconsolidated Joint Ventures (1) Urby HarborsideJersey City, NJ85.0%762474,4766232017 RiverTrace at Port ImperialWest New York, NJ22.5%316295,7679362014 RiverPark at HarrisonHarrison, NJ45.0%141125,4988902014 Metropolitan at 40 Park (2) Morristown, NJ25.0%130124,2379562010 Metropolitan LoftsMorristown, NJ50.0%5954,6839272018 Station HouseWashington, DC50.0%378290,3487682015 Crystal HouseArlington, VA25.0% 825 738,786 895 1962 Joint Ventures47.5%2,6112,103,795806 Operating Highlights AverageAverage Percentage Percentage Revenue Revenue LeasedLeasedPer Home Per HomeNOI*NOI*NOI*Debt 2Q 2020 1Q 2020 2Q 2020 1Q 2020 2Q 2020 1Q 2020 YTD 2020 Balance 91.2%95.5%$3,237$3,257$4,051$4,641$8,692$265,000 89.3%95.3%3,3773,3131,9582,4114,369131,000 88.9%94.5%3,4243,4992,4873,2615,748165,000 86.5%95.2%3,5253,5331,7822,0713,853117,000 92.8%95.2%4,1394,1452,3072,4204,727160,000 92.9%94.9%3,5303,4521,7361,9683,704100,000 92.5%94.0%1,8541,89850146596630,000 95.9%93.9%2,6513,1887359941,72943,000 97.2%100.0%3,6483,5676407051,34541,000 95.4%95.4%2,8652,9541,0341,0302,06458,998 94.8%97.2%2,9732,9071,6141,6433,25797,000 97.0% 97.8% 1,971 1,955 1,203 1,242 2,445 63,000 92.1%95.6%$3,165$3,191 $20,048 $22,851$42,899$1,270,998 95.1%96.2%$3,222$3,183$4,731$4,779$9,510$192,000 91.5%94.9%3,2263,2011,6891,9073,59682,000 97.2%97.2%2,2962,31939540680130,192 90.0%92.3%3,2423,2055426391,18134,725 96.6%96.6%3,2303,27128131960018,200 91.3%97.4%2,7132,7461,7211,7523,47396,010 92.8% 95.9% 2,284 2,251 3,249 3,222 6,471 161,500 93.3%96.0%$2,804$2,784 $12,608 $13,024$25,632$614,627 Total Residential Operating Communities (3) 76.1%6,5245,678,854870 92.6%95.7%$3,020$3,028 $32,656 $35,875$68,531$1,885,625 Year Operating Hotels Location Ownership Keys Complete Envue, Autograph CollectionWeehawken, NJ100.0%2082019 Residence Inn at Port ImperialWeehawken, NJ100.0%164 2018 Marriott Hotels at Port Imperial100.0%372 AverageAverage Occupancy OccupancyADRADRNOI*NOI*NOI*Debt 2Q 2020 1Q 2020 2Q 2020 1Q 2020 2Q 2020 1Q 2020 YTD 2020 Balance N/A46.4%N/A$153($919)($529) ($1,448) 70.0% 60.4% 97 124 (41) (158) (199) 70.0%52.6%$97$140($960)($687) ($1,647)$94,000
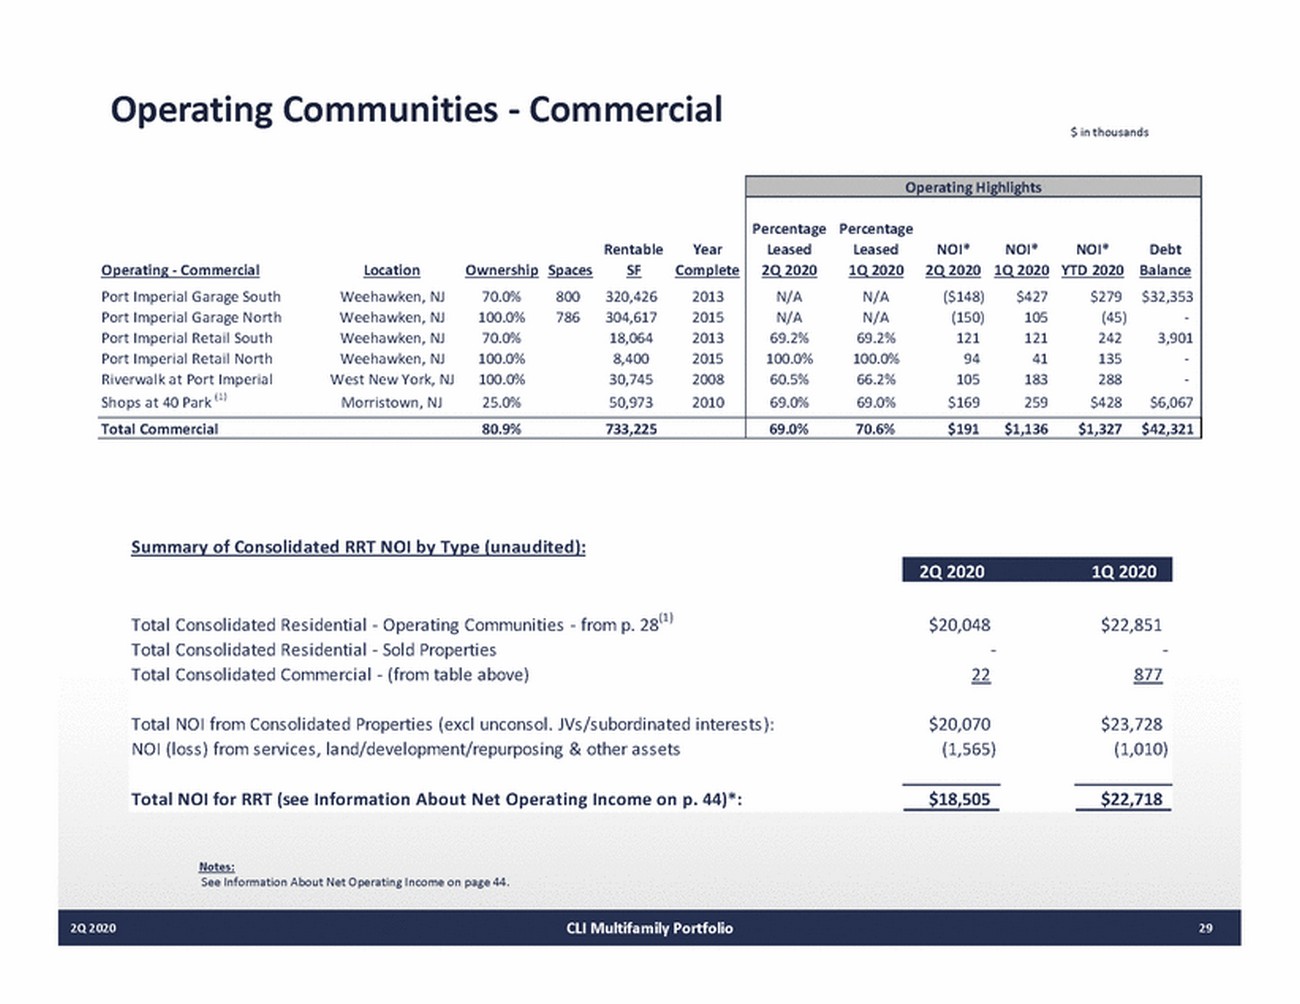
Operating Communities Commercial $ in thousands Summary of Consolidated RRT NOI by Type (unaudited): Total Consolidated Residential Operating Communities from p. 28(1) Total Consolidated Residential Sold Properties Total Consolidated Commercial (from table above) $20,048 22 $22,851 877 Total NOI from Consolidated Properties (excl unconsol. JVs/subordinated interests): NOI (loss) from services, land/development/repurposing & other assets $20,070 (1,565) $23,728 (1,010) Total NOI for RRT (see Information About Net Operating Income on p. 44)*: $18,505 $22,718 Notes: See Information About Net Operating Income on page 44. 2Q 2020CLI Multifamily Portfolio29 2Q 20201Q 2020 RentableYear Operating Commercial Location Ownership Spaces SF Complete Port Imperial Garage South Weehawken, NJ 70.0% 800 320,426 2013 Port Imperial Garage North Weehawken, NJ 100.0% 786 304,617 2015 Port Imperial Retail South Weehawken, NJ 70.0% 18,064 2013 Port Imperial Retail North Weehawken, NJ 100.0% 8,400 2015 Riverwalk at Port Imperial West New York, NJ 100.0% 30,745 2008 Shops at 40 Park (1) Morristown, NJ 25.0% 50,973 2010 Operating Highlights Percentage Percentage Leased Leased NOI* NOI* NOI* Debt 2Q 2020 1Q 2020 2Q 2020 1Q 2020 YTD 2020 Balance N/A N/A ($148) $427 $279 $32,353 N/A N/A (150) 105 (45) 69.2% 69.2% 121 121 242 3,901 100.0% 100.0% 94 41 135 60.5% 66.2% 105 183 288 69.0% 69.0% $169 259 $428 $6,067 Total Commercial 80.9% 733,225 69.0% 70.6% $191 $1,136 $1,327 $42,321
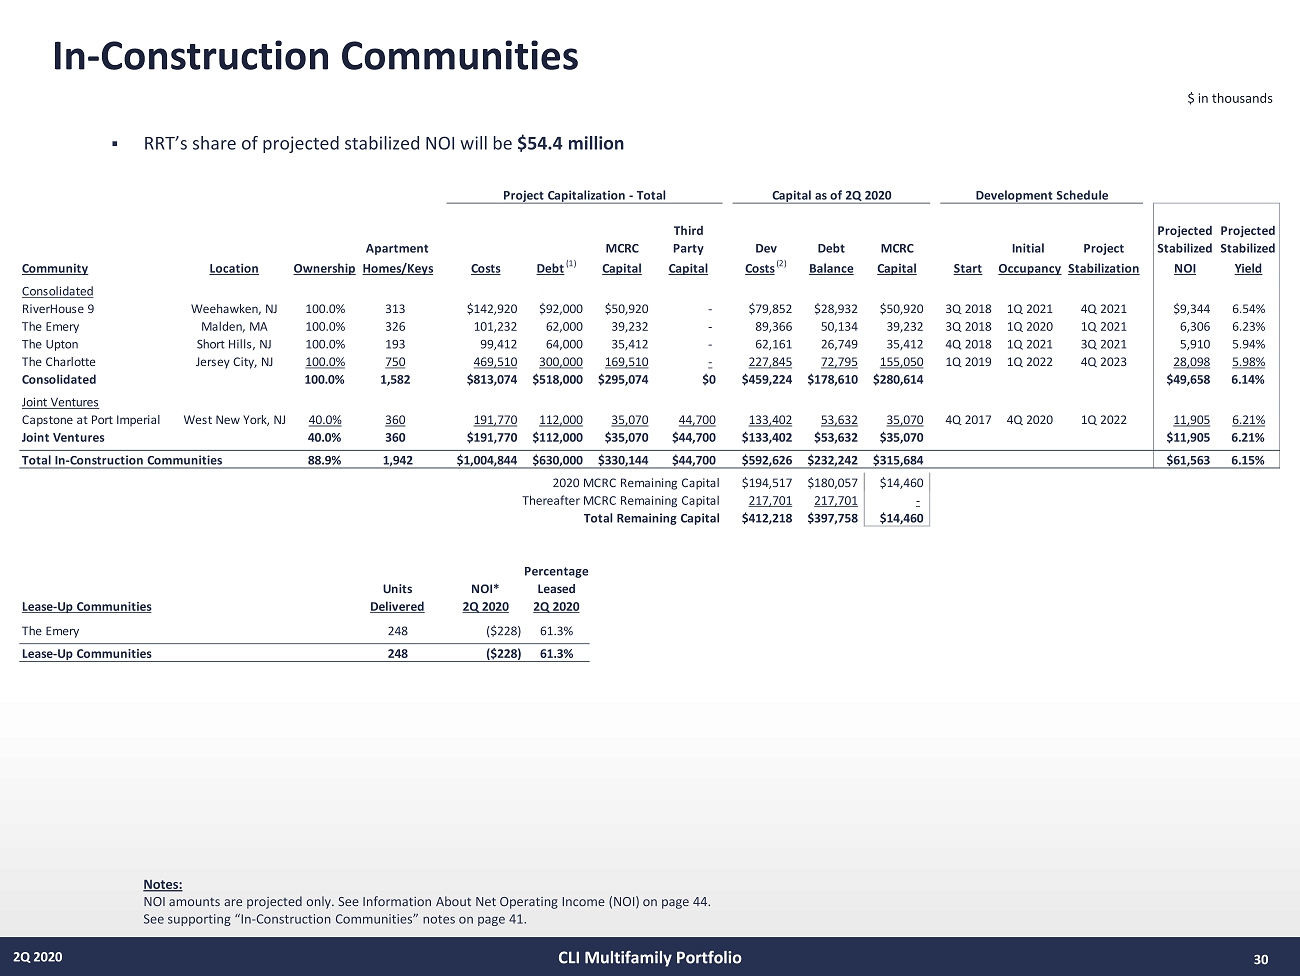
In - Construction Communities 30 2Q 2020 ▪ RRT’s share of projected stabilized NOI will be $ 54 . 4 million $ in thousands Notes: NOI amounts are projected only. See Information About Net Operating Income (NOI) on page 44. See supporting “In - Construction Communities” notes on page 41. CLI Multifamily Portfolio Third Projected Projected Apartment MCRC Party Dev Debt MCRC Initial Project Stabilized Stabilized Community Location OwnershipHomes/Keys Costs Debt (1) Capital Capital Costs (2) Balance Capital Start OccupancyStabilization NOI Yield Consolidated RiverHouse 9 Weehawken, NJ 100.0% 313 $142,920 $92,000 $50,920 - $79,852 $28,932 $50,920 3Q 2018 1Q 2021 4Q 2021 $9,344 6.54% The Emery Malden, MA 100.0% 326 101,232 62,000 39,232 - 89,366 50,134 39,232 3Q 2018 1Q 2020 1Q 2021 6,306 6.23% The Upton Short Hills, NJ 100.0% 193 99,412 64,000 35,412 - 62,161 26,749 35,412 4Q 2018 1Q 2021 3Q 2021 5,910 5.94% The Charlotte Jersey City, NJ 100.0% 750 469,510 300,000 169,510 - 227,845 72,795 155,050 1Q 2019 1Q 2022 4Q 2023 28,098 5.98% Consolidated 100.0% 1,582 $813,074 $518,000 $295,074 $0 $459,224 $178,610 $280,614 $49,658 6.14% Joint Ventures Capstone at Port Imperial West New York, NJ 40.0% 360 191,770 112,000 35,070 44,700 133,402 53,632 35,070 4Q 2017 4Q 2020 1Q 2022 11,905 6.21% Joint Ventures 40.0% 360 $191,770 $112,000 $35,070 $44,700 $133,402 $53,632 $35,070 $11,905 6.21% Total In-Construction Communities 88.9% 1,942 $1,004,844 $630,000 $330,144 $44,700 $592,626 $232,242 $315,684 $61,563 6.15% 2020 MCRC Remaining Capital $194,517 $180,057 $14,460 Thereafter MCRC Remaining Capital 217,701 217,701 - Total Remaining Capital $412,218 $397,758 $14,460 Percentage Units NOI* Leased Lease-Up Communities Delivered 2Q 2020 2Q 2020 The Emery 248 ($228) 61.3% Lease-Up Communities 248 ($228) 61.3% Project Capitalization - Total Capital as of 2Q 2020 Development Schedule
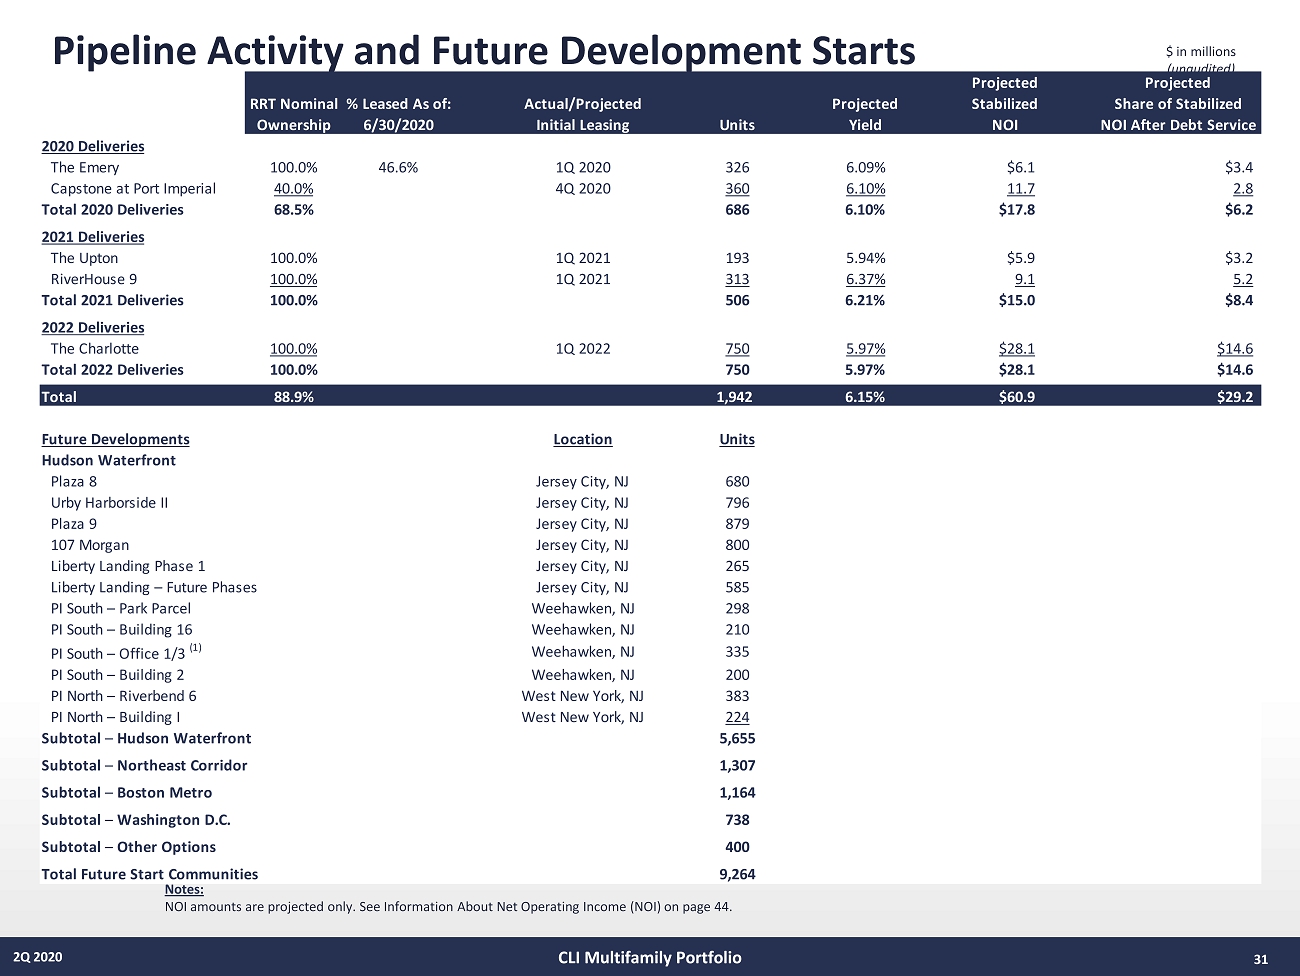
2015/2016 Achievements - Development Pipeline Activity and Future Development Starts 2Q 2020 Notes: NOI amounts are projected only. See Information About Net Operating Income (NOI) on page 44. $ in millions (unaudited) 31 CLI Multifamily Portfolio Projected Projected RRT Nominal% Leased As of: Actual/Projected Projected Stabilized Share of Stabilized Ownership 6/30/2020 Initial Leasing Units Yield NOI NOI After Debt Service 2020 Deliveries The Emery 100.0% 46.6% 1Q 2020 326 6.09% $6.1 $3.4 Capstone at Port Imperial 40.0% 4Q 2020 360 6.10% 11.7 2.8 Total 2020 Deliveries 68.5% 686 6.10% $17.8 $6.2 2021 Deliveries The Upton 100.0% 1Q 2021 193 5.94% $5.9 $3.2 RiverHouse 9 100.0% 1Q 2021 313 6.37% 9.1 5.2 Total 2021 Deliveries 100.0% 506 6.21% $15.0 $8.4 2022 Deliveries The Charlotte 100.0% 1Q 2022 750 5.97% $28.1 $14.6 Total 2022 Deliveries 100.0% 750 5.97% $28.1 $14.6 Total 88.9% 1,942 6.15% $60.9 $29.2 Future Developments Location Units Hudson Waterfront Plaza 8 Jersey City, NJ 680 Urby Harborside II Jersey City, NJ 796 Plaza 9 Jersey City, NJ 879 107 Morgan Jersey City, NJ 800 Liberty Landing Phase 1 Jersey City, NJ 265 Liberty Landing – Future Phases Jersey City, NJ 585 PI South – Park Parcel Weehawken, NJ 298 PI South – Building 16 Weehawken, NJ 210 PI South – Office 1/3 (1) Weehawken, NJ 335 PI South – Building 2 Weehawken, NJ 200 PI North – Riverbend 6 West New York, NJ 383 PI North – Building I West New York, NJ 224 Subtotal – Hudson Waterfront 5,655 Subtotal – Northeast Corridor 1,307 Subtotal – Boston Metro 1,164 Subtotal – Washington D.C. 738 Subtotal – Other Options 400 Total Future Start Communities 9,264
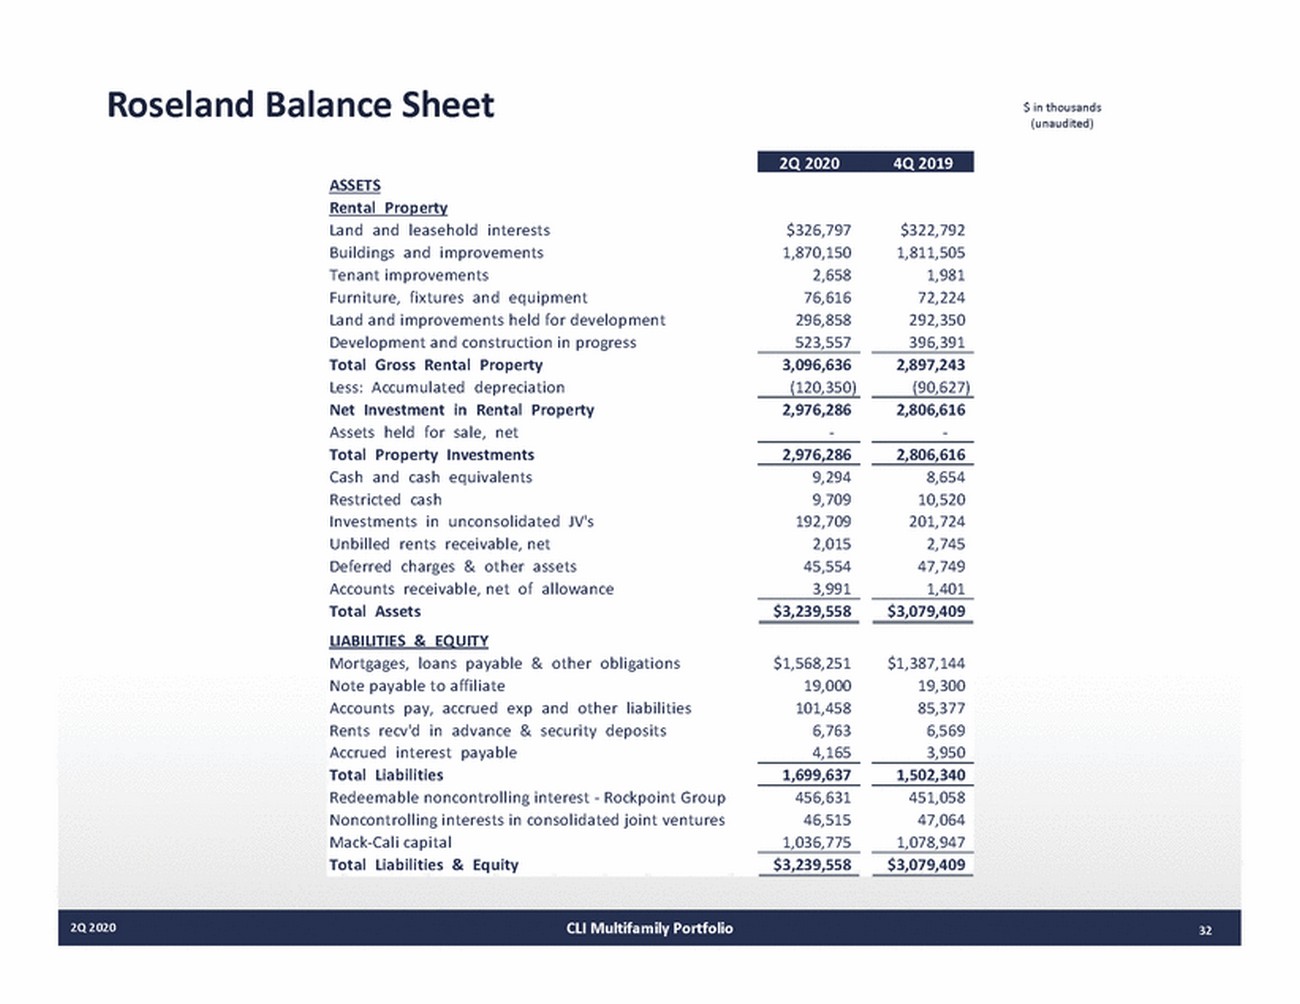
Roseland Balance Sheet $ in thousands (unaudited) ASSETS Rental Property Land and leasehold interests Buildings and improvements Tenant improvements Furniture, fixtures and equipment Land and improvements held for development Development and construction in progress Total Gross Rental Property Less: Accumulated depreciation Net Investment in Rental Property Assets held for sale, net Total Property Investments Cash and cash equivalents Restricted cash $326,797 1,870,150 2,658 76,616 296,858 523,557 $322,792 1,811,505 1,981 72,224 292,350 396,391 3,096,636 (120,350) 2,897,243 (90,627) 2,976,286 2,806,616 2,976,286 2,806,616 9,294 9,709 192,709 2,015 45,554 3,991 8,654 10,520 201,724 2,745 47,749 1,401 Investments in unconsolidated Unbilled rents receivable, net JV's Deferred charges & other assets Accounts receivable, net of allowance Total Assets LIABILITIES & EQUITY $3,239,558 $3,079,409 Mortgages, loans payable Note payable to affiliate & other obligations $1,568,251 19,000 101,458 6,763 4,165 $1,387,144 19,300 85,377 6,569 3,950 Accounts pay, accrued exp and other liabilities Rents recv'd in advance & Accrued interest payable Total Liabilities security deposits 1,699,637 1,502,340 Redeemable noncontrolling interest Rockpoint Group Noncontrolling interests in consolidated joint ventures MackCali capital Total Liabilities & Equity 456,631 46,515 1,036,775 451,058 47,064 1,078,947 $3,239,558 $3,079,409 2Q 2020CLI Multifamily Portfolio32 2Q 20204Q 2019
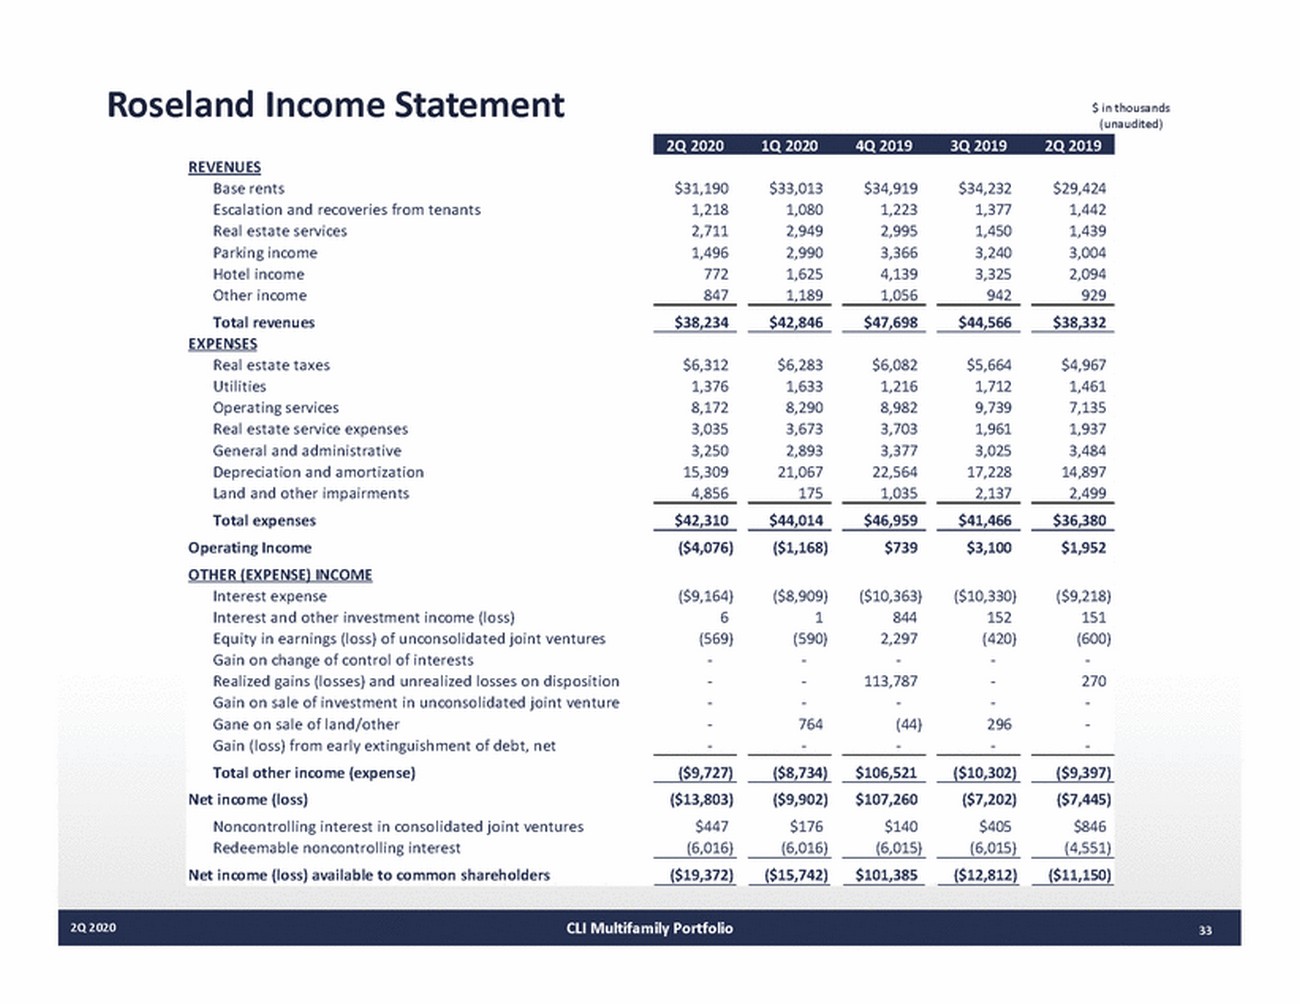
Roseland Income Statement REVENUES Base rents Escalation and recoveries from tenants Real estate services Parking income Hotel income Other income Total revenues EXPENSES Real estate taxes Utilities Operating services Real estate service expenses General and administrative Depreciation and amortization Land and other impairments Total expenses Operating Income OTHER (EXPENSE) INCOME $ in thousands (unaudited) $31,190 1,218 2,711 1,496 772 847 $33,013 1,080 2,949 2,990 1,625 1,189 $34,919 1,223 2,995 3,366 4,139 1,056 $34,232 1,377 1,450 3,240 3,325 942 $29,424 1,442 1,439 3,004 2,094 929 $38,234 $42,846 $47,698 $44,566 $38,332 $6,312 1,376 8,172 3,035 3,250 15,309 4,856 $6,283 1,633 8,290 3,673 2,893 21,067 175 $6,082 1,216 8,982 3,703 3,377 22,564 1,035 $5,664 1,712 9,739 1,961 3,025 17,228 2,137 $4,967 1,461 7,135 1,937 3,484 14,897 2,499 $42,310 $44,014 $46,959 $41,466 $36,380 ($4,076) ($1,168) $739 $3,100 $1,952 Interest expense Interest and other investment income (loss) Equity in earnings (loss) of unconsolidated joint ventures Gain on change of control of interests Realized gains (losses) and unrealized losses on disposition Gain on sale of investment in unconsolidated joint venture Gane on sale of land/other Gain (loss) from early extinguishment of debt, net Total other income (expense) Net income (loss) Noncontrolling interest in consolidated joint ventures Redeemable noncontrolling interest Net income (loss) available to common shareholders ($9,164) 6 (569) ($8,909) 1 (590) 764 ($10,363) 844 2,297 113,787 (44) ($10,330) 152 (420) 296 ($9,218) 151 (600) 270 ($9,727) ($8,734) $106,521 ($10,302) ($9,397) ($13,803) $447 (6,016) ($9,902) $176 (6,016) $107,260 $140 (6,015) ($7,202) $405 (6,015) ($7,445) $846 (4,551) ($19,372) ($15,742) $101,385 ($12,812) ($11,150) 2Q 2020CLI Multifamily Portfolio33 2Q 20201Q 20204Q 20193Q 20192Q 2019

Office Portfolio 2Q 202034
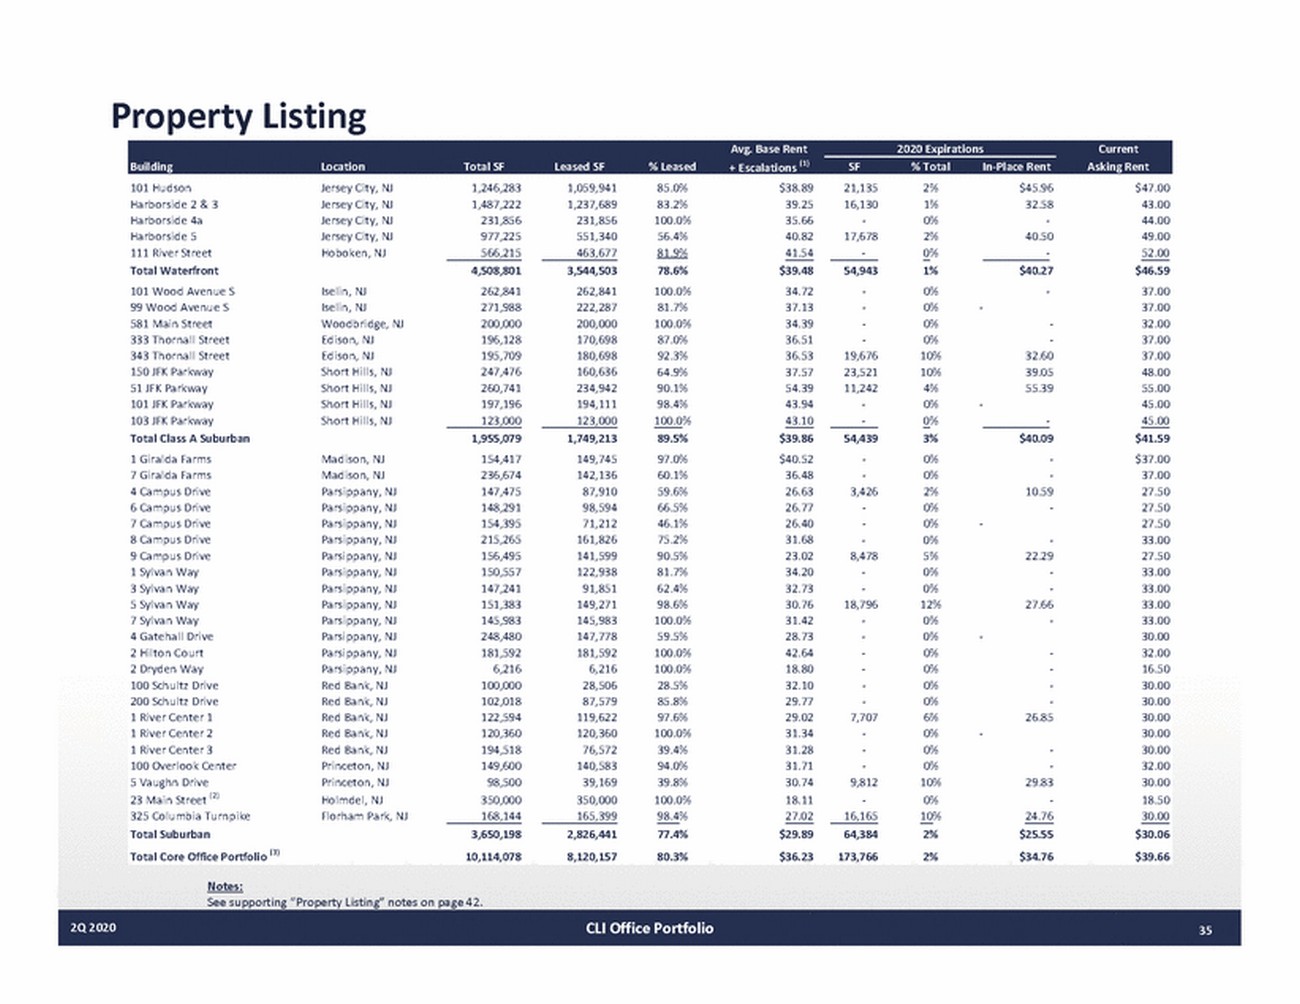
Property Listing 101 Hudson Harborside 2 & 3 Harborside 4a Harborside 5 111 River Street Total Waterfront 101 Wood Avenue S 99 Wood Avenue S 581 Main Street 333 Thornall Street 343 Thornall Street 150 JFK Parkway 51 JFK Parkway 101 JFK Parkway 103 JFK Parkway Total Class A Suburban 1 Giralda Farms 7 Giralda Farms 4 Campus Drive 6 Campus Drive 7 Campus Drive 8 Campus Drive 9 Campus Drive 1 Sylvan Way 3 Sylvan Way 5 Sylvan Way 7 Sylvan Way 4 Gatehall Drive 2 Hilton Court 2 Dryden Way 100 Schultz Drive 200 Schultz Drive 1 River Center 1 1 River Center 2 1 River Center 3 100 Overlook Center 5 Vaughn Drive 23 Main Street (2) 325 Columbia Turnpike Total Suburban Total Core Office Portfolio (3) Notes: Jersey City, NJ Jersey City, NJ Jersey City, NJ Jersey City, NJ Hoboken, NJ 1,246,283 1,487,222 231,856 977,225 566,215 1,059,941 1,237,689 231,856 551,340 463,677 85.0% 83.2% 100.0% 56.4% 81.9% 78.6% 100.0% 81.7% 100.0% 87.0% 92.3% 64.9% 90.1% 98.4% 100.0% 89.5% 97.0% 60.1% 59.6% 66.5% 46.1% 75.2% 90.5% 81.7% 62.4% 98.6% 100.0% 59.5% 100.0% 100.0% 28.5% 85.8% 97.6% 100.0% 39.4% 94.0% 39.8% 100.0% 98.4% 77.4% 80.3% $38.89 39.25 35.66 40.82 41.54 $39.48 34.72 37.13 34.39 36.51 36.53 37.57 54.39 43.94 43.10 $39.86 $40.52 36.48 26.63 26.77 26.40 31.68 23.02 34.20 32.73 30.76 31.42 28.73 42.64 18.80 32.10 29.77 29.02 31.34 31.28 31.71 30.74 18.11 27.02 $29.89 $36.23 21,135 16,130 17,678 2% 1% 0% 2% 0% $45.96 32.58 40.50 $47.00 43.00 44.00 49.00 52.00 $46.59 37.00 37.00 32.00 37.00 37.00 48.00 55.00 45.00 45.00 $41.59 $37.00 37.00 27.50 27.50 27.50 33.00 27.50 33.00 33.00 33.00 33.00 30.00 32.00 16.50 30.00 30.00 30.00 30.00 30.00 32.00 30.00 18.50 30.00 $30.06 $39.66 4,508,801 262,841 271,988 200,000 196,128 195,709 247,476 260,741 197,196 123,000 3,544,503 262,841 222,287 200,000 170,698 180,698 160,636 234,942 194,111 123,000 54,943 19,676 23,521 11,242 1% 0% 0% 0% 0% 10% 10% 4% 0% 0% $40.27 Iselin, NJ Iselin, NJ Woodbridge, NJ Edison, NJ Edison, NJ Short Hills, NJ Short Hills, NJ Short Hills, NJ Short Hills, NJ 32.60 39.05 55.39 1,955,079 154,417 236,674 147,475 148,291 154,395 215,265 156,495 150,557 147,241 151,383 145,983 248,480 181,592 6,216 100,000 102,018 122,594 120,360 194,518 149,600 98,500 350,000 168,144 1,749,213 149,745 142,136 87,910 98,594 71,212 161,826 141,599 122,938 91,851 149,271 145,983 147,778 181,592 6,216 28,506 87,579 119,622 120,360 76,572 140,583 39,169 350,000 165,399 54,439 3,426 8,478 18,796 7,707 9,812 16,165 3% 0% 0% 2% 0% 0% 0% 5% 0% 0% 12% 0% 0% 0% 0% 0% 0% 6% 0% 0% 0% 10% 0% 10% 2% 2% $40.09 10.59 Madison, NJ Madison, NJ Parsippany, NJ Parsippany, NJ Parsippany, NJ Parsippany, NJ Parsippany, NJ Parsippany, NJ Parsippany, NJ Parsippany, NJ Parsippany, NJ Parsippany, NJ Parsippany, NJ Parsippany, NJ Red Bank, NJ Red Bank, NJ Red Bank, NJ Red Bank, NJ Red Bank, NJ Princeton, NJ Princeton, NJ Holmdel, NJ Florham Park, NJ 22.29 27.66 26.85 29.83 24.76 $25.55 $34.76 3,650,198 10,114,078 2,826,441 8,120,157 64,384 173,766 See supporting “Property Listing” notes on page 42. 2Q 2020CLI Office Portfolio35 Avg. Base Rent2020 Expirations Current BuildingLocation Total SFLeased SF% Leased + Escalations (1)SF% TotalInPlace RentAsking Rent
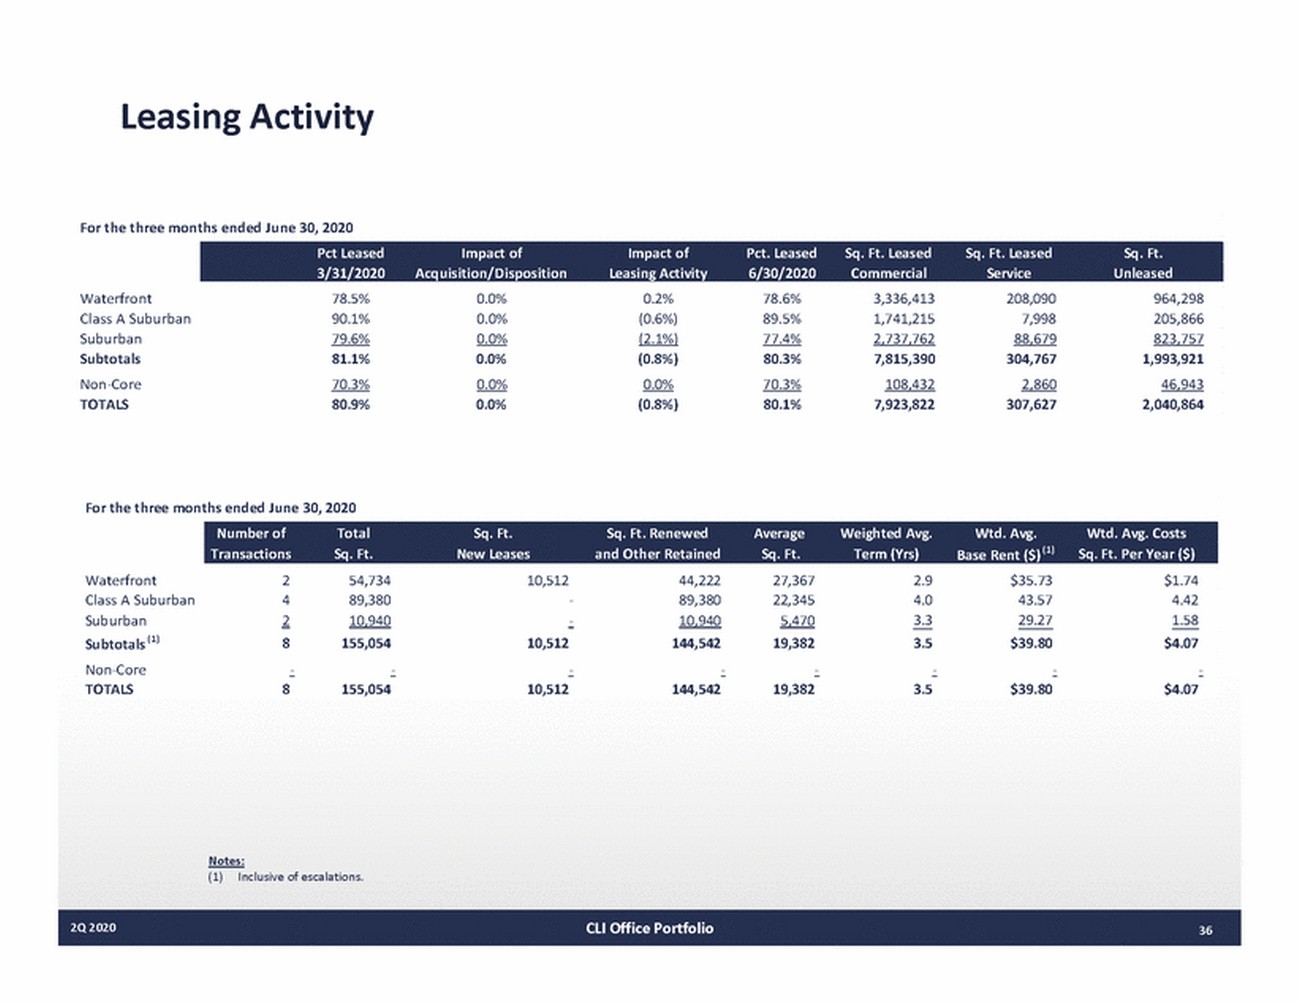
Leasing Activity For the three months ended June 30, 2020 Waterfront Class A Suburban Suburban Subtotals NonCore TOTALS 78.5% 90.1% 79.6% 81.1% 70.3% 80.9% 0.0% 0.0% 0.0% 0.0% 0.0% 0.0% 0.2% (0.6%) (2.1%) (0.8%) 0.0% (0.8%) 78.6% 89.5% 77.4% 80.3% 70.3% 80.1% 3,336,413 1,741,215 2,737,762 7,815,390 108,432 7,923,822 208,090 7,998 88,679 304,767 2,860 307,627 964,298 205,866 823,757 1,993,921 46,943 2,040,864 For the three months ended June 30, 2020 Waterfront Class A Suburban Suburban Subtotals (1) NonCore TOTALS 2 4 2 8 54,734 89,380 10,940 155,054 10,512 44,222 89,380 10,940 144,542 27,367 22,345 5,470 19,382 2.9 4.0 3.3 3.5 $35.73 43.57 29.27 $39.80 $1.74 4.42 1.58 $4.07 10,512 8 155,054 10,512 144,542 19,382 3.5 $39.80 $4.07 Notes: (1) Inclusive of escalations. 2Q 2020CLI Office Portfolio36 Number of Total Sq. Ft. Sq. Ft. Renewed Average Weighted Avg. Wtd. Avg. Wtd. Avg. Costs Transactions Sq. Ft. New Leases and Other Retained Sq. Ft. Term (Yrs) Base Rent ($) (1)Sq. Ft. Per Year ($) Pct Leased Impact of Impact of Pct. Leased Sq. Ft. Leased Sq. Ft. Leased Sq. Ft. 3/31/2020 Acquisition/Disposition Leasing Activity 6/30/2020 Commercial Service Unleased
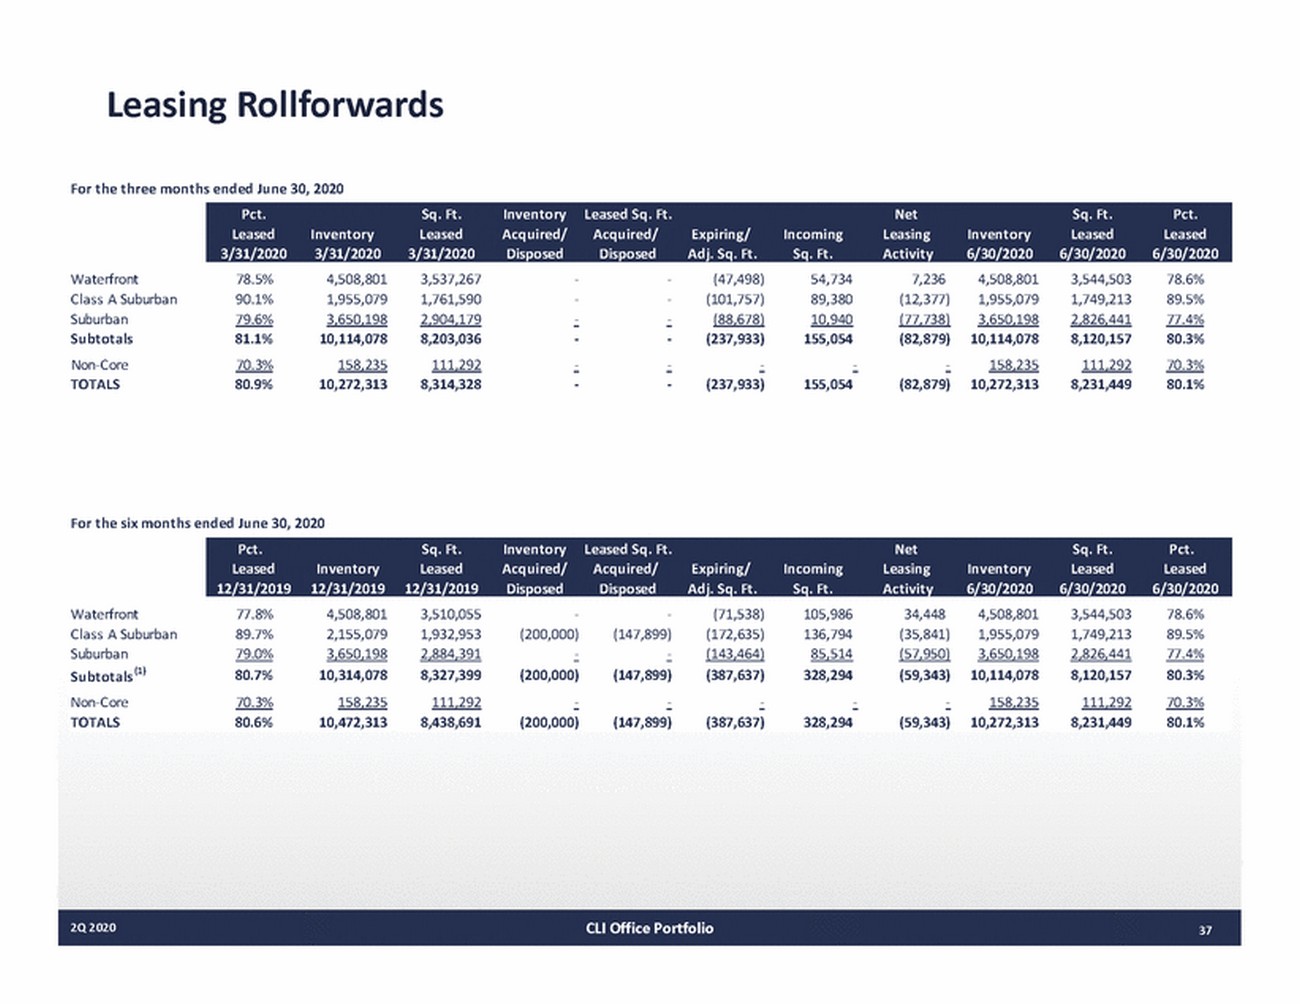
Leasing Rollforwards For the three months ended June 30, 2020 Waterfront Class A Suburban Suburban Subtotals NonCore TOTALS 78.5% 90.1% 79.6% 81.1% 70.3% 80.9% 4,508,801 1,955,079 3,650,198 10,114,078 158,235 10,272,313 3,537,267 1,761,590 2,904,179 8,203,036 111,292 8,314,328 (47,498) (101,757) (88,678) (237,933) 54,734 89,380 10,940 155,054 7,236 (12,377) (77,738) (82,879) 4,508,801 1,955,079 3,650,198 10,114,078 158,235 10,272,313 3,544,503 1,749,213 2,826,441 8,120,157 111,292 8,231,449 78.6% 89.5% 77.4% 80.3% 70.3% 80.1% (237,933) 155,054 (82,879) For the six months ended June 30, 2020 Waterfront Class A Suburban Suburban Subtotals (1) NonCore TOTALS 77.8% 89.7% 79.0% 80.7% 70.3% 80.6% 4,508,801 2,155,079 3,650,198 10,314,078 158,235 10,472,313 3,510,055 1,932,953 2,884,391 8,327,399 111,292 8,438,691 (200,000) (147,899) (71,538) (172,635) (143,464) (387,637) 105,986 136,794 85,514 328,294 34,448 (35,841) (57,950) (59,343) 4,508,801 1,955,079 3,650,198 10,114,078 158,235 10,272,313 3,544,503 1,749,213 2,826,441 8,120,157 111,292 8,231,449 78.6% 89.5% 77.4% 80.3% 70.3% 80.1% (200,000) (147,899) (200,000) (147,899) (387,637) 328,294 (59,343) 2Q 2020CLI Office Portfolio37 Pct. Sq. Ft. Inventory Leased Sq. Ft. Net Sq. Ft. Pct. Leased Inventory Leased Acquired/ Acquired/ Expiring/ Incoming Leasing Inventory Leased Leased 12/31/2019 12/31/2019 12/31/2019 Disposed Disposed Adj. Sq. Ft. Sq. Ft. Activity 6/30/2020 6/30/2020 6/30/2020 Pct. Sq. Ft. Inventory Leased Sq. Ft. Net Sq. Ft. Pct. Leased Inventory Leased Acquired/ Acquired/ Expiring/ Incoming Leasing Inventory Leased Leased 3/31/2020 3/31/2020 3/31/2020 Disposed Disposed Adj. Sq. Ft. Sq. Ft. Activity 6/30/2020 6/30/2020 6/30/2020
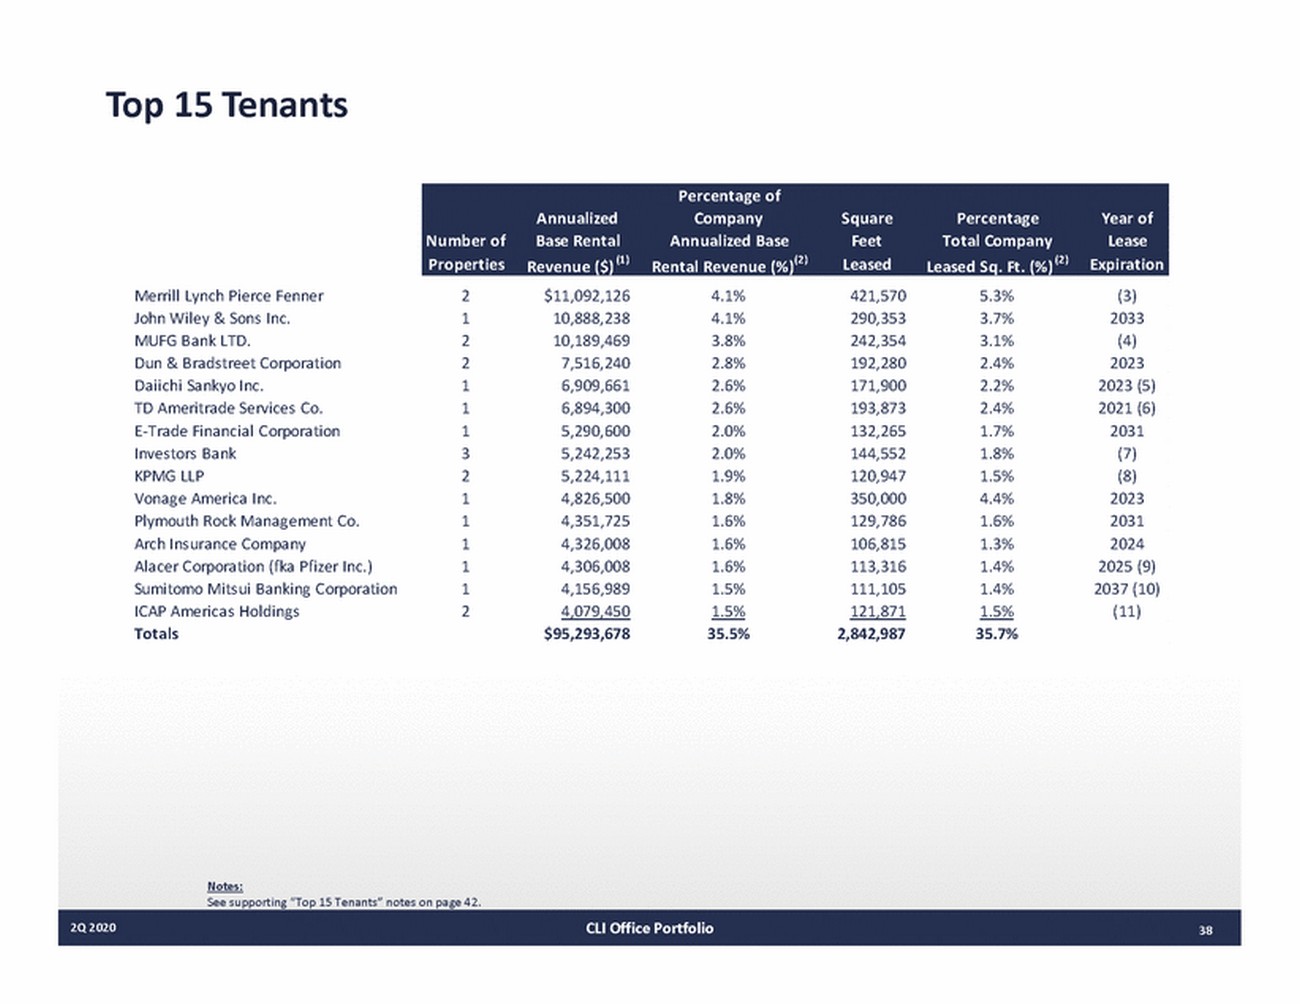
Top 15 Tenants Merrill Lynch Pierce Fenner John Wiley & Sons Inc. MUFG Bank LTD. Dun & Bradstreet Corporation Daiichi Sankyo Inc. TD Ameritrade Services Co. ETrade Financial Corporation Investors Bank KPMG LLP Vonage America Inc. Plymouth Rock Management Co. Arch Insurance Company Alacer Corporation (fka Pfizer Inc.) Sumitomo Mitsui Banking Corporation ICAP Americas Holdings Totals 2 1 2 2 1 1 1 3 2 1 1 1 1 1 2 $11,092,126 10,888,238 10,189,469 7,516,240 6,909,661 6,894,300 5,290,600 5,242,253 5,224,111 4,826,500 4,351,725 4,326,008 4,306,008 4,156,989 4,079,450 $95,293,678 4.1% 4.1% 3.8% 2.8% 2.6% 2.6% 2.0% 2.0% 1.9% 1.8% 1.6% 1.6% 1.6% 1.5% 1.5% 35.5% 421,570 290,353 242,354 192,280 171,900 193,873 132,265 144,552 120,947 350,000 129,786 106,815 113,316 111,105 121,871 2,842,987 5.3% 3.7% 3.1% 2.4% 2.2% 2.4% 1.7% 1.8% 1.5% 4.4% 1.6% 1.3% 1.4% 1.4% 1.5% 35.7% (3) 2033 (4) 2023 2023 (5) 2021 (6) 2031 (7) (8) 2023 2031 2024 2025 (9) 2037 (10) (11) Notes: See supporting “Top 15 Tenants” notes on page 42. 2Q 2020CLI Office Portfolio38 Percentage of AnnualizedCompany SquarePercentageYear of Number of Base RentalAnnualized BaseFeetTotal Company Lease PropertiesRevenue ($) (1) Rental Revenue (%)(2) LeasedLeased Sq. Ft. (%) (2) Expiration
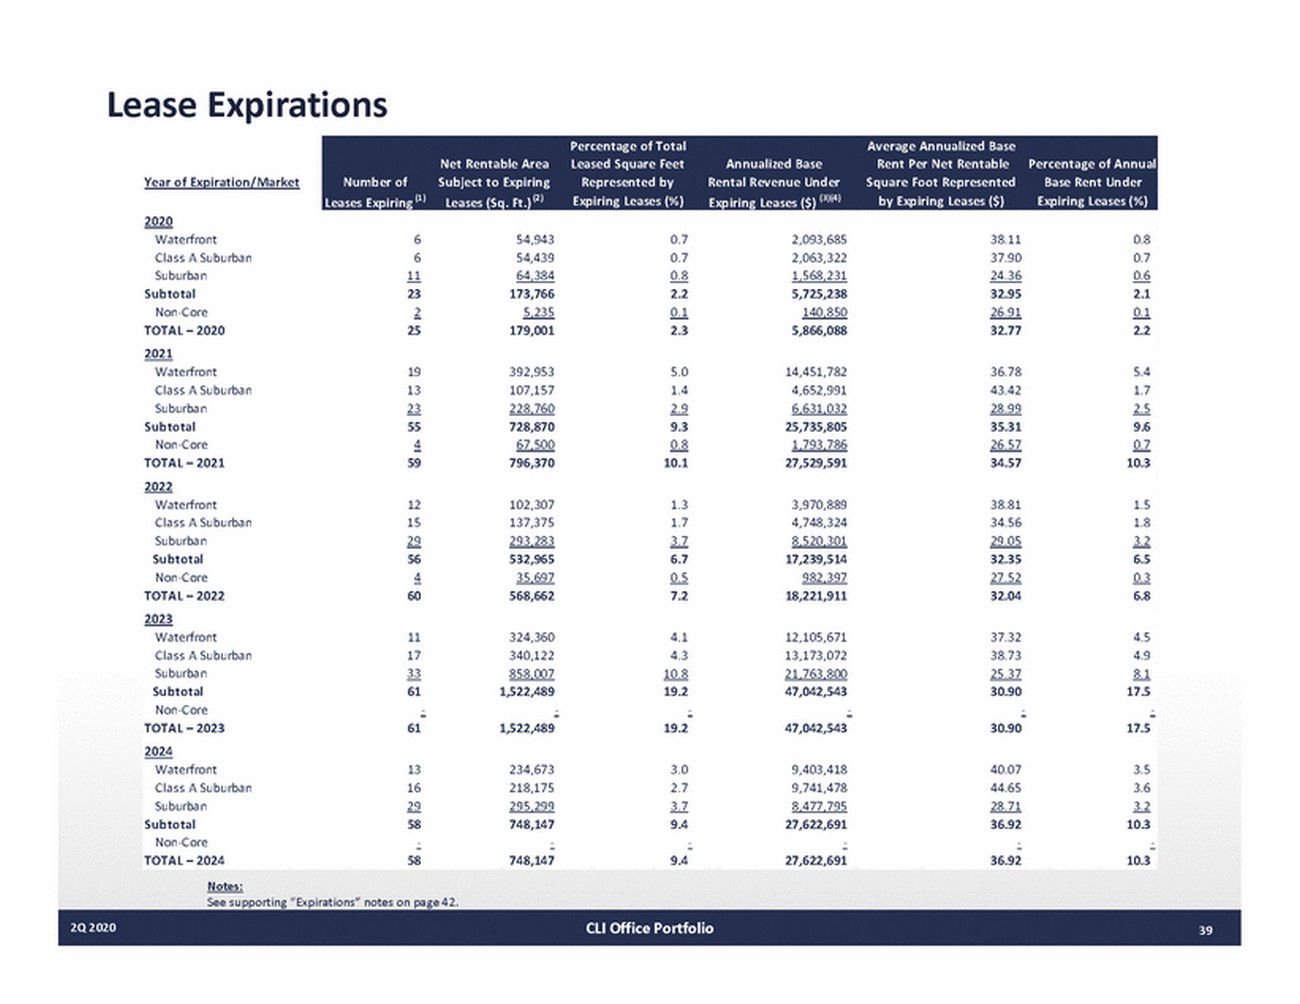
Lease Expirations Year of Expiration/Market 2020 Waterfront Class A Suburban Suburban Subtotal NonCore TOTAL – 2020 2021 Waterfront Class A Suburban Suburban Subtotal NonCore TOTAL – 2021 2022 Waterfront Class A Suburban Suburban Subtotal NonCore TOTAL – 2022 2023 Waterfront Class A Suburban Suburban Subtotal NonCore TOTAL – 2023 2024 Waterfront Class A Suburban Suburban Subtotal NonCore TOTAL – 2024 6 6 11 23 2 25 54,943 54,439 64,384 173,766 5,235 179,001 0.7 0.7 0.8 2.2 0.1 2.3 2,093,685 2,063,322 1,568,231 5,725,238 140,850 5,866,088 38.11 37.90 24.36 32.95 26.91 32.77 0.8 0.7 0.6 2.1 0.1 2.2 19 13 23 55 4 59 392,953 107,157 228,760 728,870 67,500 796,370 5.0 1.4 2.9 9.3 0.8 10.1 14,451,782 4,652,991 6,631,032 25,735,805 1,793,786 27,529,591 36.78 43.42 28.99 35.31 26.57 34.57 5.4 1.7 2.5 9.6 0.7 10.3 12 15 29 56 4 60 102,307 137,375 293,283 532,965 35,697 568,662 1.3 1.7 3.7 6.7 0.5 7.2 3,970,889 4,748,324 8,520,301 17,239,514 982,397 18,221,911 38.81 34.56 29.05 32.35 27.52 32.04 1.5 1.8 3.2 6.5 0.3 6.8 11 17 33 61 324,360 340,122 858,007 1,522,489 4.1 4.3 10.8 19.2 12,105,671 13,173,072 21,763,800 47,042,543 37.32 38.73 25.37 30.90 4.5 4.9 8.1 17.5 61 1,522,489 19.2 47,042,543 30.90 17.5 13 16 29 58 234,673 218,175 295,299 748,147 3.0 2.7 3.7 9.4 9,403,418 9,741,478 8,477,795 27,622,691 40.07 44.65 28.71 36.92 3.5 3.6 3.2 10.3 58 748,147 9.4 27,622,691 36.92 10.3 Notes: See supporting “Expirations” notes on page 42. 2Q 2020CLI Office Portfolio39 Percentage of TotalAverage Annualized Base Net Rentable AreaLeased Square FeetAnnualized BaseRent Per Net RentablePercentage of Annual Number ofSubject to ExpiringRepresented byRental Revenue UnderSquare Foot RepresentedBase Rent Under Leases Expiring (1) Leases (Sq. Ft.) (2) Expiring Leases (%)Expiring Leases ($) (3)(4) by Expiring Leases ($)Expiring Leases (%)
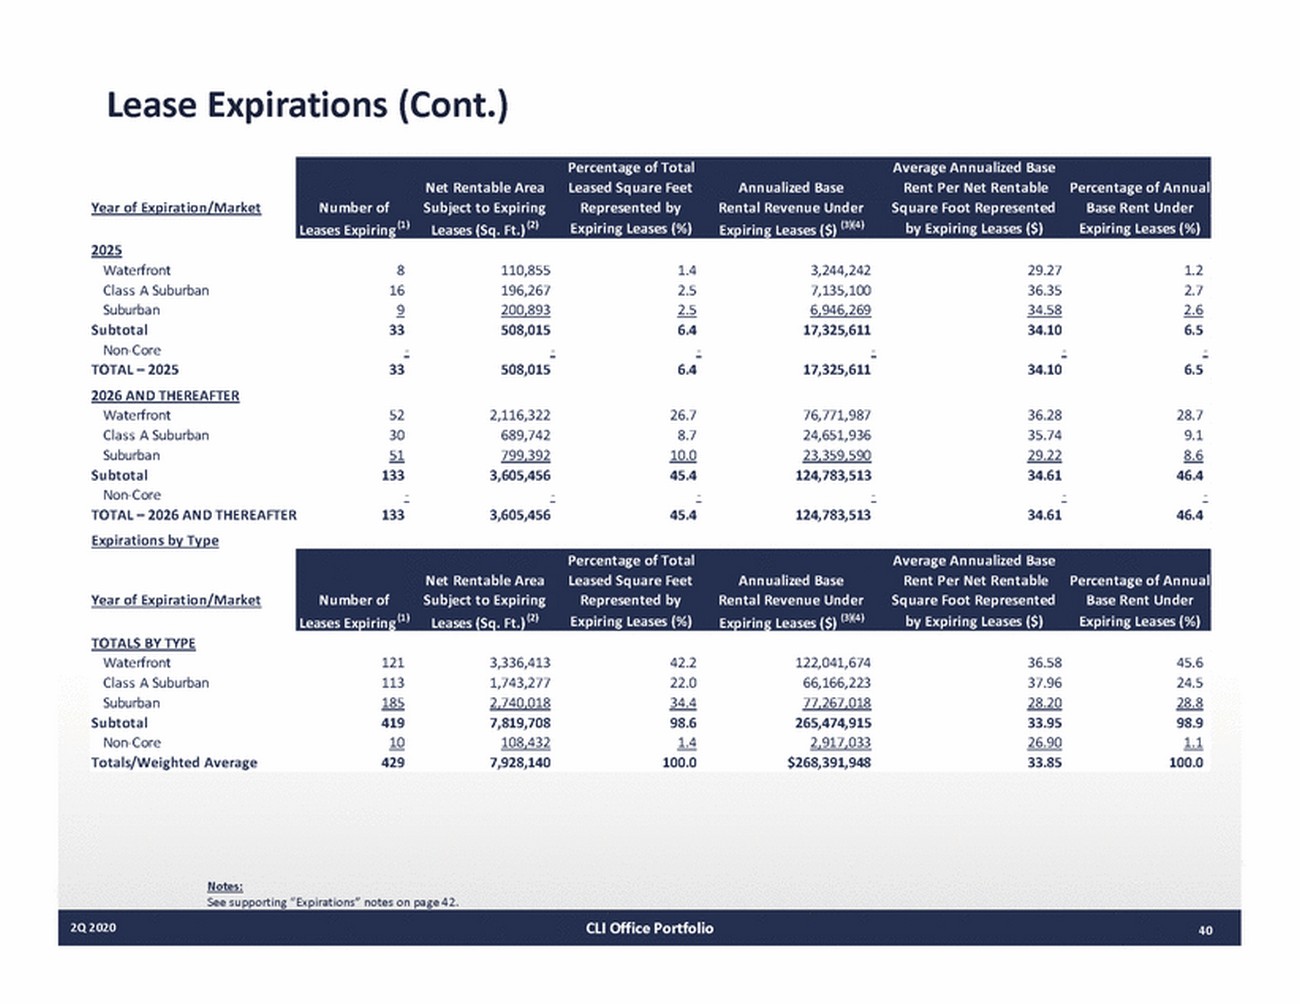
Lease Expirations (Cont.) Year of Expiration/Market 2025 Waterfront Class A Suburban Suburban Subtotal NonCore TOTAL – 2025 2026 AND THEREAFTER 8 16 9 33 110,855 196,267 200,893 508,015 1.4 2.5 2.5 6.4 3,244,242 7,135,100 6,946,269 17,325,611 29.27 36.35 34.58 34.10 1.2 2.7 2.6 6.5 33 508,015 6.4 17,325,611 34.10 6.5 Waterfront Class A Suburban Suburban Subtotal NonCore TOTAL – 2026 AND THEREAFTER 52 30 51 133 2,116,322 689,742 799,392 3,605,456 26.7 8.7 10.0 45.4 76,771,987 24,651,936 23,359,590 124,783,513 36.28 35.74 29.22 34.61 28.7 9.1 8.6 46.4 133 3,605,456 45.4 124,783,513 34.61 46.4 Expirations by Type Year of Expiration/Market TOTALS BY TYPE Waterfront Class A Suburban Suburban Subtotal NonCore Totals/Weighted Average 121 113 185 419 10 429 3,336,413 1,743,277 2,740,018 7,819,708 108,432 7,928,140 42.2 22.0 34.4 98.6 1.4 100.0 122,041,674 66,166,223 77,267,018 265,474,915 2,917,033 $268,391,948 36.58 37.96 28.20 33.95 26.90 33.85 45.6 24.5 28.8 98.9 1.1 100.0 Notes: See supporting “Expirations” notes on page 42. 2Q 2020CLI Office Portfolio40 Percentage of Total Average Annualized Base Net Rentable Area Leased Square Feet Annualized Base Rent Per Net Rentable Percentage of Annual Number of Subject to Expiring Represented by Rental Revenue Under Square Foot Represented Base Rent Under Leases Expiring (1) Leases (Sq. Ft.) (2) Expiring Leases (%) Expiring Leases ($) (3)(4) by Expiring Leases ($) Expiring Leases (%) Percentage of Total Average Annualized Base Net Rentable Area Leased Square Feet Annualized Base Rent Per Net Rentable Percentage of Annual Number of Subject to Expiring Represented by Rental Revenue Under Square Foot Represented Base Rent Under Leases Expiring (1) Leases (Sq. Ft.) (2) Expiring Leases (%) Expiring Leases ($) (3)(4) by Expiring Leases ($) Expiring Leases (%)
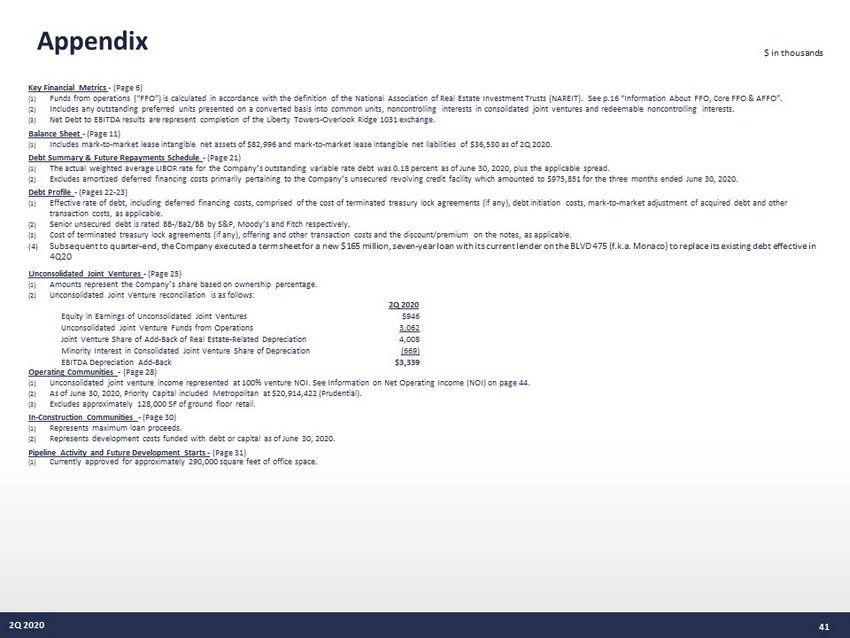
Appendix Key Financial Metrics (Page 6) $ in thousands (1)Funds from operations (“FFO”) is calculated in accordance with the definition of the National Association of Real Estate Investment Trusts (NAREIT). See p.16 “Information About FFO, Core FFO & AFFO”. (2)Includes any outstanding preferred units presented on a converted basis into common units, noncontrolling interests in consolidated joint ventures and redeemable noncontrolling interests. (3)Net Debt to EBITDA results are represent completion of the Liberty TowersOverlook Ridge 1031 exchange. Balance Sheet (Page 11) (1)Includes marktomarket lease intangible net assets of $82,996 and marktomarket lease intangible net liabilities of $36,530 as of 2Q 2020. Debt Summary & Future Repayments Schedule (Page 21) (1)The actual weighted average LIBOR rate for the Company’s outstanding variable rate debt was 0.18 percent as of June 30, 2020, plus the applicable spread. (2)Excludes amortized deferred financing costs primarily pertaining to the Company’s unsecured revolving credit facility which amounted to $975,851 for the three months ended June 30, 2020. Debt Profile (Pages 2223) (1)Effective rate of debt, including deferred financing costs, comprised of the cost of terminated treasury lock agreements (if any), debt initiation costs, marktomarket adjustment of acquired debt and other transaction costs, as applicable. (2)Senior unsecured debt is rated BB/Ba2/BB by S&P, Moody’s and Fitch respectively. (3)Cost of terminated treasury lock agreements (if any), offering and other transaction costs and the discount/premium on the notes, as applicable. (4)Subsequent to quarterend, the Company executed a term sheet for a new $165 million, sevenyear loan with its current lender on the BLVD 475 (f.k.a. Monaco) to replace its existing debt effective in 4Q20 Unconsolidated Joint Ventures (Page 25) (1)Amounts represent the Company’s share based on ownership percentage. (2)Unconsolidated Joint Venture reconciliation is as follows: 2Q 2020 Equity in Earnings of Unconsolidated Joint Ventures Unconsolidated Joint Venture Funds from Operations Joint Venture Share of AddBack of Real EstateRelated Depreciation Minority Interest in Consolidated Joint Venture Share of Depreciation EBITDA Depreciation AddBack Operating Communities (Page 28) $946 3,062 4,008 (669) $3,339 (1)Unconsolidated joint venture income represented at 100% venture NOI. See Information on Net Operating Income (NOI) on page 41. (2)As of June 30, 2020, Priority Capital included Metropolitan at $20,914,422 (Prudential). (3)Excludes approximately 128,000 SF of ground floor retail. InConstruction Communities (Page 30) (1)Represents maximum loan proceeds. (2)Represents development costs funded with debt or capital as of June 30, 2020. Pipeline Activity and Future Development Starts (Page 31) (1)Currently approved for approximately 290,000 square feet of office space. 2Q 202041
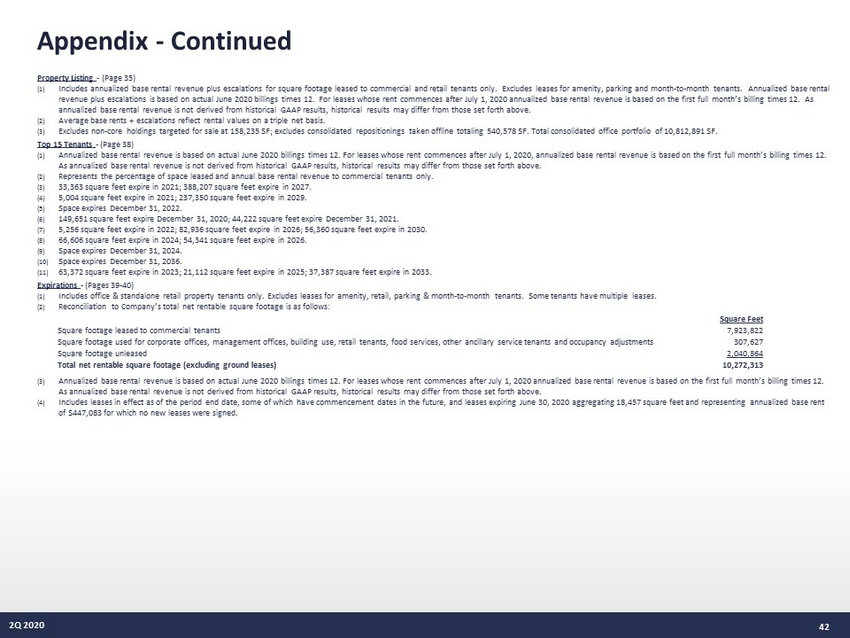
Appendix Continued Property Listing (Page 35) (1)Includes annualized base rental revenue plus escalations for square footage leased to commercial and retail tenants only. Excludes leases for amenity, parking and monthtomonth tenants. Annualized base rental revenue plus escalations is based on actual June 2020 billings times 12. For leases whose rent commences after July 1, 2020 annualized base rental revenue is based on the first full month’s billing times 12. As annualized base rental revenue is not derived from historical GAAP results, historical results may differ from those set forth above. (2)Average base rents + escalations reflect rental values on a triple net basis. (3)Excludes noncore holdings targeted for sale at 158,235 SF; excludes consolidated repositionings taken offline totaling 540,578 SF. Total consolidated office portfolio of 10,812,891 SF. Top 15 Tenants (Page 37) (1)Annualized base rental revenue is based on actual June 2020 billings times 12. For leases whose rent commences after July 1, 2020, annualized base rental revenue is based on the first full month’s billing times 12. As annualized base rental revenue is not derived from historical GAAP results, historical results may differ from those set forth above. (2)Represents the percentage of space leased and annual base rental revenue to commercial tenants only. (3)33,363 square feet expire in 2021; 388,207 square feet expire in 2027. (4)5,004 square feet expire in 2021; 237,350 square feet expire in 2029. (5)Space expires December 31, 2022. (6)149,651 square feet expire December 31, 2020; 44,222 square feet expire December 31, 2021. (7)5,256 square feet expire in 2022; 82,936 square feet expire in 2026; 56,360 square feet expire in 2030. (8)66,606 square feet expire in 2024; 54,341 square feet expire in 2026. (9)Space expires December 31, 2024. (10) Space expires December 31, 2036. (11) 63,372 square feet expire in 2023; 21,112 square feet expire in 2025; 37,387 square feet expire in 2033. Expirations (Pages 3940) (1)Includes office & standalone retail property tenants only. Excludes leases for amenity, retail, parking & monthtomonth tenants. Some tenants have multiple leases. (2)Reconciliation to Company’s total net rentable square footage is as follows: Square Feet Square footage leased to commercial tenants Square footage used for corporate offices, management offices, building use, retail tenants, food services, other ancillary service tenants and occupancy adjustments Square footage unleased Total net rentable square footage (excluding ground leases) 7,923,822 307,627 2,040,864 10,272,313 (3)Annualized base rental revenue is based on actual June 2020 billings times 12. For leases whose rent commences after July 1, 2020 annualized base rental revenue is based on the first full month’s billing times 12. As annualized base rental revenue is not derived from historical GAAP results, historical results may differ from those set forth above. (4)Includes leases in effect as of the period end date, some of which have commencement dates in the future, and leases expiring June 30, 2020 aggregating 18,457 square feet and representing annualized base rent of $447,083 for which no new leases were signed. 2Q 202042
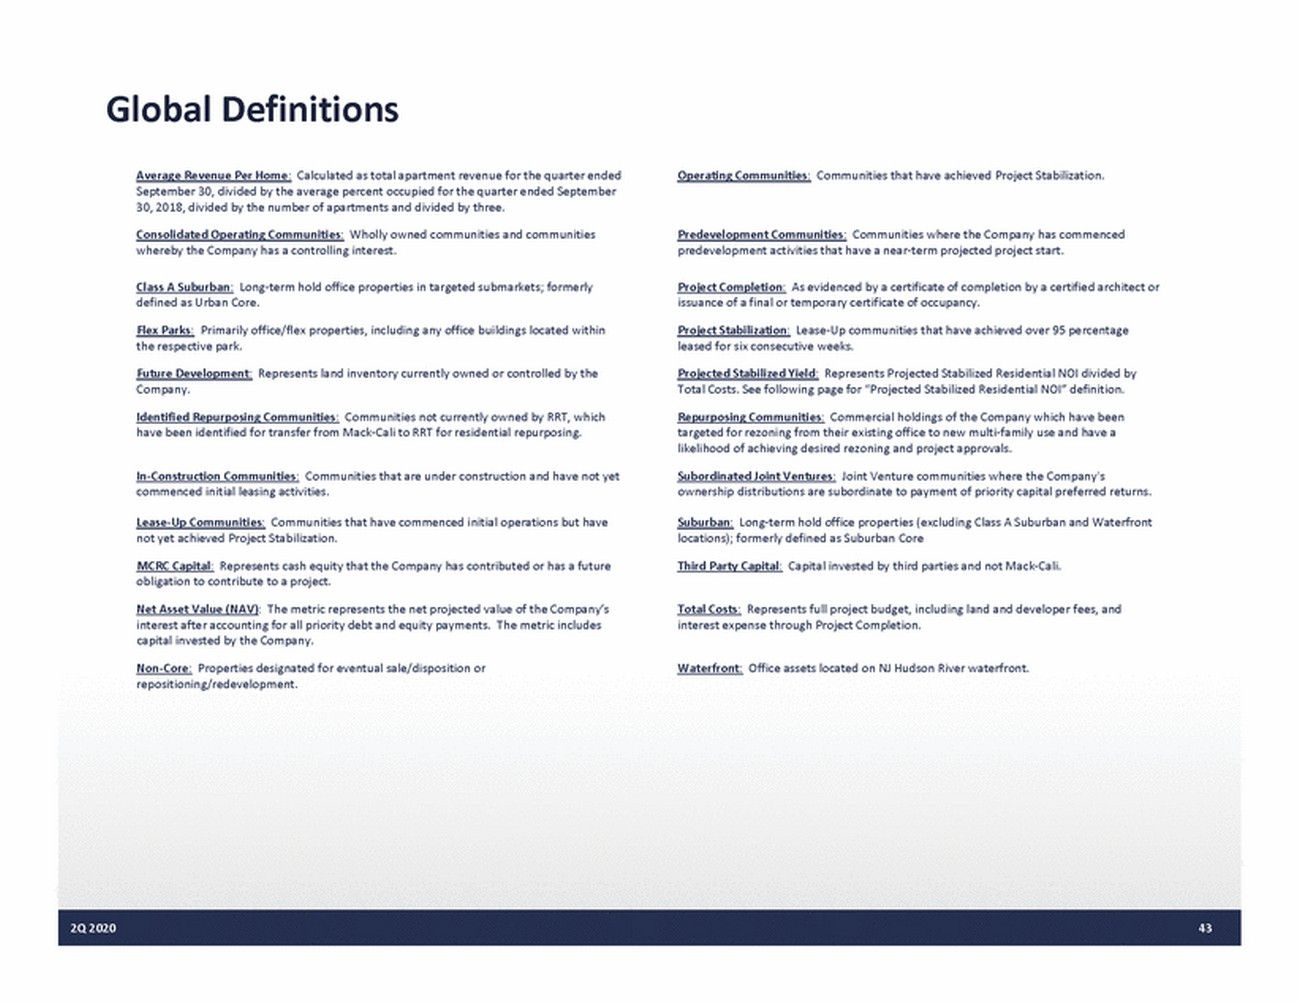
Global Definitions Average Revenue Per Home:Calculated as total apartment revenue for the quarter ended Operating Communities: Communities that have achieved Project Stabilization. September 30, divided by the average percent occupied for the quarter ended September 30, 2018, divided by the number of apartments and divided by three. Consolidated Operating Communities: Wholly owned communities and communities Predevelopment Communities: Communities where the Company has commenced whereby the Company has a controlling interest. predevelopment activities that have a nearterm projected project start. Class A Suburban:Longterm hold office properties in targeted submarkets; formerly Project Completion:As evidenced by a certificate of completion by a certified architect or defined as Urban Core. Flex Parks: Primarily office/flex properties, including any office buildings located within issuance of a final or temporary certificate of occupancy. Project Stabilization:LeaseUp communities that have achieved over 95 percentage the respective park. leased for six consecutive weeks. Future Development:Represents land inventory currently owned or controlled by the Projected Stabilized Yield:Represents Projected Stabilized Residential NOI divided by Company. Identified Repurposing Communities: Communities not currently owned by RRT, which Total Costs. See following page for “Projected Stabilized Residential NOI” definition. Repurposing Communities: Commercial holdings of the Company which have been have been identified for transfer from MackCali to RRT for residential repurposing. targeted for rezoning from their existing office to new multifamily use and have a likelihood of achieving desired rezoning and project approvals. Subordinated Joint Ventures:Joint Venture communities where the Company's InConstruction Communities: Communities that are under construction and have not yet commenced initial leasing activities. ownership distributions are subordinate to payment of priority capital preferred returns. LeaseUp Communities: Communities that have commenced initial operations but have Suburban:Longterm hold office properties (excluding Class A Suburban and Waterfront locations); formerly defined as Suburban Core not yet achieved Project Stabilization. MCRC Capital:Represents cash equity that the Company has contributed or has a future Third Party Capital: Capital invested by third parties and not MackCali. obligation to contribute to a project. Net Asset Value (NAV): The metric represents the net projected value of the Company’s Total Costs:Represents full project budget, including land and developer fees, and interest after accounting for all priority debt and equity payments. The metric includes capital invested by the Company. interest expense through Project Completion. NonCore: Properties designated for eventual sale/disposition or repositioning/redevelopment. Waterfront: Office assets located on NJ Hudson River waterfront. 2Q 202043
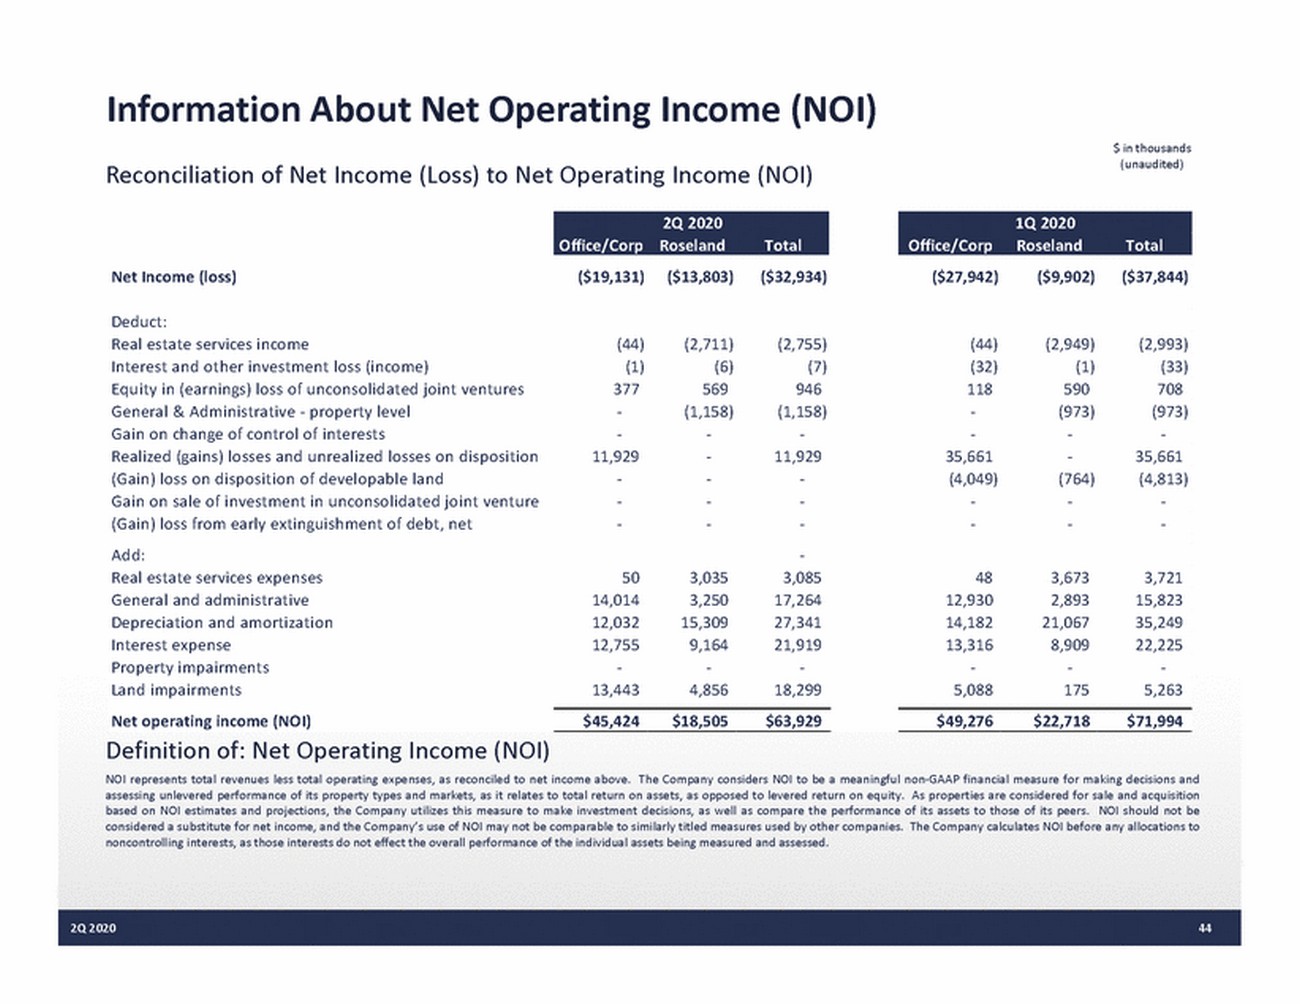
Information About Net Operating Income (NOI) Reconciliation of Net Income (Loss) to Net Operating Income (NOI) $ in thousands (unaudited) Net Income (loss) ($19,131) ($13,803) ($32,934) ($27,942) ($9,902) ($37,844) Deduct: Real estate services income Interest and other investment loss (income) Equity in (earnings) loss of unconsolidated joint ventures General & Administrative property level Gain on change of control of interests Realized (gains) losses and unrealized losses on disposition (Gain) loss on disposition of developable land Gain on sale of investment in unconsolidated joint venture (Gain) loss from early extinguishment of debt, net Add: Real estate services expenses General and administrative Depreciation and amortization Interest expense Property impairments Land impairments Net operating income (NOI) (44) (1) 377 11,929 (2,711) (6) 569 (1,158) (2,755) (7) 946 (1,158) 11,929 3,085 17,264 27,341 21,919 18,299 (44) (32) 118 35,661 (4,049) (2,949) (1) 590 (973) (764) (2,993) (33) 708 (973) 35,661 (4,813) 50 14,014 12,032 12,755 13,443 3,035 3,250 15,309 9,164 4,856 48 12,930 14,182 13,316 5,088 3,673 2,893 21,067 8,909 175 3,721 15,823 35,249 22,225 5,263 $45,424 $18,505 $63,929 $49,276 $22,718 $71,994 Definition of: Net Operating Income (NOI) NOI represents total revenues less total operating expenses, as reconciled to net income above. The Company considers NOI to be a meaningful nonGAAP financial measure for making decisions and assessing unlevered performance of its property types and markets, as it relates to total return on assets, as opposed to levered return on equity. As properties are considered for sale and acquisition based on NOI estimates and projections, the Company utilizes this measure to make investment decisions, as well as compare the performance of its assets to those of its peers. NOI should not be considered a substitute for net income, and the Company’s use of NOI may not be comparable to similarly titled measures used by other companies. The Company calculates NOI before any allocations to noncontrolling interests, as those interests do not effect the overall performance of the individual assets being measured and assessed. 2Q 202044 2Q 2020 Office/Corp RoselandTotal 1Q 2020 Office/CorpRoselandTotal
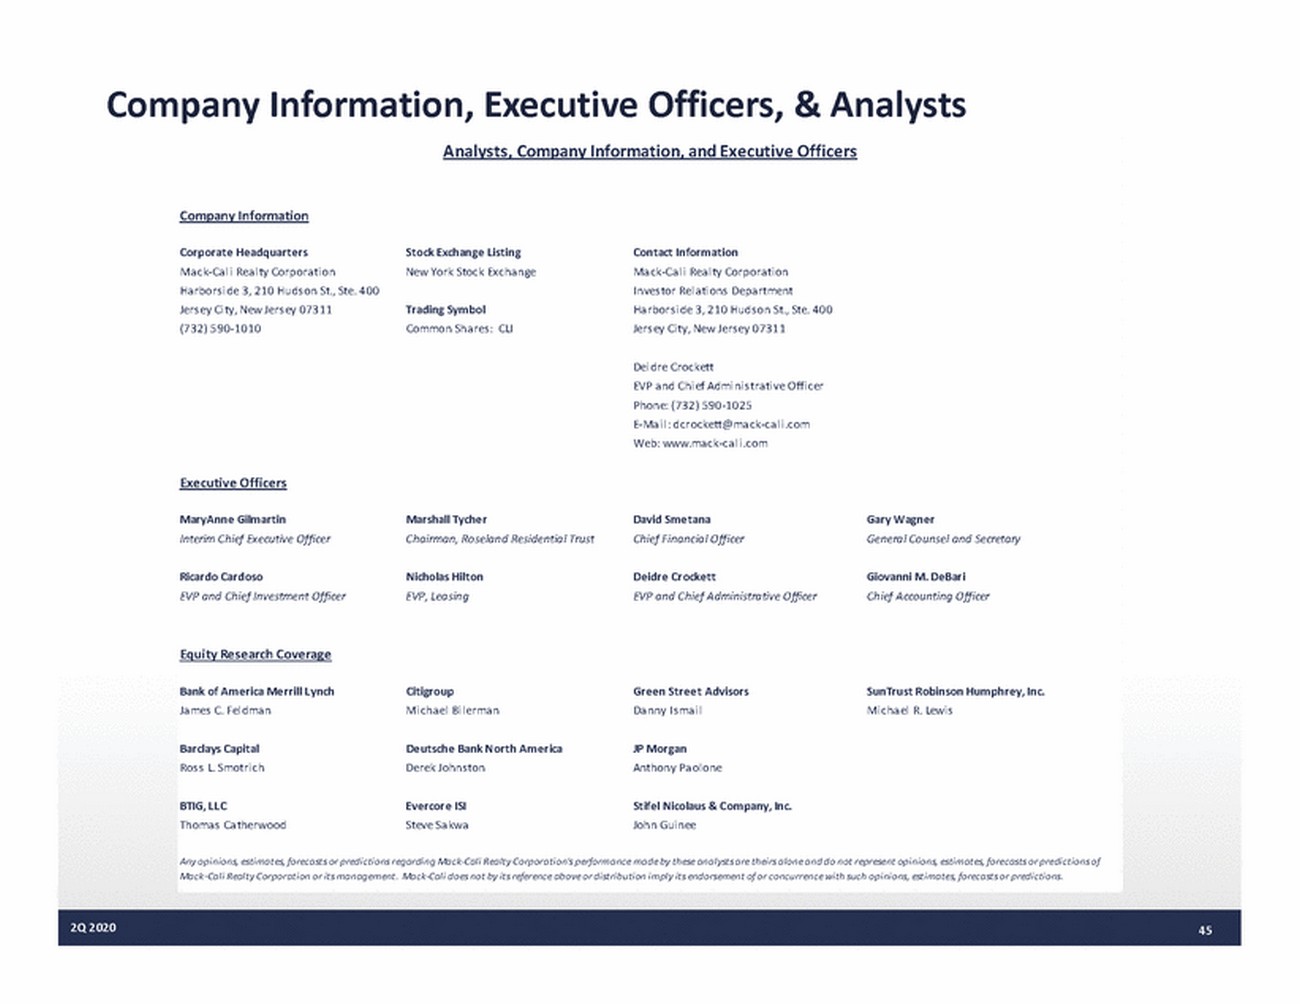
Company Information, Executive Officers, & Analysts Analysts, Company Information, and Executive Officers Company Information Corporate Headquarters MackCa l i Rea l ty Corpora ti on Harbors i de 3, 210 Huds on St., Ste. 400 Jers ey Ci ty, New Jers ey 07311 (732) 5901010 Stock Exchange Listing New York Stock Excha nge Contact Information MackCa l i Rea l ty Corpora ti on I nves tor Rel ati ons Depa rtment Ha rbors i de 3, 210 Huds on St., Ste. 400 Jers ey Ci ty, New Jers ey 07311 Trading Symbol Common Shares : CLI Dei dre Crockett EVP and Chi ef Admi ni s trati ve Offi cer Phone: (732) 5901025 EMa il: dcrockett@ma ckca l i .com Web: www.mackcali.com Executive Officers MaryAnne Gilmartin Interim Chief Executive Officer Marshall Tycher Chairman, Roseland Residential Trust David Smetana Chief Financial Officer Gary Wagner General Counsel and Secretary Ricardo Cardoso EVP and Chief Investment Officer Nicholas Hilton EVP, Leasing Deidre Crockett EVP and Chief Administrative Officer Giovanni M. DeBari Chief Accounting Officer Equity Re search Coverage Bank of America Merrill Lynch Ja mes C. Feldma n Citigroup Micha el Bilerma n Green Street Advisors Da nny Is ma i l SunTrust Robinson Humphrey, Inc. Mi chael R. Lewi s Barclays Capital Ros s L. Smotri ch Deutsche Bank North America Derek Johns ton JP Morgan Anthony Pa ol one BTIG, LLC Thomas Ca therwood Evercore ISI Steve Sa kwa Stifel Nicolaus & Company, Inc. John Gui nee Any opinions, estimates, forecasts or predictions regarding MackCali Realty Corporation's performance made by these analysts are theirs alone and do not represent opinions, estimates, forecasts or predictions of Mack-Cali Realty Corporation or its management. MackCali does not by its reference above or distribution imply its endorsement of or concurrence with such opinions, estimates, forecasts or predictions. 2Q 202045
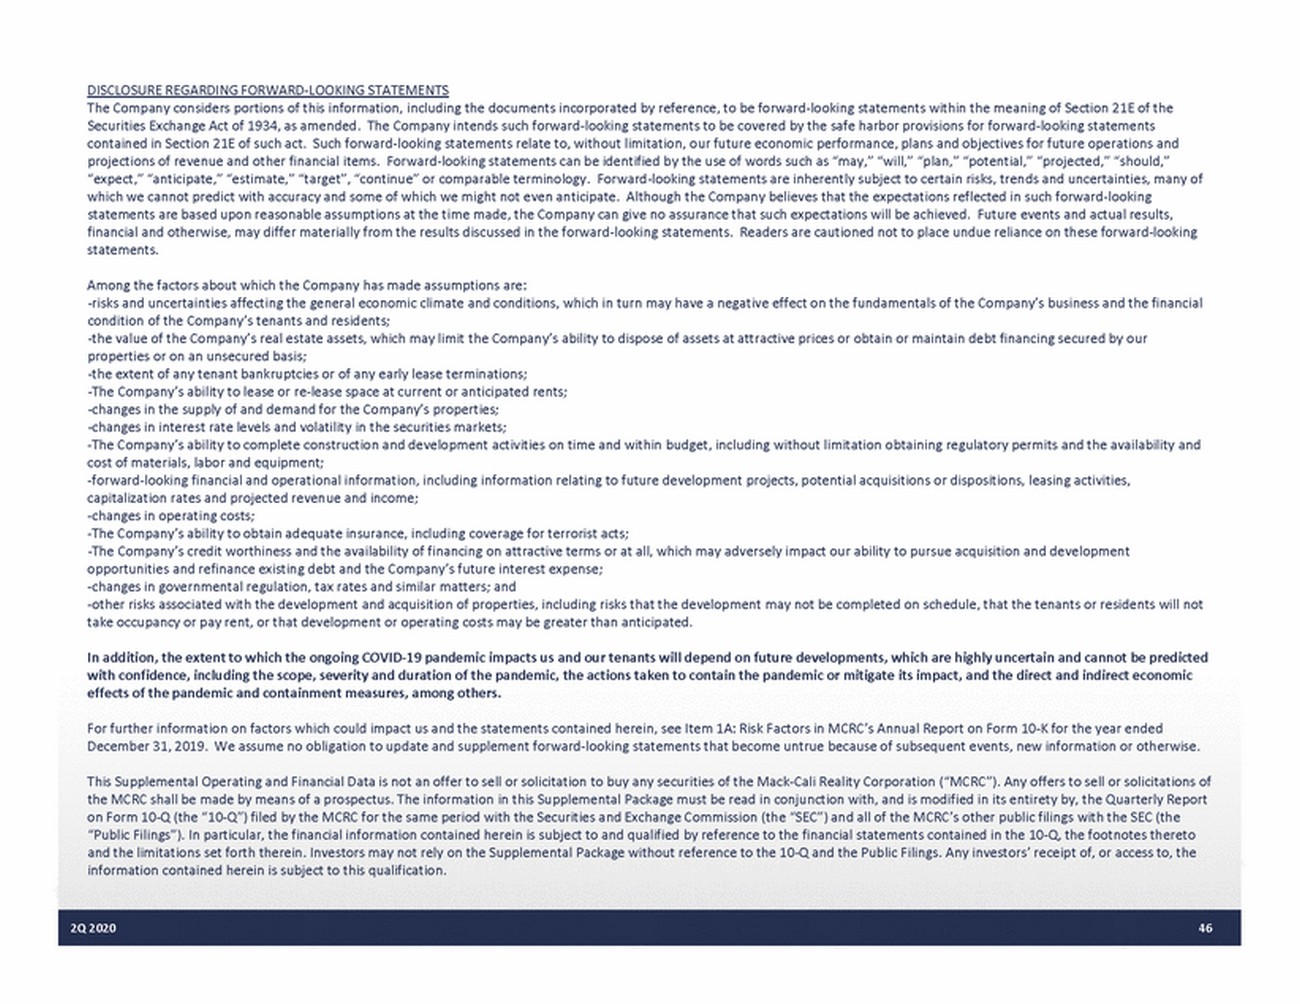
DISCLOSURE REGARDING FORWARDLOOKING STATEMENTS The Company considers portions of this information, including the documents incorporated by reference, to be forwardlooking statements within the meaning of Section 21E of the Securities Exchange Act of 1934, as amended. The Company intends such forwardlooking statements to be covered by the safe harbor provisions for forwardlooking statements contained in Section 21E of such act. Such forwardlooking statements relate to, without limitation, our future economic performance, plans and objectives for future operations and projections of revenue and other financial items. Forwardlooking statements can be identified by the use of words such as “may,” “will,” “plan,” “potential,” “projected,” “should,” “expect,” “anticipate,” “estimate,” “target”, “continue” or comparable terminology. Forwardlooking statements are inherently subject to certain risks, trends and uncertainties, many of which we cannot predict with accuracy and some of which we might not even anticipate. Although the Company believes that the expectations reflected in such forwardlooking statements are based upon reasonable assumptions at the time made, the Company can give no assurance that such expectations will be achieved. Future events and actual results, financial and otherwise, may differ materially from the results discussed in the forwardlooking statements. Readers are cautioned not to place undue reliance on these forwardlooking statements. Among the factors about which the Company has made assumptions are: risks and uncertainties affecting the general economic climate and conditions, which in turn may have a negative effect on the fundamentals of the Company’s business and the financial condition of the Company’s tenants and residents; the value of the Company’s real estate assets, which may limit the Company’s ability to dispose of assets at attractive prices or obtain or maintain debt financing secured by our properties or on an unsecured basis; the extent of any tenant bankruptcies or of any early lease terminations; The Company’s ability to lease or release space at current or anticipated rents; changes in the supply of and demand for the Company’s properties; changes in interest rate levels and volatility in the securities markets; The Company’s ability to complete construction and development activities on time and within budget, including without limitation obtaining regulatory permits and the availability and cost of materials, labor and equipment; forwardlooking financial and operational information, including information relating to future development projects, potential acquisitions or dispositions, leasing activities, capitalization rates and projected revenue and income; changes in operating costs; The Company’s ability to obtain adequate insurance, including coverage for terrorist acts; The Company’s credit worthiness and the availability of financing on attractive terms or at all, which may adversely impact our ability to pursue acquisition and development opportunities and refinance existing debt and the Company’s future interest expense; changes in governmental regulation, tax rates and similar matters; and other risks associated with the development and acquisition of properties, including risks that the development may not be completed on schedule, that the tenants or residents will not take occupancy or pay rent, or that development or operating costs may be greater than anticipated. In addition, the extent to which the ongoing COVID19 pandemic impacts us and our tenants will depend on future developments, which are highly uncertain and cannot be predicted with confidence, including the scope, severity and duration of the pandemic, the actions taken to contain the pandemic or mitigate its impact, and the direct and indirect economic effects of the pandemic and containment measures, among others. For further information on factors which could impact us and the statements contained herein, see Item 1A: Risk Factors in MCRC’s Annual Report on Form 10K for the year ended December 31, 2019. We assume no obligation to update and supplement forwardlooking statements that become untrue because of subsequent events, new information or otherwise. This Supplemental Operating and Financial Data is not an offer to sell or solicitation to buy any securities of the MackCali Reality Corporation (“MCRC”). Any offers to sell or solicitations of the MCRC shall be made by means of a prospectus. The information in this Supplemental Package must be read in conjunction with, and is modified in its entirety by, the Quarterly Report on Form 10Q (the “10Q”) filed by the MCRC for the same period with the Securities and Exchange Commission (the “SEC”) and all of the MCRC’s other public filings with the SEC (the “Public Filings”). In particular, the financial information contained herein is subject to and qualified by reference to the financial statements contained in the 10Q, the footnotes thereto and the limitations set forth therein. Investors may not rely on the Supplemental Package without reference to the 10Q and the Public Filings. Any investors’ receipt of, or access to, the information contained herein is subject to this qualification. 2Q 202046