Exhibit 99.1
Mack]Cali NAREIT Presentation November 2019
Statements made in this presentation may be forward]looking statements within the meaning of Section 21E of the Securities Exchange Act of 1934, as amended. Forward]looking statements can be identified by the use of words such as gmay,h gwill,h gplan,h gpotential,h gprojected,h gshould,h gexpect,h ganticipate,h gestimate,h gtarget,h gcontinueh or comparable terminology. Forward]looking statements are inherently subject to certain risks, trends and uncertainties, many of which we cannot predict with accuracy and some of which we might not even anticipate, and involve factors that may cause actual results to differ materially from those projected or suggested. Readers are cautioned not to place undue reliance on these forward]looking statements and are advised to consider the factors listed above together with the additional factors under the heading gDisclosure Regarding Forward]Looking Statementsh and gRisk Factorsh in our annual reports on Form 10]K, as may be supplemented or amended by our quarterly reports on Form 10]Q, which are incorporated herein by reference. We assume no obligation to update or supplement forward]looking statements that become untrue because of subsequent events, new information or otherwise. This Operating and Financial Data should be read in connection with our Quarterly Report on Form 10]Q for the quarter ended September 30, 2019. 2
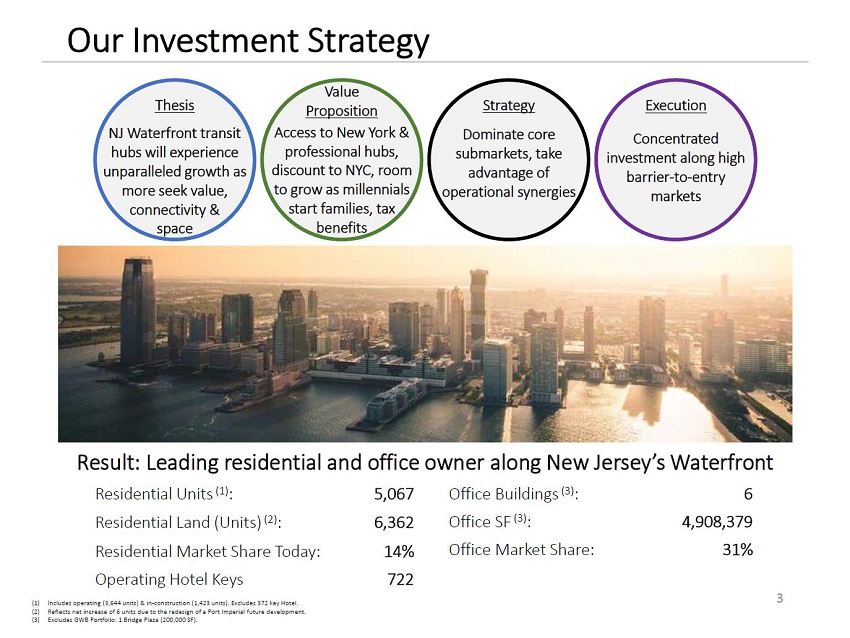
Our Investment Strategy 3 Thesis NJ Waterfront transit hubs will experience unparalleled growth as more seek value, connectivity & space Value Proposition Access to New York & professional hubs, discount to NYC, room to grow as millennials start families, tax benefits Strategy Dominate core submarkets, take advantage of operational synergies Execution Concentrated investment along high barrier]to]entry markets Result: Leading residential and office owner along New Jerseyfs Waterfront Residential Units (1): 5,067 Residential Land (Units) (2): 6,362 Residential Market Share Today: 14% Operating Hotel Keys 722 Office Buildings (3): 6 Office SF (3): 4,908,379 Office Market Share: 31% (1) Includes operating (3,644 units) & in]construction (1,423 units). Excludes 372 key Hotel. (2) Reflects net increase of 6 units due to the redesign of a Port Imperial future development. (3) Excludes GWB Portfolio: 1 Bridge Plaza (200,000 SF).
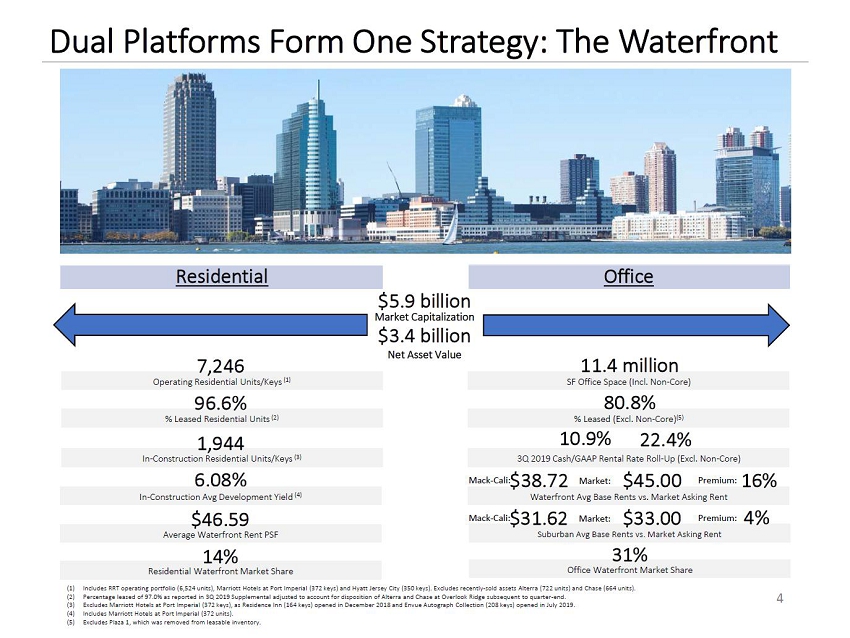
Dual Platforms Form One Strategy: The Waterfront 4 Suburban Avg Base Rents vs. Market Asking Rent 6.08% SF Office Space (Incl. Non]Core) % Leased (Excl. Non]Core)(5) 3Q 2019 Cash/GAAP Rental Rate Roll]Up (Excl. Non]Core) Waterfront Avg Base Rents vs. Market Asking Rent Operating Residential Units/Keys (1) % Leased Residential Units (2) In]Construction Residential Units/Keys (3) 7,246 96.6% 1,944 Market Capitalization Net Asset Value $3.4 billion $5.9 billion 11.4 million 10.9% 22.4% In]Construction Avg Development Yield (4) 80.8% Residential Office Average Waterfront Rent PSF $46.59 Mack]Cali:$31.62 Market: $33.00 Premium: 4% Residential Waterfront Market Share 14% Office Waterfront Market Share 31% (1) Includes RRT operating portfolio (6,524 units), Marriott Hotels at Port Imperial (372 keys) and Hyatt Jersey City (350 keys). Excludes recently]sold assets Alterra (722 units) and Chase (664 units). (2) Percentage leased of 97.0% as reported in 3Q 2019 Supplemental adjusted to account for disposition of Alterra and Chase at Overlook Ridge subsequent to quarter]end. (3) Excludes Marriott Hotels at Port Imperial (372 keys), as Residence Inn (164 keys) opened in December 2018 and Envue Autograph Collection (208 keys) opened in July 2019. (4) Includes Marriott Hotels at Port Imperial (372 units). (5) Excludes Plaza 1, which was removed from leasable inventory. Mack]Cali:$38.72 Market: $45.00 Premium: 16%
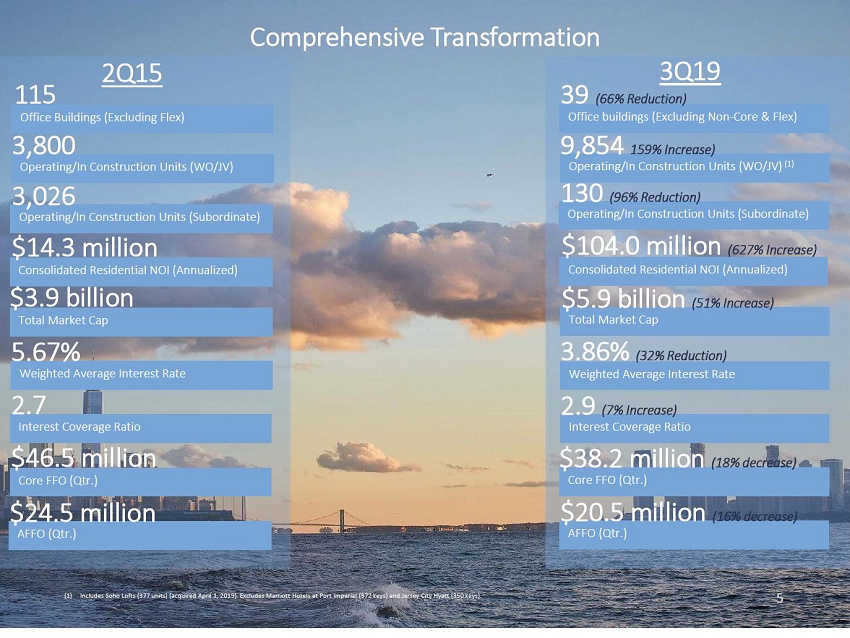
Office buildings (Excluding Non]Core & Flex) Operating/In Construction Units (WO/JV) (1) Operating/In Construction Units (Subordinate) Total Market Cap Weighted Average Interest Rate Interest Coverage Ratio Core FFO (Qtr.) 39 (66% Reduction) 9,854 159% Increase) 130 (96% Reduction) $5.9 billion (51% Increase) 3.86% (32% Reduction) 2.9 (7% Increase) $38.2 million (18% decrease) AFFO (Qtr.) $20.5 million (16% decrease) Comprehensive Transformation Office Buildings (Excluding Flex) Operating/In Construction Units (WO/JV) Operating/In Construction Units (Subordinate) Total Market Cap Weighted Average Interest Rate Interest Coverage Ratio Core FFO (Qtr.) AFFO (Qtr.) 115 3,800 3,026 $3.9 billion 5.67% 2.7 $46.5 million $24.5 million 2Q15 3Q19 Consolidated Residential NOI (Annualized) $14.3 million Consolidated Residential NOI (Annualized) $104.0 million (627% Increase) (1) Includes Soho Lofts (377 units) (acquired April 1, 2019). Excludes Marriott Hotels at Port Imperial (372 keys) and Jersey City Hyatt (350 keys). 5
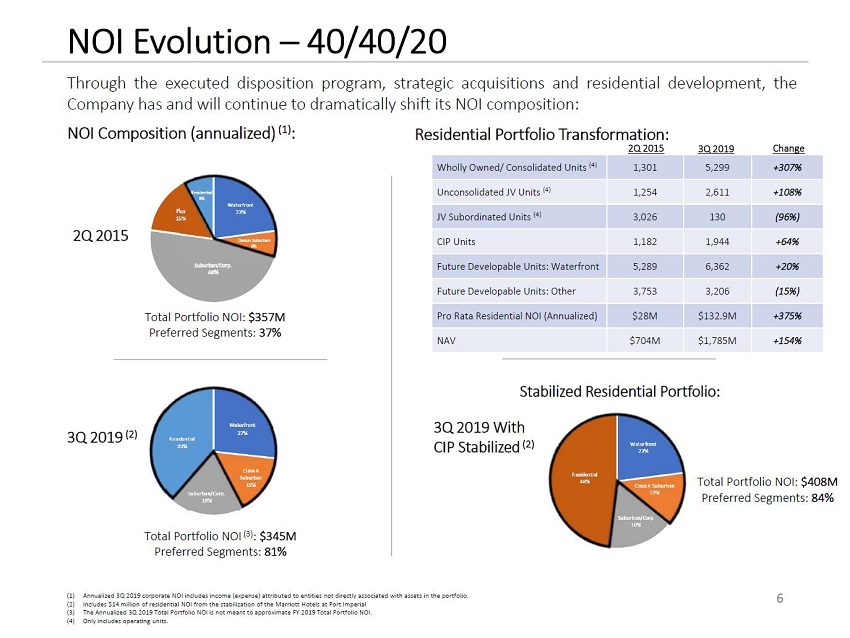
NOI Evolution – 40/40/20 Waterfront 23% Class A Suburban 6% Suburban/Corp. 48% Flex 15% Residential 8% Waterfront 27% Class A Suburban 15% Suburban/Corp. 19% Flex… Residential 39% Total Portfolio NOI (3): $345M Preferred Segments: 81% Total Portfolio NOI: $357M Preferred Segments: 37% (1) Annualized 3Q 2019 corporate NOI includes income (expense) attributed to entities not directly associated with assets in the portfolio. (2) Includes $14 million of residential NOI from the stabilization of the Marriott Hotels at Port Imperial (3) The Annualized 3Q 2019 Total Portfolio NOI is not meant to approximate FY 2019 Total Portfolio NOI. (4) Only includes operating units. 6 Through the executed disposition program, strategic acquisitions and residential development, the Company has and will continue to dramatically shift its NOI composition: 2Q 2015 Wholly Owned/ Consolidated Units (4) 1,301 5,299 +307% Unconsolidated JV Units (4) 1,254 2,611 +108% JV Subordinated Units (4) 3,026 130 (96%) CIP Units 1,182 1,944 +64% Future Developable Units: Waterfront 5,289 6,362 +20% Future Developable Units: Other 3,753 3,206 (15%) Pro Rata Residential NOI (Annualized) $28M $132.9M +375% NAV $704M $1,785M +154% 2Q 2015 3Q 2019 Change Residential NOI Composition (annualized) (1): Portfolio Transformation: 3Q 2019 (2) Stabilized Residential Portfolio: Residential 48% Class A Suburban 13% Waterfront 23% Suburban/Corp 16% 3Q 2019 With CIP Stabilized(2) Total Portfolio NOI: $408M Preferred Segments: 84%
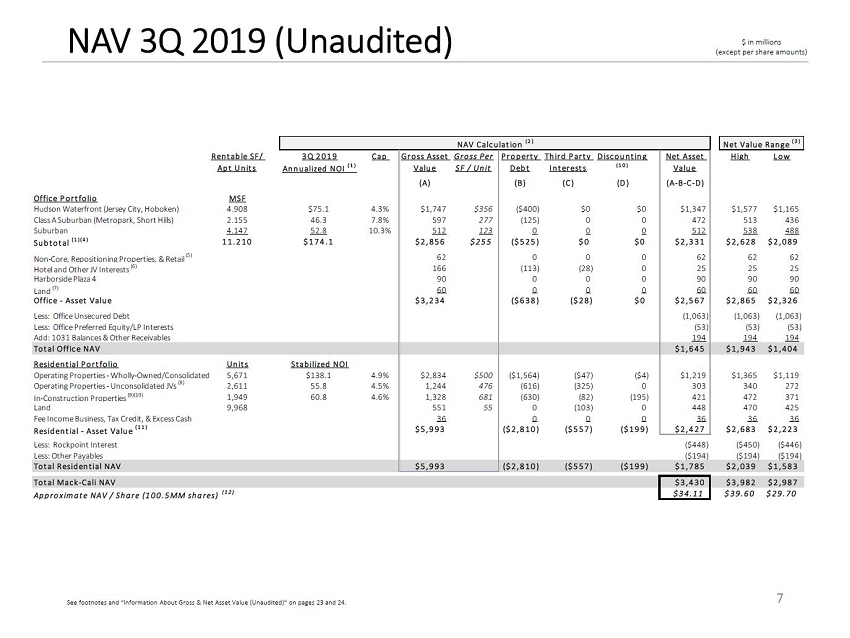
NAV 3Q 2019 (Unaudited) 7 $ in millions (except per share amounts) See footnotes and gInformation About Gross & Net Asset Value (Unaudited)h on pages 23 and 24. Rentable SF/ 3Q 2019 Cap Gross Asset G r o ss P er Propert y Third Part y Discounting Net Asset High Low Apt Unit s Annualized NOI (1 ) Value S F / Un it Debt Interests (1 0 ) Value (A) (B) (C) (D) (A]B]C]D) Office Port folio MSF Hudson Waterfront (Jersey City, Hoboken) 4.908 $75.1 4.3% $1,747 $356 ($400) $0 $0 $1,347 $1,577 $1,165 Class A Suburban (Metropark, Short Hills) 2.155 46.3 7.8% 597 277 (125) 0 0 472 513 436 Suburban 4.147 52.8 10.3% 512 123 0 0 0 512 538 488 Subtotal (1 ) ( 4 ) 11.210 $174.1 $2,856 $ 2 5 5 ($525) $0 $0 $2,331 $2,628 $2,089 Non]Core, Repositioning Properties, & Retail (5) 62 0 0 0 62 62 62 Hotel and Other JV Interests (6) 166 (113) (28) 0 25 25 25 Harborside Plaza 4 90 0 0 0 90 90 90 Land (7) 60 0 0 0 60 60 60 Office ] Asset Value $3,234 ($638) ($28) $0 $2,567 $2,865 $2 ,326 Less: Office Unsecured Debt (1,063) (1,063) (1,063) Less: Office Preferred Equity/LP Interests (53) (53) (53) Add: 1031 Balances & Other Receivables 194 194 194 Total Office NAV $1,645 $1,943 $1,404 Residential Por t fo lio Unit s Stabilized NOI Operating Properties ] Wholly]Owned/Consolidated 5,671 $138.1 4.9% $2,834 $500 ($1,564) ($47) ($4) $1,219 $1,365 $1,119 Operating Properties ] Unconsolidated JVs (8) 2,611 55.8 4.5% 1,244 476 (616) (325) 0 303 340 272 In]Construction Properties (9)(10) 1,949 60.8 4.6% 1,328 681 (630) (82) (195) 421 472 371 Land 9,968 551 55 0 (103) 0 448 470 425 Fee Income Business, Tax Credit, & Excess Cash 36 0 0 0 36 36 36 Residential ] Asset Value (1 1 ) $5,993 ($2,810) ($557) ($199) $2,427 $2,683 $2,223 Less: Rockpoint Interest ($448) ($450) ($446) Less: Other Payables ($194) ($194) ($194) Total Resident ial NAV $5,993 ($2,810) ($557) ($199) $1,785 $2,039 $1,583 Total Mack]Cali NAV $3,430 $3,982 $2,987 Ap p r o x im a t e NAV / S h a r e (1 0 0 . 5 MM sh a r es) ( 1 2 ) $ 3 4 . 1 1 $ 3 9 . 6 0 $ 2 9 . 7 0 NAV Calculat ion (2 ) Net Value Range (3 )
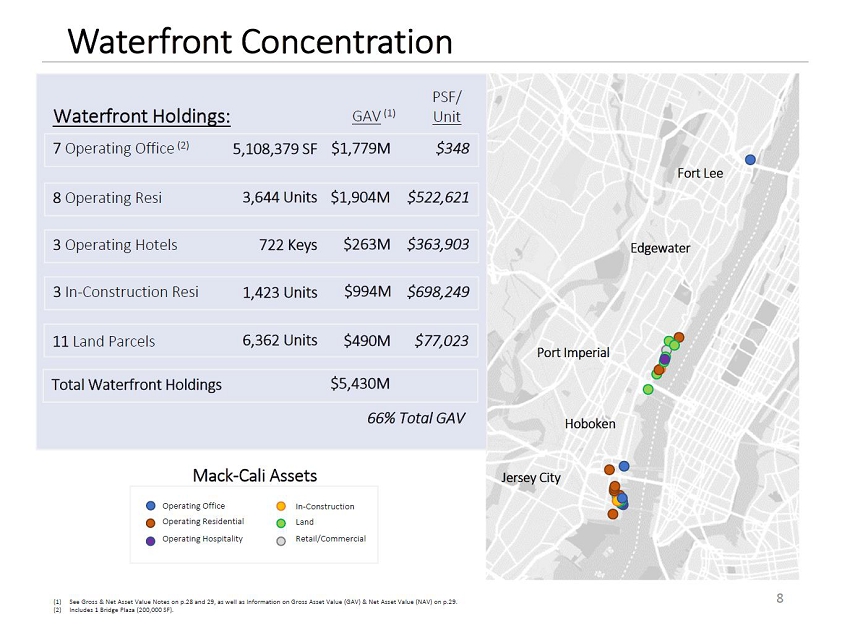
Waterfront Concentration 8 Port Imperial Hoboken Jersey City Edgewater Fort Lee Mack]Cali Assets Operating Office Operating Residential Operating Hospitality In]Construction Land Retail/Commercial Waterfront Holdings: 7 Operating Office (2) $1,779M 8 Operating Resi $1,904M 3 Operating Hotels $263M 3 In]Construction Resi $994M 11 Land Parcels $490M 5,108,379 SF 3,644 Units 722 Keys 1,423 Units 6,362 Units Total Waterfront Holdings $5,430M GAV (1) (1) See Gross & Net Asset Value Notes on p.28 and 29, as well as Information on Gross Asset Value (GAV) & Net Asset Value (NAV) on p.29. (2) Includes 1 Bridge Plaza (200,000 SF). 66% Total GAV $348 $522,621 $363,903 $698,249 $77,023 PSF/ Unit
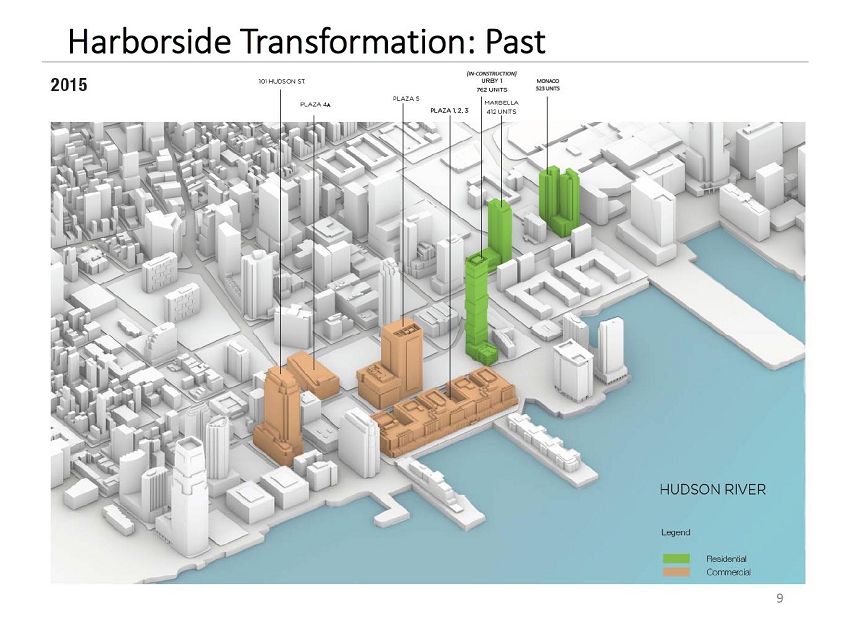
9 Harborside Transformation: Past (IN]CONSTRUCTION) A MONACO 523 UNITS
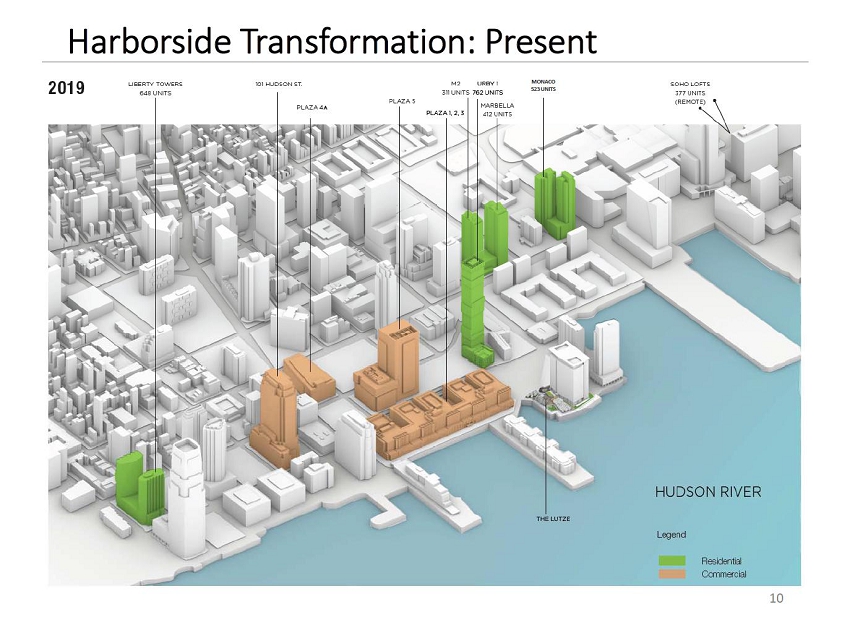
10 Harborside Transformation: Present A MONACO 523 UNITS
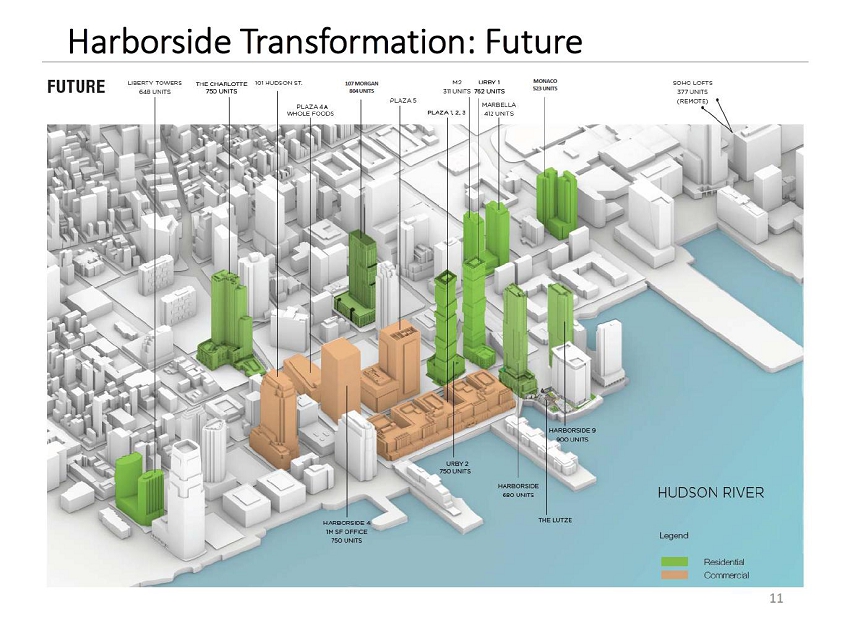
11 Harborside Transformation: Future A MONACO 523 UNITS 107 MORGAN 804 UNITS
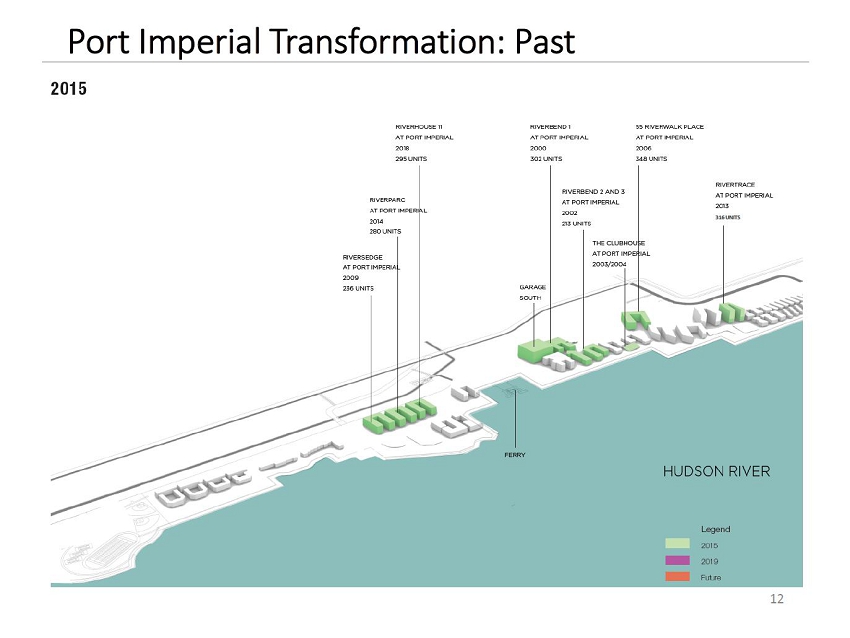
12 Port Imperial Transformation: Past 316 UNITS
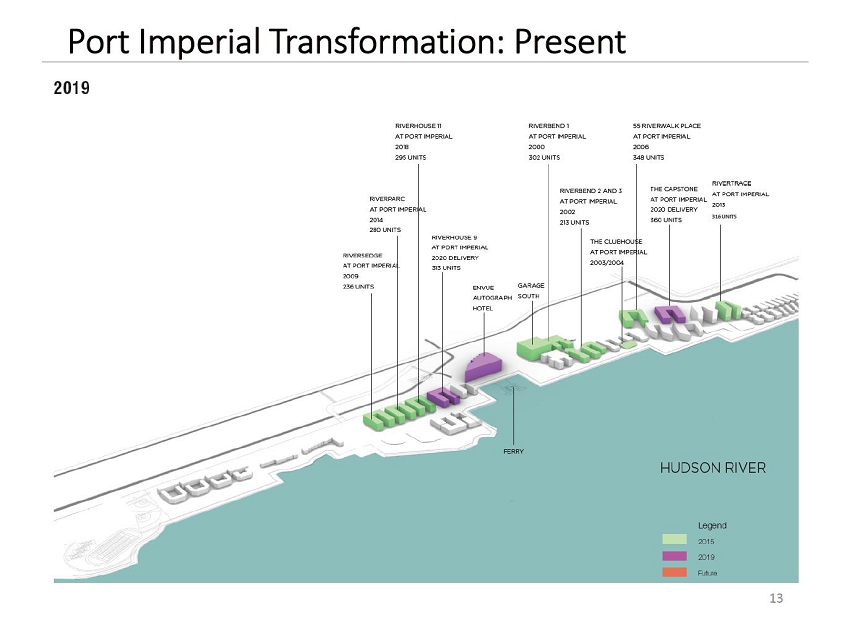
13 Port Imperial Transformation: Present 316 UNITS
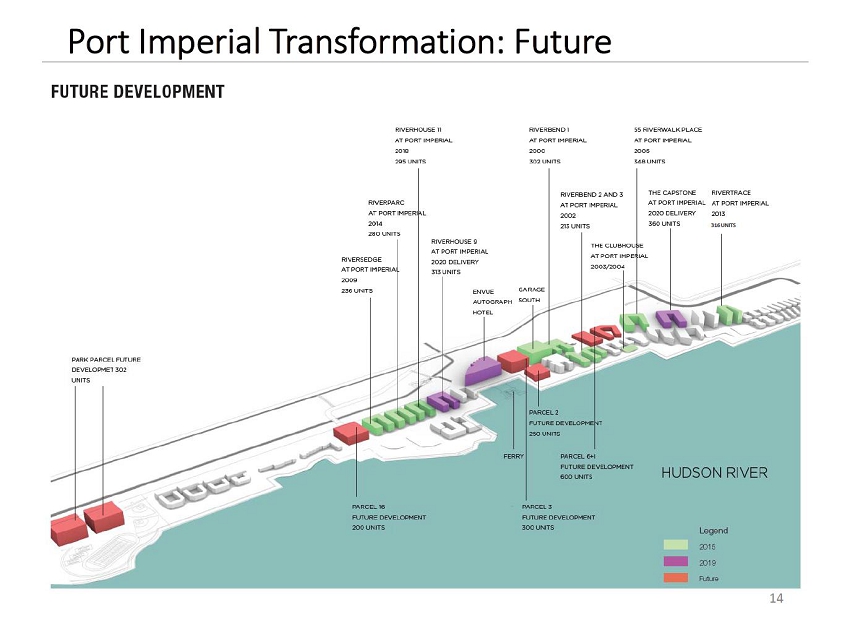
14 Port Imperial Transformation: Future 316 UNITS
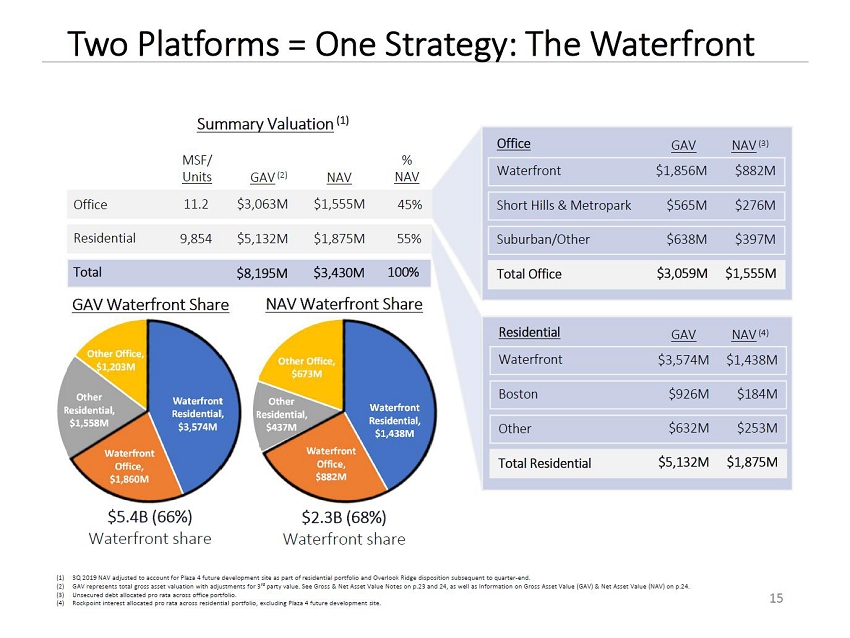
Waterfront Residential, $3,574M Waterfront Office, $1,860M Other Residential, $1,558M Other Office, $1,203M Two Platforms = One Strategy: The Waterfront Waterfront Residential, $1,438M Waterfront Office, $882M Other Residential, $437M Other Office, $673M Office 11.2 $3,063M 45% Residential 9,854 $5,132M 55% Total $8,195M 100% MSF/ Units GAV(2) % NAV Summary Valuation(1) NAV Waterfront Share $2.3B (68%) Waterfront share Office Waterfront Short Hills & Metropark Suburban/Other Total Office Residential Waterfront Boston Other Total Residential $882M $276M $397M $1,555M $1,438M $184M $253M $1,875M (1) 3Q 2019 NAV adjusted to account for Plaza 4 future development site as part of residential portfolio and Overlook Ridge disposition subsequent to quarter]end. (2) GAV represents total gross asset valuation with adjustments for 3rd party value. See Gross & Net Asset Value Notes on p.23 and 24, as well as Information on Gross Asset Value (GAV) & Net Asset Value (NAV) on p.24. (3) Unsecured debt allocated pro rata across office portfolio. (4) Rockpoint interest allocated pro rata across residential portfolio, excluding Plaza 4 future development site. 15 $1,555M NAV $1,875M $3,430M $1,856M $565M $638M $3,059M $3,574M $926M $632M $5,132M GAV NAV(3) GAV NAV(4) GAV Waterfront Share $5.4B (66%) Waterfront share
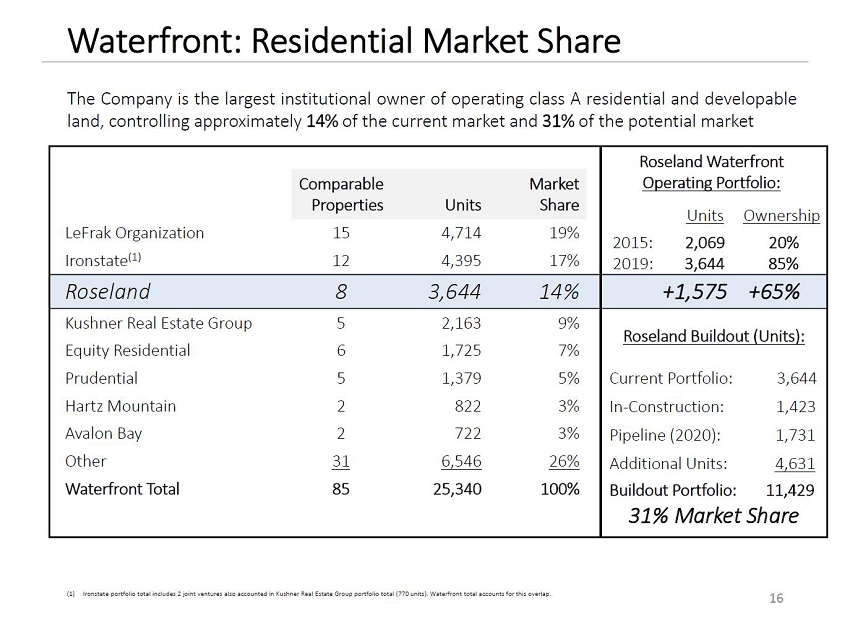
Waterfront: Residential Market Share 16 The Company is the largest institutional owner of operating class A residential and developable land, controlling approximately 14% of the current market and 31% of the potential market Comparable Properties Units Market Share LeFrak Organization 15 4,714 19% Ironstate(1) 12 4,395 17% Roseland 8 3,644 14% Kushner Real Estate Group 5 2,163 9% Equity Residential 6 1,725 7% Prudential 5 1,379 5% Hartz Mountain 2 822 3% Avalon Bay 2 722 3% Other 31 6,546 26% Waterfront Total 85 25,340 100% Roseland Waterfront Operating Portfolio: Units Ownership 2015: 2,069 20% 2019: 3,644 85% +1,575 +65% (1) Ironstate portfolio total includes 2 joint ventures also accounted in Kushner Real Estate Group portfolio total (770 units). Waterfront total accounts for this overlap. Roseland Buildout (Units): Current Portfolio: 3,644 In]Construction: 1,423 Pipeline (2020): 1,731 Additional Units: 4,631 Buildout Portfolio: 11,429 31% Market Share
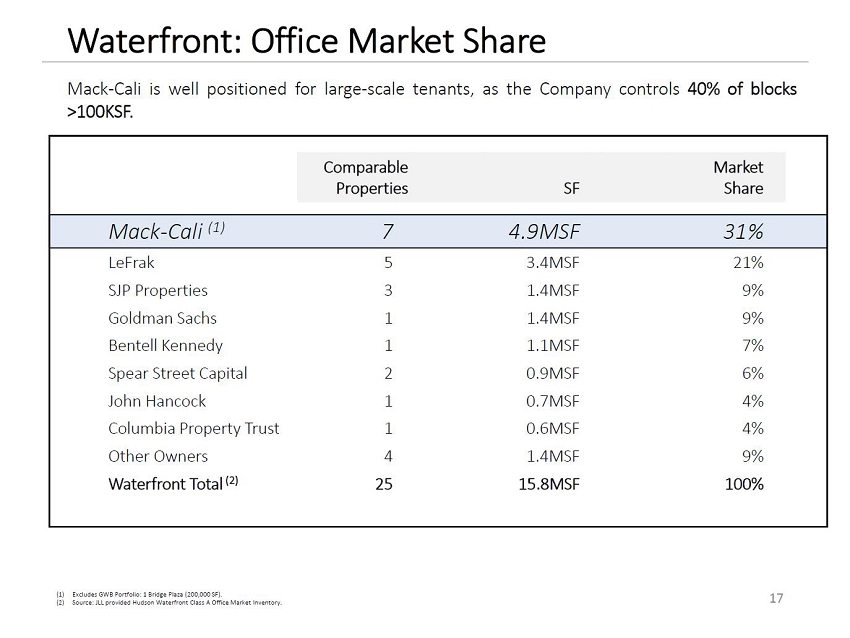
Waterfront: Office Market Share 17 Comparable Properties SF Market Share Mack]Cali (1) 7 4.9MSF 31% LeFrak 5 3.4MSF 21% SJP Properties 3 1.4MSF 9% Goldman Sachs 1 1.4MSF 9% Bentell Kennedy 1 1.1MSF 7% Spear Street Capital 2 0.9MSF 6% John Hancock 1 0.7MSF 4% Columbia Property Trust 1 0.6MSF 4% Other Owners 4 1.4MSF 9% Waterfront Total (2) 25 15.8MSF 100% Mack]Cali is well positioned for large]scale tenants, as the Company controls 40% of blocks >100KSF. (1) Excludes GWB Portfolio: 1 Bridge Plaza (200,000 SF). (2) Source: JLL provided Hudson Waterfront Class A Office Market Inventory.
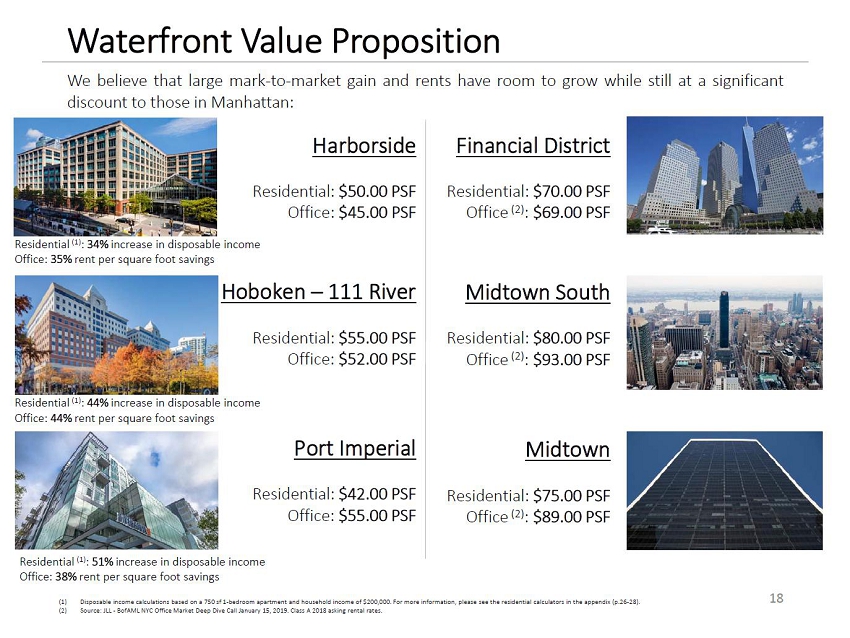
Waterfront Value Proposition 18 Midtown South Residential: $80.00 PSF Office (2): $93.00 PSF Financial District Residential: $70.00 PSF Office (2): $69.00 PSF Midtown Residential: $75.00 PSF Office (2): $89.00 PSF Hoboken . 111 River Residential: $55.00 PSF Office: $52.00 PSF Harborside Residential: $50.00 PSF Office: $45.00 PSF Port Imperial Residential: $42.00 PSF Office: $55.00 PSF Residential (1): 34% increase in disposable income Office: 35% rent per square foot savings Residential (1): 44% increase in disposable income Office: 44% rent per square foot savings Residential (1): 51% increase in disposable income Office: 38% rent per square foot savings (1) Disposable income calculations based on a 750 sf 1]bedroom apartment and household income of $200,000. For more information, please see the residential calculators in the appendix (p.26]28). (2) Source: JLL ] BofAML NYC Office Market Deep Dive Call January 15, 2019. Class A 2018 asking rental rates. We believe that large mark]to]market gain and rents have room to grow while still at a significant discount to those in Manhattan:
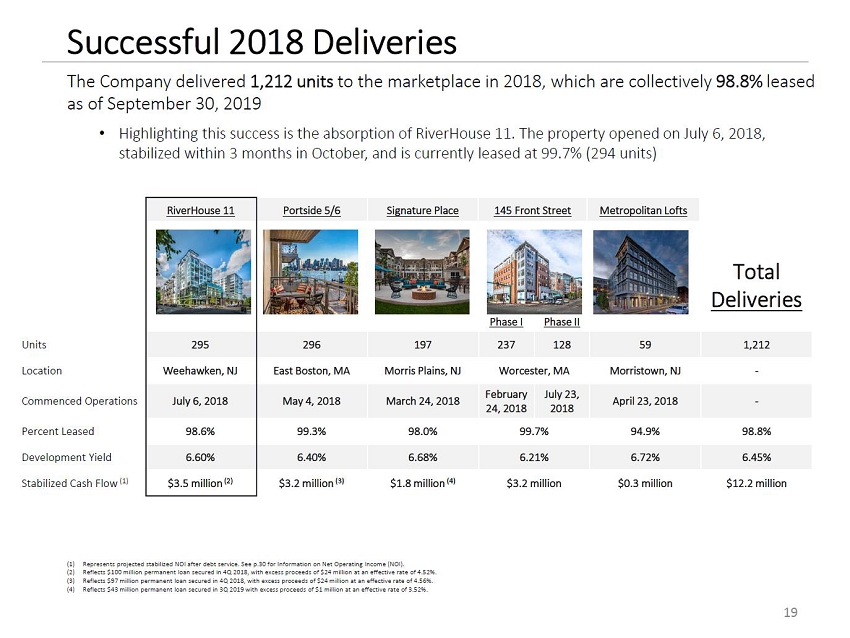
Successful 2018 Deliveries 19 The Company delivered 1,212 units to the marketplace in 2018, which are collectively 98.8% leased as of September 30, 2019 . Highlighting this success is the absorption of RiverHouse 11. The property opened on July 6, 2018, stabilized within 3 months in October, and is currently leased at 99.7% (294 units) Phase I Phase II Units 295 296 197 237 128 59 1,212 Location Weehawken, NJ East Boston, MA Morris Plains, NJ Worcester, MA Morristown, NJ ] Commenced Operations July 6, 2018 May 4, 2018 March 24, 2018 February 24, 2018 July 23, 2018 April 23, 2018 ] Percent Leased 98.6% 99.3% 98.0% 99.7% 94.9% 98.8% Development Yield 6.60% 6.40% 6.68% 6.21% 6.72% 6.45% Stabilized Cash Flow (1) $3.5 million(2) $3.2 million(3) $1.8 million(4) $3.2 million $0.3 million $12.2 million RiverHouse 11 Portside 5/6 Signature Place 145 Front Street Metropolitan Lofts Total Deliveries (1) Represents projected stabilized NOI after debt service. See p.30 for Information on Net Operating Income (NOI). (2) Reflects $100 million permanent loan secured in 4Q 2018, with excess proceeds of $24 million at an effective rate of 4.52%. (3) Reflects $97 million permanent loan secured in 4Q 2018, with excess proceeds of $24 million at an effective rate of 4.56%. (4) Reflects $43 million permanent loan secured in 3Q 2019 with excess proceeds of $1 million at an effective rate of 3.52%. 19 Total Deliveries
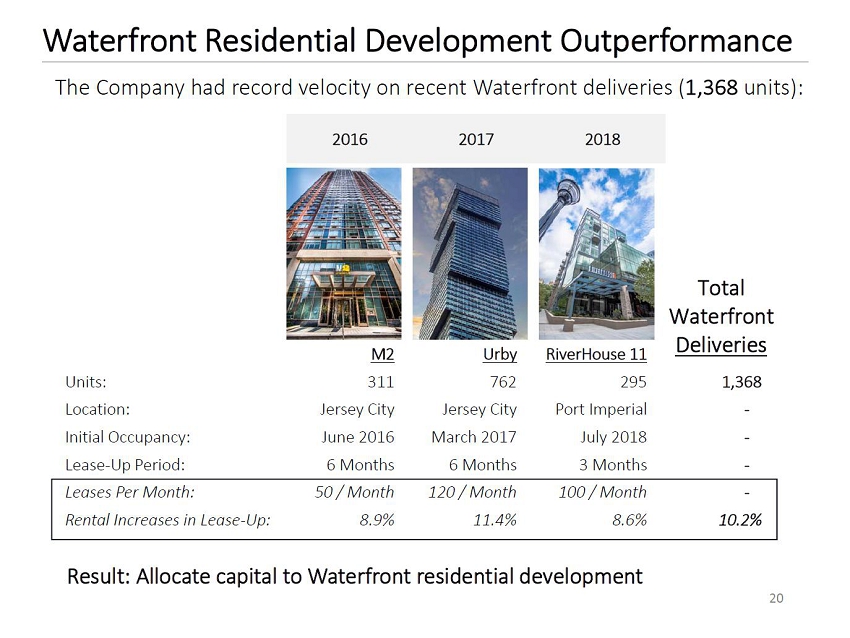
Waterfront Residential Development Outperformance 20 The Company had record velocity on recent Waterfront deliveries (1,368 units): 2016 2017 2018 M2 . Urby . RiverHouse 11 . Units: 311 . 762 . 295 . 1,368 . Location: Jersey City . Jersey City . Port Imperial . ] . Initial Occupancy: June 2016 . March 2017 . July 2018 . ] . Lease]Up Period: 6 Months . 6 Months . 3 Months .. ] . Leases Per Month: 50 / Month . 120 / Month . 100 / Month . ] . Rental Increases in Lease]Up: 8.9% . 11.4% . 8.6% . 10.2% .. Result: Allocate capital toWaterfront residential development Total Waterfront Deliveries
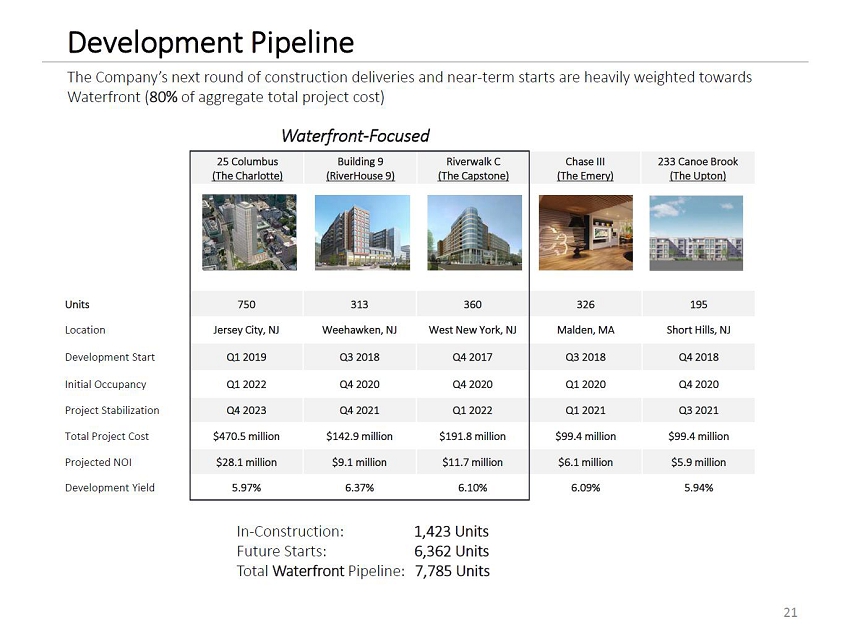
Development Pipeline 21 The Companyfs next round of construction deliveries and near]term starts are heavily weighted towards Waterfront (80% of aggregate total project cost) Units 750 313 360 326 195 Location Jersey City, NJ Weehawken, NJ West New York, NJ Malden, MA Short Hills, NJ Development Start Q1 2019 Q3 2018 Q4 2017 Q3 2018 Q4 2018 Initial Occupancy Q1 2022 Q4 2020 Q4 2020 Q1 2020 Q4 2020 Project Stabilization Q4 2023 Q4 2021 Q1 2022 Q1 2021 Q3 2021 Total Project Cost $470.5 million $142.9 million $191.8 million $99.4 million $99.4 million Projected NOI $28.1 million $9.1 million $11.7 million $6.1 million $5.9 million Development Yield 5.97% 6.37% 6.10% 6.09% 5.94% 25 Columbus (The Charlotte) Building 9 (RiverHouse 9) Riverwalk C (The Capstone) Chase III (The Emery) 233 Canoe Brook (The Upton) 21 In]Construction: 1,423 Units Future Starts: 6,362 Units Total Waterfront Pipeline: 7,785 Units Waterfront]Focused
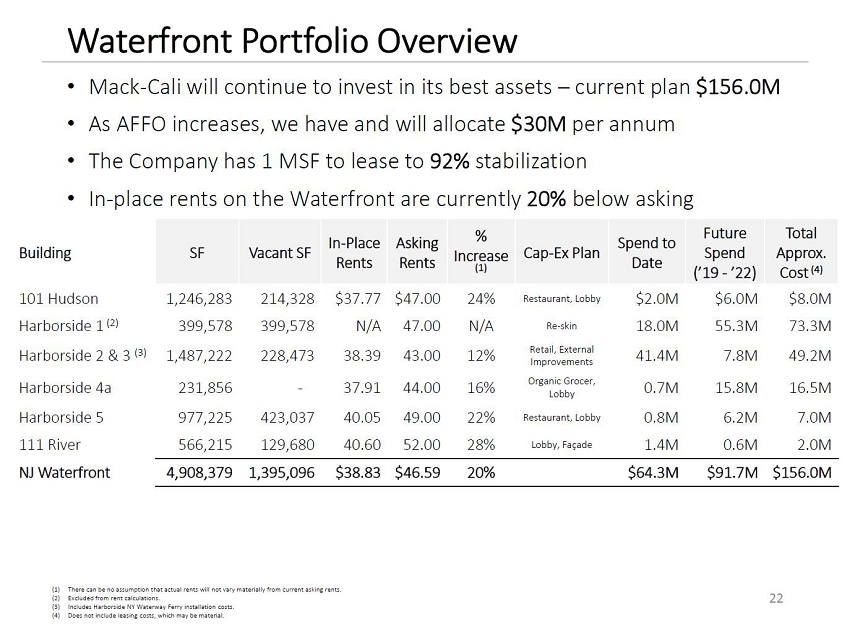
Waterfront Portfolio Overview . Mack]Cali will continue to invest in its best assets . current plan $156.0M . As AFFO increases, we have and will allocate $30M per annum . The Company has 1 MSF to lease to 92% stabilization . In]place rents on the Waterfront are currently 20% below asking 22 Building SF Vacant SF In]Place Rents Asking Rents % Increase (1) Cap]Ex Plan Spend to Date Future Spend (f19 ] f22) Total Approx. Cost (4) 101 Hudson 1,246,283 214,328 $37.77 $47.00 24% Restaurant, Lobby $2.0M $6.0M $8.0M Harborside 1 (2) 399,578 399,578 N/A 47.00 N/A Re]skin 18.0M 55.3M 73.3M Harborside 2 & 3 (3) 1,487,222 228,473 38.39 43.00 12% Retail, External Improvements 41.4M 7.8M 49.2M Harborside 4a 231,856 ] 37.91 44.00 16% Organic Grocer, Lobby 0.7M 15.8M 16.5M Harborside 5 977,225 423,037 40.05 49.00 22% Restaurant, Lobby 0.8M 6.2M 7.0M 111 River 566,215 129,680 40.60 52.00 28% Lobby, Facade 1.4M 0.6M 2.0M NJ Waterfront 4,908,379 1,395,096 $38.83 $46.59 20% $64.3M $91.7M $156.0M (1) There can be no assumption that actual rents will not vary materially from current asking rents. (2) Excluded from rent calculations. (3) Includes Harborside NY Waterway Ferry installation costs. (4) Does not include leasing costs, which may be material.
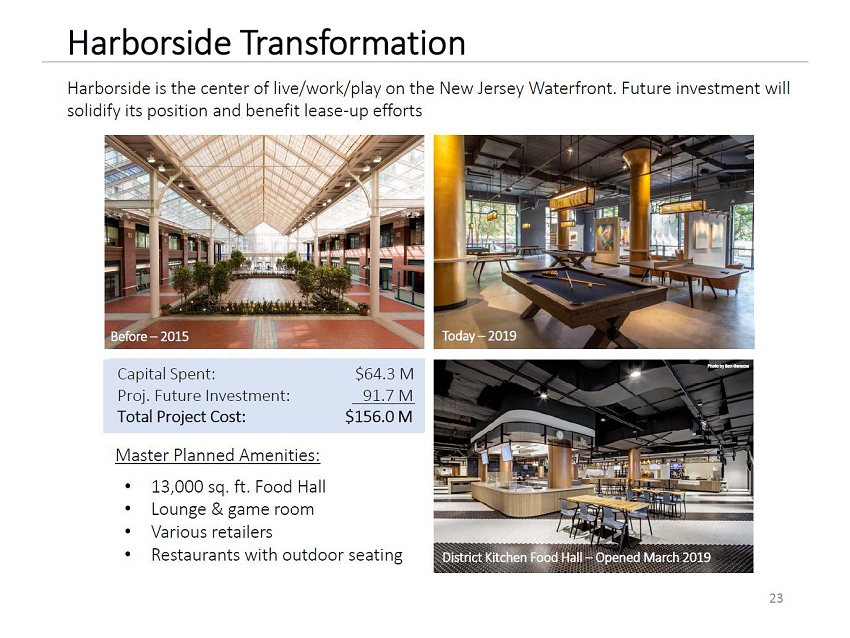
Harborside Transformation 23 Before . 2015 Today . 2019 District Kitchen Food Hall . Opened March 2019 Capital Spent: $64.3 M Proj. Future Investment: 91.7 M Total Project Cost: $156.0 M Master Planned Amenities: Harborside is the center of live/work/play on the New Jersey Waterfront. Future investment will solidify its position and benefit lease]up efforts . 13,000 sq. ft. Food Hall . Lounge & game room . Various retailers . Restaurants with outdoor seating Photo by Ben Ganscos
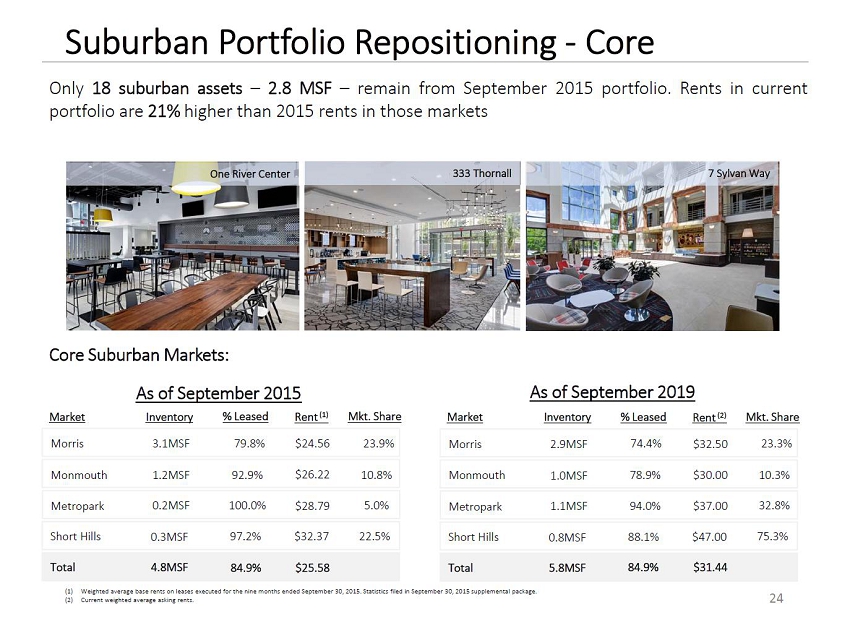
Suburban Portfolio Repositioning ] Core As of September 2015 As of September 2019 Only 18 suburban assets . 2.8 MSF . remain from September 2015 portfolio. Rents in current portfolio are 21% higher than 2015 rents in those markets Morris Monmouth Metropark Short Hills Total Market Inventory 3.1MSF 1.2MSF 0.2MSF 0.3MSF 4.8MSF % Leased 79.8% 92.9% 100.0% 97.2% 84.9% Rent (1) $24.56 $28.79 $32.37 $25.58 Mkt. Share 23.9% 10.8% 5.0% 22.5% Morris Monmouth Metropark Short Hills Total Market Inventory 2.9MSF 1.0MSF 1.1MSF 0.8MSF 5.8MSF % Leased 74.4% 78.9% 94.0% 88.1% 84.9% Rent (2) $32.50 $30.00 $37.00 $47.00 $31.44 Mkt. Share 23.3% 10.3% 32.8% 75.3% 24 One River Center Core Suburban Markets: 333 Thornall 7 Sylvan Way $26.22 (1) Weighted average base rents on leases executed for the nine months ended September 30, 2015. Statistics filed in September 30, 2015 supplemental package. (2) Current weighted average asking rents.
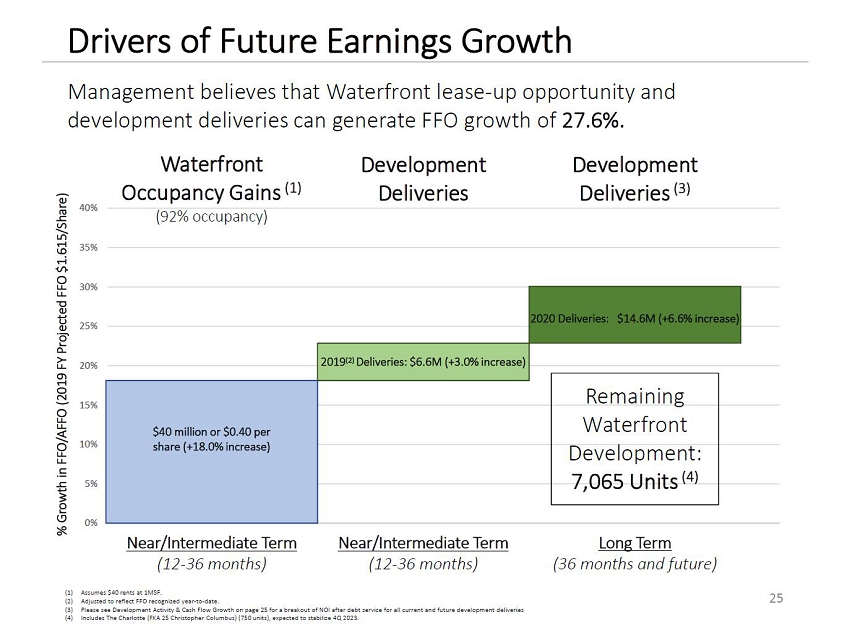
Drivers of Future Earnings Growth 25 0% 5% 10% 15% 20% 25% 30% 35% 40% X Y Z Waterfront Occupancy Gains (1) (92% occupancy) Development Deliveries Development Deliveries (3) $40 million or $0.40 per share (+18.0% increase) 2019(2) Deliveries: $6.6M (+3.0% increase) 2020 Deliveries: $14.6M (+6.6% increase) % Growth in FFO/AFFO (2019 FY Projected FFO $1.615/Share) Management believes that Waterfront lease]up opportunity and development deliveries can generate FFO growth of 27.6%. Near/Intermediate Term (12]36 months) Near/Intermediate Term (12]36 months) Long Term (36 months and future) (1) Assumes $40 rents at 1MSF. (2) Adjusted to reflect FFO recognized year]to]date. (3) Please see Development Activity & Cash Flow Growth on page 25 for a breakout of NOI after debt service for all current and future development deliveries (4) Includes The Charlotte (FKA 25 Christopher Columbus) (750 units), expected to stabilize 4Q 2023. Remaining Waterfront Development: 7,065 Units (4)

26 Appendix
Average Revenue Per Home: Calculated as total apartment revenue for the quarter ended September 30, divided by the average percent occupied for the quarter ended September 30, 2018, divided by the number of apartments and divided by three. Operating Communities: Communities that have achieved Project Stabilization. Class A Suburban: Long]term hold office properties in targeted submarkets; formerly defined as Urban Core. Predevelopment Communities: Communities where the Company has commenced predevelopment activities that have a near]term projected project start. Consolidated Operating Communities: Wholly owned communities and communities whereby the Company has a controlling interest. Project Completion: As evidenced by a certificate of completion by a certified architect or issuance of a final or temporary certificate of occupancy. Flex Parks: Primarily office/flex properties, including any office buildings located within the respective park. Project Stabilization: Lease]Up communities that have achieved over 95 Percentage Leased for six consecutive weeks. Future Development: Represents land inventory currently owned or controlled by the Company. Projected Stabilized NOI: Pro forma NOI for Lease]Up, In]Construction or Future Development communities upon achieving Project Stabilization. Gross Asset Value (GAV): The metric represents the projected value of the Companyfs interest after accounting for pro rata share of 3rd party value. Projected Stabilized Yield: Represents Projected Stabilized NOI divided by Total Costs. Identified Repurposing Communities: Communities not currently owned by RRT, which have been identified for transfer from Mack]Cali to RRT for residential repurposing. Repurposing Communities: Commercial holdings of the Company which have been targeted for rezoning from their existing office to new multi]family use and have a likelihood of achieving desired rezoning and project approvals. In]Construction Communities: Communities that are under construction and have not yet commenced initial leasing activities. Subordinated Joint Ventures: Joint Venture communities where the Company's ownership distributions are subordinate to payment of priority capital preferred returns. Lease]Up Communities: Communities that have commenced initial operations but have not yet achieved Project Stabilization. Suburban: Long]term hold office properties (excluding Class A Suburban and Waterfront locations); formerly defined as Suburban Core MCRC Capital: Represents cash equity that the Company has contributed or has a future obligation to contribute to a project. Third Party Capital: Capital invested by third parties and not Mack]Cali. Net Asset Value (NAV): The metric represents the net projected value of the Companyfs interest after accounting for all priority debt and equity payments. The metric includes capital invested by the Company. Total Costs: Represents full project budget, including land and developer fees, and interest expense through Project Completion. Net Operating Income (NOI): Total property revenues less real estate taxes, utilities and operating expenses Waterfront: Office assets located on NJ Hudson River waterfront. Non]Core: Properties designated for eventual sale/disposition or repositioning/redevelopment. Global Definitions 27
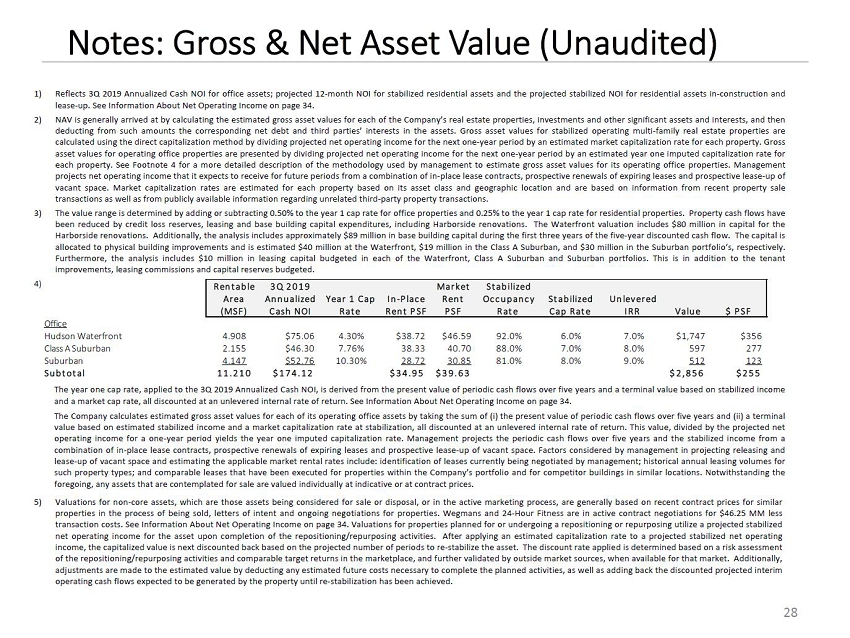
Notes: Gross & Net Asset Value (Unaudited) 28 28 The year one cap rate, applied to the 3Q 2019 Annualized Cash NOI, is derived from the present value of periodic cash flows over five years and a terminal value based on stabilized income and a market cap rate, all discounted at an unlevered internal rate of return. See Information About Net Operating Income on page 34. The Company calculates estimated gross asset values for each of its operating office assets by taking the sum of (i) the present value of periodic cash flows over five years and (ii) a terminal value based on estimated stabilized income and a market capitalization rate at stabilization, all discounted at an unlevered internal rate of return. This value, divided by the projected net operating income for a one]year period yields the year one imputed capitalization rate. Management projects the periodic cash flows over five years and the stabilized income from a combination of in]place lease contracts, prospective renewals of expiring leases and prospective lease]up of vacant space. Factors considered by management in projecting releasing and lease]up of vacant space and estimating the applicable market rental rates include: identification of leases currently being negotiated by management; historical annual leasing volumes for such property types; and comparable leases that have been executed for properties within the Companyfs portfolio and for competitor buildings in similar locations. Notwithstanding the foregoing, any assets that are contemplated for sale are valued individually at indicative or at contract prices. 1) Reflects 3Q 2019 Annualized Cash NOI for office assets; projected 12]month NOI for stabilized residential assets and the projected stabilized NOI for residential assets in]construction and lease]up. See Information About Net Operating Income on page 34. 2) NAV is generally arrived at by calculating the estimated gross asset values for each of the Companyfs real estate properties, investments and other significant assets and interests, and then deducting from such amounts the corresponding net debt and third partiesf interests in the assets. Gross asset values for stabilized operating multi]family real estate properties are calculated using the direct capitalization method by dividing projected net operating income for the next one]year period by an estimated market capitalization rate for each property. Gross asset values for operating office properties are presented by dividing projected net operating income for the next one]year period by an estimated year one imputed capitalization rate for each property. See Footnote 4 for a more detailed description of the methodology used by management to estimate gross asset values for its operating office properties. Management projects net operating income that it expects to receive for future periods from a combination of in]place lease contracts, prospective renewals of expiring leases and prospective lease]up of vacant space. Market capitalization rates are estimated for each property based on its asset class and geographic location and are based on information from recent property sale transactions as well as from publicly available information regarding unrelated third]party property transactions. 3) The value range is determined by adding or subtracting 0.50% to the year 1 cap rate for office properties and 0.25% to the year 1 cap rate for residential properties. Property cash flows have been reduced by credit loss reserves, leasing and base building capital expenditures, including Harborside renovations. The Waterfront valuation includes $80 million in capital for the Harborside renovations. Additionally, the analysis includes approximately $89 million in base building capital during the first three years of the five]year discounted cash flow. The capital is allocated to physical building improvements and is estimated $40 million at the Waterfront, $19 million in the Class A Suburban, and $30 million in the Suburban portfoliofs, respectively. Furthermore, the analysis includes $10 million in leasing capital budgeted in each of the Waterfront, Class A Suburban and Suburban portfolios. This is in addition to the tenant improvements, leasing commissions and capital reserves budgeted. 4) 5) Valuations for non]core assets, which are those assets being considered for sale or disposal, or in the active marketing process, are generally based on recent contract prices for similar properties in the process of being sold, letters of intent and ongoing negotiations for properties. Wegmans and 24]Hour Fitness are in active contract negotiations for $46.25 MM less transaction costs. See Information About Net Operating Income on page 34. Valuations for properties planned for or undergoing a repositioning or repurposing utilize a projected stabilized net operating income for the asset upon completion of the repositioning/repurposing activities. After applying an estimated capitalization rate to a projected stabilized net operating income, the capitalized value is next discounted back based on the projected number of periods to re]stabilize the asset. The discount rate applied is determined based on a risk assessment of the repositioning/repurposing activities and comparable target returns in the marketplace, and further validated by outside market sources, when available for that market. Additionally, adjustments are made to the estimated value by deducting any estimated future costs necessary to complete the planned activities, as well as adding back the discounted projected interim operating cash flows expected to be generated by the property until re]stabilization has been achieved. Rentable 3Q 2019 Market Stabilized Area Annualized Year 1 Cap In]Place Rent Oc cupancy Stabilized Unlevered (MSF) Cash NOI Rate Rent PSF PSF Rate Cap Rate IRR Value $ PSF Office Hudson Waterfront 4.908 $75.06 4.30% $38.72 $46.59 92.0% 6.0% 7.0% $1,747 $356 Class A Suburban 2.155 $46.30 7.76% 38.33 40.70 88.0% 7.0% 8.0% 597 277 Suburban 4.147 $52.76 10.30% 28.72 30.85 81.0% 8.0% 9.0% 512 123 Subtotal 11.210 $174.12 $34.95 $39.63 $2,856 $255
6) Includes the Company's ownership interests in the Hyatt Regency Jersey City and two office joint venture properties. 7) The value of land is based on a combination of recent or pending transactions for land parcels within our relevant markets and unrelated third parties, and sometimes may utilize land appraisals for certain markets, if available for other purposes, such as for transaction financing. Further, we consider what a land parcelfs value would need to be when combined with all other development costs to yield what we believe to be an appropriate target rate of return for a development project. The per apartment unit or per square foot office space values are derived by dividing the aggregate land value by the number of potential apartment units or square feet of office space the land can accommodate. The number of potential units or square feet of office space a land parcel can accommodate is most commonly governed by either in]place governmental approvals or density regulations set forth by existing zoning guidelines. 8) Joint venture investments are generally valued by: applying a capitalization rate to projected NOI for the joint venturefs asset (which is similar to the process for valuing those assets wholly owned by the Company, as described above and previously), and deducting any joint venture level debt and any value allocable to joint venture partnersf interests. Includes Roselandfs last residential subordinate interest (Metropolitan at 40 Park) and commercial subordinate interests. 9) The valuation approach for assets in]construction or lease]up are similar to that applied to assets undergoing repositioning/repurposing, as described above. After applying an estimated capitalization rate, currently ranging from 4.5% to 5.25%, to a projected stabilized net operating income, estimated to total approximately $46.6 million upon completion of the construction or lease]up activities, the Company deducts any estimated future costs totaling $565.9 million required to complete construction of the asset to arrive at an estimated value attributable to the asset. The Company then discounts the capitalized value back based on the projected number of periods to reach stabilization. The discount rate applied, currently ranging from 7% to 9.75%, is determined based on a risk assessment of the development activities and comparable target returns in the marketplace. The Company then adds back the discounted projected interim cash flows expected to be generated during the projected lease]up period to reach stabilization. 10) Represents the discount to stabilized value applied to assets that have not yet achieved their respective Projected Stabilized NOI due to construction, lease]up or renovation. See Information About Net Operating Income on page 34. 11) The residential valuation analysis totals to a Roseland NAV of $2,235,000,000, with the companyfs share of this NAV of $1,787,000,000 (gMCRC Shareh). This latter amount represents the company's share of Roseland NAV, net of the $448,000,000 attributable to Rockpoint's noncontrolling interest. 12) The decrease in the approximate NAV per share of $1.42 from June 30, 2019 to September 30, 2019 is due primarily to longer absorption timing, increased capital and reduced terminal projected occupancies. Overall, NAV is arrived at by calculating the estimated gross asset values for each of their real estate properties, investments and other significant assets and interests, and then deducting from such amounts the corresponding net debt and third partiesf interests in the assets. Gross asset values for the operating real estate properties are calculated using the direct capitalization method by dividing projected net operating income for a one year period by an estimated current capitalization rate for each property. For each operating property, management projects net operating income that it expects to receive for future periods from a combination of in]place lease contracts, prospective renewals of expiring leases and prospective lease]up of vacant space. Factors considered by management in projecting releasing and lease]up of vacant space and estimating the applicable market rental rates include: identification of leases currently being negotiated by management; historical annual leasing volumes for such property types; and comparable leases that have been executed for properties within the Registrantsf portfolio and for competitor buildings in similar locations. A capitalization rate is estimated for each property based on its asset class and geographic location. Estimates of capitalization rates are based on information from recent property sale transactions as well as from publicly available information regarding unrelated third party property transactions. The use of NAV as a measure of value is subject to certain inherent limitations. The assessment of the estimated NAV of a particular property is subjective in that it involves estimates and assumptions and can be calculated using various acceptable methods. The Companyfs methods of determining NAV may differ from the methods used by other companies. Accordingly, the Companyfs estimated NAV may not be comparable to measures used by other companies. As with any valuation methodology, the methodologies utilized by the Company in estimating NAV are based upon a number of estimates, assumptions, judgments or opinions that may or may not prove to be correct. Capitalization rates obtained from publicly available sources also are critical to the NAV calculation and are subject to the sources selected and variability of market conditions at the time. Investors in the Company are cautioned that NAV does not represent (i) the amount at which the Companyfs securities would trade at a national securities exchange, (ii) the amount that a security holder would obtain if he or she tried to sell his or her securities, (iii) the amount that a security holder would receive if the Company liquidated its assets and distributed the proceeds after paying all of their expenses and liabilities or (iv) the book value of the Companyfs real estate, which is generally based on the amortized cost of the property, subject to certain adjustments. 29 29 Notes: Gross & Net Asset Value (Unaudited) Information About Net Asset Value (NAV)
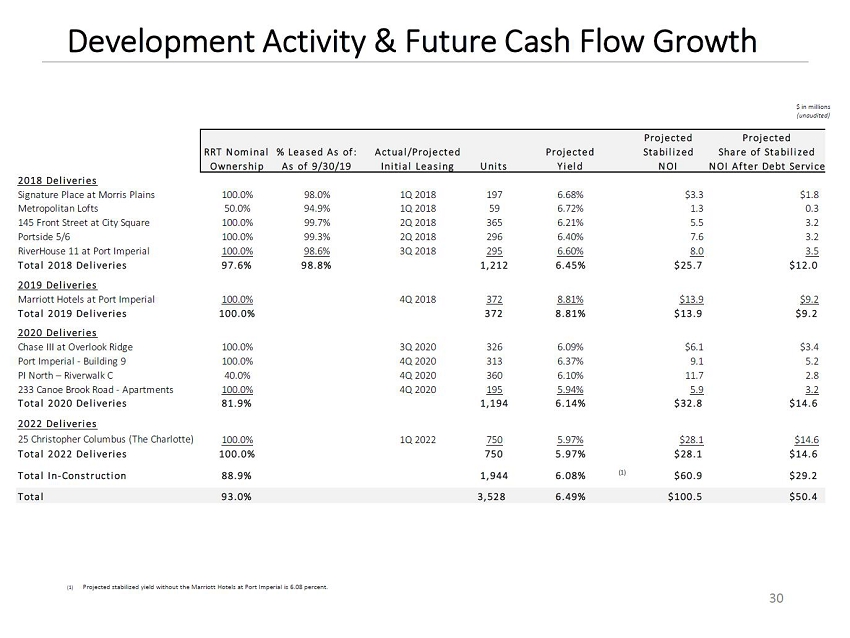
(1) Projected stabilized yield without the Marriott Hotels at Port Imperial is 6.08 percent. $ in millions (unaudited) Development Activity & Future Cash Flow Growth 30 Projected Projected RRT Nominal % Leased As of : Actual /Projected Projected Stabi l i zed Share of Stabi l i zed Ownership As of 9/30/19 Ini tial Leasing Uni ts Yi eld NOI NOI After Debt Service 2018 Del i veries Signature Place at Morris Plains 100.0% 98.0% 1Q 2018 197 6.68% $3.3 $1.8 Metropolitan Lofts 50.0% 94.9% 1Q 2018 59 6.72% 1.3 0.3 145 Front Street at City Square 100.0% 99.7% 2Q 2018 365 6.21% 5.5 3.2 Portside 5/6 100.0% 99.3% 2Q 2018 296 6.40% 7.6 3.2 RiverHouse 11 at Port Imperial 100.0% 98.6% 3Q 2018 295 6.60% 8.0 3.5 Total 2018 Del iveries 97.6% 98.8% 1,212 6.45% $25.7 $12.0 2019 Del i veries Marriott Hotels at Port Imperial 100.0% 4Q 2018 372 8.81% $13.9 $9.2 Total 2019 Del iveries 100.0% 372 8.81% $13.9 $9.2 2020 Del i veries Chase III at Overlook Ridge 100.0% 3Q 2020 326 6.09% $6.1 $3.4 Port Imperial ] Building 9 100.0% 4Q 2020 313 6.37% 9.1 5.2 PI North . Riverwalk C 40.0% 4Q 2020 360 6.10% 11.7 2.8 233 Canoe Brook Road ] Apartments 100.0% 4Q 2020 195 5.94% 5.9 3.2 Total 2020 Del iveries 81.9% 1,194 6.14% $32.8 $14.6 2022 Del i veries 25 Christopher Columbus (The Charlotte) 100.0% 1Q 2022 750 5.97% $28.1 $14.6 Total 2022 Del iveries 100.0% 750 5.97% $28.1 $14.6 Total In]Construction 88.9% 1,944 6.08% (1) $60.9 $29.2 Total 93.0% 3,528 6.49% $100.5 $50.4
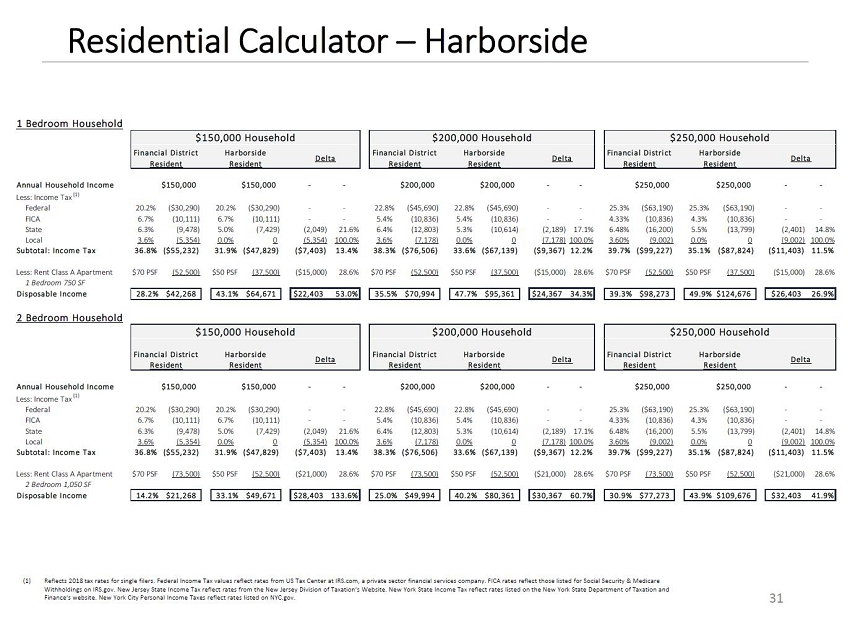
Residential Calculator . Harborside 31 1 Bedroom Household Annual Household Income ] ] ] ] ] ] Less: Income Tax (1) Federal 20.2% ($30,290) 20.2% ($30,290) ] ] 22.8% ($45,690) 22.8% ($45,690) ] ] 25.3% ($63,190) 25.3% ($63,190) ] ] FICA 6.7% (10,111) 6.7% (10,111) ] ] 5.4% (10,836) 5.4% (10,836) ] ] 4.33% (10,836) 4.3% (10,836) ] ] State 6.3% (9,478) 5.0% (7,429) (2,049) 21.6% 6.4% (12,803) 5.3% (10,614) (2,189) 17.1% 6.48% (16,200) 5.5% (13,799) (2,401) 14.8% Local 3.6% (5,354) 0.0% 0 (5,354) 100.0% 3.6% (7,178) 0.0% 0 (7,178) 100.0% 3.60% (9,002) 0.0% 0 (9,002) 100.0% Subtotal: Income Tax 36.8% ($55,232) 31.9% ($47,829) ($7,403) 13.4% 38.3% ($76,506) 33.6% ($67,139) ($9,367) 12.2% 39.7% ($99,227) 35.1% ($87,824) ($11,403) 11.5% Less: Rent Class A Apartment $70 PSF (52,500) $50 PSF (37,500) ($15,000) 28.6% $70 PSF (52,500) $50 PSF (37,500) ($15,000) 28.6% $70 PSF (52,500) $50 PSF (37,500) ($15,000) 28.6% 1 Bedroom 750 SF Disposable Income 28.2% $42,268 43.1% $64,671 $22,403 53.0% 35.5% $70,994 47.7% $95,361 $24,367 34.3% 39.3% $98,273 49.9% $124,676 $26,403 26.9% 2 Bedroom Household Annual Household Income ] ] ] ] ] ] Less: Income Tax (1) Federal 20.2% ($30,290) 20.2% ($30,290) ] ] 22.8% ($45,690) 22.8% ($45,690) ] ] 25.3% ($63,190) 25.3% ($63,190) ] ] FICA 6.7% (10,111) 6.7% (10,111) ] ] 5.4% (10,836) 5.4% (10,836) ] ] 4.33% (10,836) 4.3% (10,836) ] ] State 6.3% (9,478) 5.0% (7,429) (2,049) 21.6% 6.4% (12,803) 5.3% (10,614) (2,189) 17.1% 6.48% (16,200) 5.5% (13,799) (2,401) 14.8% Local 3.6% (5,354) 0.0% 0 (5,354) 100.0% 3.6% (7,178) 0.0% 0 (7,178) 100.0% 3.60% (9,002) 0.0% 0 (9,002) 100.0% Subtotal: Income Tax 36.8% ($55,232) 31.9% ($47,829) ($7,403) 13.4% 38.3% ($76,506) 33.6% ($67,139) ($9,367) 12.2% 39.7% ($99,227) 35.1% ($87,824) ($11,403) 11.5% Less: Rent Class A Apartment $70 PSF (73,500) $50 PSF (52,500) ($21,000) 28.6% $70 PSF (73,500) $50 PSF (52,500) ($21,000) 28.6% $70 PSF (73,500) $50 PSF (52,500) ($21,000) 28.6% 2 Bedroom 1,050 SF Disposable Income 14.2% $21,268 33.1% $49,671 $28,403 133.6% 25.0% $49,994 40.2% $80,361 $30,367 60.7% 30.9% $77,273 43.9% $109,676 $32,403 41.9% $150,000 $150,000 $200,000 $200,000 $250,000 $250,000 $250,000 $150,000 Household $200,000 Household $250,000 Household Financial District Resident Harborside Resident Delta Financial District Resident Harborside Resident Delta Financial District Resident Harborside Resident Delta $150,000 $150,000 $200,000 $200,000 $250,000 $150,000 Household $200,000 Household $250,000 Household Financial District Resident Harborside Resident Delta Financial District Resident Harborside Resident Delta Financial District Resident Harborside Resident Delta (1) Reflects 2018 tax rates for single filers. Federal Income Tax values reflect rates from US Tax Center at IRS.com, a private sector financial services company. FICA rates reflect those listed for Social Security & Medicare Withholdings on IRS.gov. New Jersey State Income Tax reflect rates from the New Jersey Division of Taxationfs Website. New York State Income Tax reflect rates listed on the New York State Department of Taxation and Financefs website. New York City Personal Income Taxes reflect rates listed on NYC.gov.
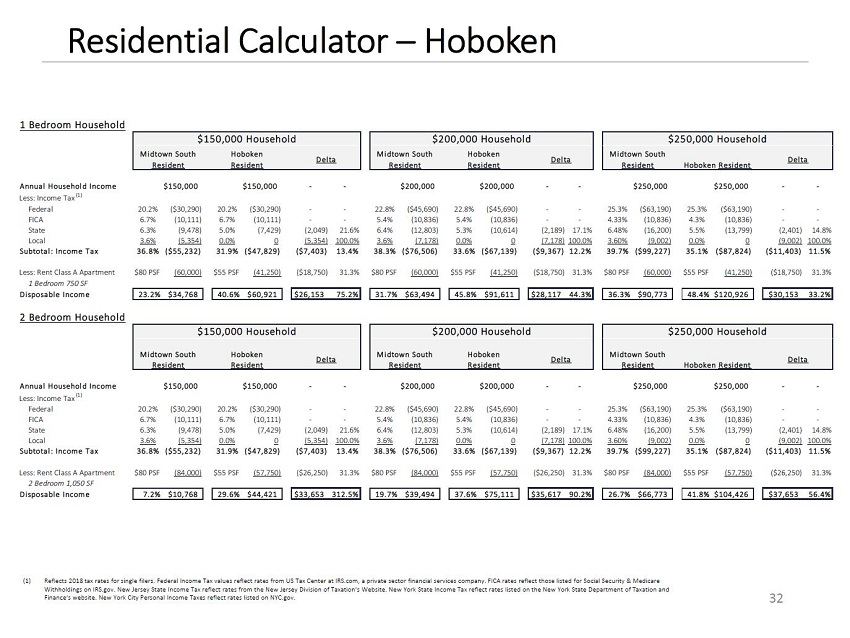
Residential Calculator . Hoboken 32 (1) Reflects 2018 tax rates for single filers. Federal Income Tax values reflect rates from US Tax Center at IRS.com, a private sector financial services company. FICA rates reflect those listed for Social Security & Medicare Withholdings on IRS.gov. New Jersey State Income Tax reflect rates from the New Jersey Division of Taxationfs Website. New York State Income Tax reflect rates listed on the New York State Department of Taxation and Financefs website. New York City Personal Income Taxes reflect rates listed on NYC.gov. 1 Bedroom Household Annual Household Income ] ] ] ] ] ] Less: Income Tax (1) Federal 20.2% ($30,290) 20.2% ($30,290) ] ] 22.8% ($45,690) 22.8% ($45,690) ] ] 25.3% ($63,190) 25.3% ($63,190) ] ] FICA 6.7% (10,111) 6.7% (10,111) ] ] 5.4% (10,836) 5.4% (10,836) ] ] 4.33% (10,836) 4.3% (10,836) ] ] State 6.3% (9,478) 5.0% (7,429) (2,049) 21.6% 6.4% (12,803) 5.3% (10,614) (2,189) 17.1% 6.48% (16,200) 5.5% (13,799) (2,401) 14.8% Local 3.6% (5,354) 0.0% 0 (5,354) 100.0% 3.6% (7,178) 0.0% 0 (7,178) 100.0% 3.60% (9,002) 0.0% 0 (9,002) 100.0% Subtotal: Income Tax 36.8% ($55,232) 31.9% ($47,829) ($7,403) 13.4% 38.3% ($76,506) 33.6% ($67,139) ($9,367) 12.2% 39.7% ($99,227) 35.1% ($87,824) ($11,403) 11.5% Less: Rent Class A Apartment $80 PSF (60,000) $55 PSF (41,250) ($18,750) 31.3% $80 PSF (60,000) $55 PSF (41,250) ($18,750) 31.3% $80 PSF (60,000) $55 PSF (41,250) ($18,750) 31.3% 1 Bedroom 750 SF Disposable Income 23.2% $34,768 40.6% $60,921 $26,153 75.2% 31.7% $63,494 45.8% $91,611 $28,117 44.3% 36.3% $90,773 48.4% $120,926 $30,153 33.2% 2 Bedroom Household Annual Household Income ] ] ] ] ] ] Less: Income Tax (1) Federal 20.2% ($30,290) 20.2% ($30,290) ] ] 22.8% ($45,690) 22.8% ($45,690) ] ] 25.3% ($63,190) 25.3% ($63,190) ] ] FICA 6.7% (10,111) 6.7% (10,111) ] ] 5.4% (10,836) 5.4% (10,836) ] ] 4.33% (10,836) 4.3% (10,836) ] ] State 6.3% (9,478) 5.0% (7,429) (2,049) 21.6% 6.4% (12,803) 5.3% (10,614) (2,189) 17.1% 6.48% (16,200) 5.5% (13,799) (2,401) 14.8% Local 3.6% (5,354) 0.0% 0 (5,354) 100.0% 3.6% (7,178) 0.0% 0 (7,178) 100.0% 3.60% (9,002) 0.0% 0 (9,002) 100.0% Subtotal: Income Tax 36.8% ($55,232) 31.9% ($47,829) ($7,403) 13.4% 38.3% ($76,506) 33.6% ($67,139) ($9,367) 12.2% 39.7% ($99,227) 35.1% ($87,824) ($11,403) 11.5% Less: Rent Class A Apartment $80 PSF (84,000) $55 PSF (57,750) ($26,250) 31.3% $80 PSF (84,000) $55 PSF (57,750) ($26,250) 31.3% $80 PSF (84,000) $55 PSF (57,750) ($26,250) 31.3% 2 Bedroom 1,050 SF Disposable Income 7.2% $10,768 29.6% $44,421 $33,653 312.5% 19.7% $39,494 37.6% $75,111 $35,617 90.2% 26.7% $66,773 41.8% $104,426 $37,653 56.4% $150,000 $150,000 $200,000 $200,000 $250,000 $250,000 $250,000 $150,000 Household $200,000 Household $250,000 Household Midtown South Resident Hoboken Resident Delta Midtown South Resident Hoboken Resident Delta Midtown South Resident Hoboken Resident Delta $150,000 $150,000 $200,000 $200,000 $250,000 $150,000 Household $200,000 Household $250,000 Household Midtown South Resident Hoboken Resident Delta Midtown South Resident Hoboken Resident Delta Midtown South Resident Hoboken Resident Delta
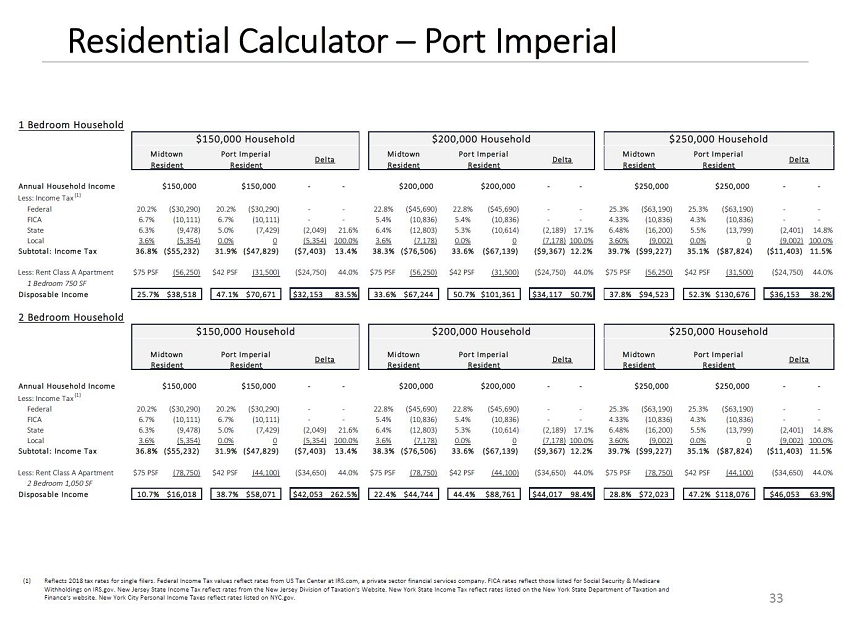
Residential Calculator . Port Imperial 33 (1) Reflects 2018 tax rates for single filers. Federal Income Tax values reflect rates from US Tax Center at IRS.com, a private sector financial services company. FICA rates reflect those listed for Social Security & Medicare Withholdings on IRS.gov. New Jersey State Income Tax reflect rates from the New Jersey Division of Taxationfs Website. New York State Income Tax reflect rates listed on the New York State Department of Taxation and Financefs website. New York City Personal Income Taxes reflect rates listed on NYC.gov. 1 Bedroom Household Annual Household Income ] ] ] ] ] ] Less: Income Tax (1) Federal 20.2% ($30,290) 20.2% ($30,290) ] ] 22.8% ($45,690) 22.8% ($45,690) ] ] 25.3% ($63,190) 25.3% ($63,190) ] ] FICA 6.7% (10,111) 6.7% (10,111) ] ] 5.4% (10,836) 5.4% (10,836) ] ] 4.33% (10,836) 4.3% (10,836) ] ] State 6.3% (9,478) 5.0% (7,429) (2,049) 21.6% 6.4% (12,803) 5.3% (10,614) (2,189) 17.1% 6.48% (16,200) 5.5% (13,799) (2,401) 14.8% Local 3.6% (5,354) 0.0% 0 (5,354) 100.0% 3.6% (7,178) 0.0% 0 (7,178) 100.0% 3.60% (9,002) 0.0% 0 (9,002) 100.0% Subtotal: Income Tax 36.8% ($55,232) 31.9% ($47,829) ($7,403) 13.4% 38.3% ($76,506) 33.6% ($67,139) ($9,367) 12.2% 39.7% ($99,227) 35.1% ($87,824) ($11,403) 11.5% Less: Rent Class A Apartment $75 PSF (56,250) $42 PSF (31,500) ($24,750) 44.0% $75 PSF (56,250) $42 PSF (31,500) ($24,750) 44.0% $75 PSF (56,250) $42 PSF (31,500) ($24,750) 44.0% 1 Bedroom 750 SF Disposable Income 25.7% $38,518 47.1% $70,671 $32,153 83.5% 33.6% $67,244 50.7% $101,361 $34,117 50.7% 37.8% $94,523 52.3% $130,676 $36,153 38.2% 2 Bedroom Household Annual Household Income ] ] ] ] ] ] Less: Income Tax (1) Federal 20.2% ($30,290) 20.2% ($30,290) ] ] 22.8% ($45,690) 22.8% ($45,690) ] ] 25.3% ($63,190) 25.3% ($63,190) ] ] FICA 6.7% (10,111) 6.7% (10,111) ] ] 5.4% (10,836) 5.4% (10,836) ] ] 4.33% (10,836) 4.3% (10,836) ] ] State 6.3% (9,478) 5.0% (7,429) (2,049) 21.6% 6.4% (12,803) 5.3% (10,614) (2,189) 17.1% 6.48% (16,200) 5.5% (13,799) (2,401) 14.8% Local 3.6% (5,354) 0.0% 0 (5,354) 100.0% 3.6% (7,178) 0.0% 0 (7,178) 100.0% 3.60% (9,002) 0.0% 0 (9,002) 100.0% Subtotal: Income Tax 36.8% ($55,232) 31.9% ($47,829) ($7,403) 13.4% 38.3% ($76,506) 33.6% ($67,139) ($9,367) 12.2% 39.7% ($99,227) 35.1% ($87,824) ($11,403) 11.5% Less: Rent Class A Apartment $75 PSF (78,750) $42 PSF (44,100) ($34,650) 44.0% $75 PSF (78,750) $42 PSF (44,100) ($34,650) 44.0% $75 PSF (78,750) $42 PSF (44,100) ($34,650) 44.0% 2 Bedroom 1,050 SF Disposable Income 10.7% $16,018 38.7% $58,071 $42,053 262.5% 22.4% $44,744 44.4% $88,761 $44,017 98.4% 28.8% $72,023 47.2% $118,076 $46,053 63.9% $150,000 $150,000 $200,000 $200,000 $250,000 $250,000 $250,000 $150,000 Household $200,000 Household $250,000 Household Midtown Resident Port Imperial Resident Delta Midtown Resident Port Imperial Resident Delta Midtown Resident Port Imperial Resident Delta $150,000 $150,000 $200,000 $200,000 $250,000 $150,000 Household $200,000 Household $250,000 Household Midtown Resident Port Imperial Resident Delta Midtown Resident Port Imperial Resident Delta Midtown Resident Port Imperial Resident Delta
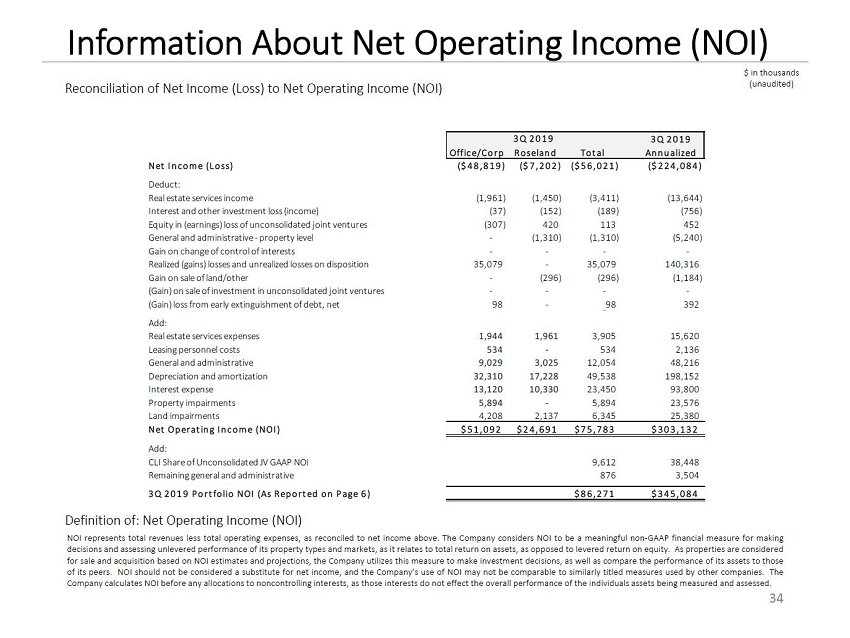
Information About Net Operating Income (NOI) NOI represen3Qts 2t0o18tal revenues less total operating expenses, as reconciled to net income above. The Company considers NOI to be a meaningful non]GAAP financial measure for making decisions and assessing unlevered performance of its property types and markets, as it relates to total return on assets, as opposed to levered return on equity. As properties are considered for sale and acquisition based on NOI estimates and projections, the Company utilizes this measure to make investment decisions, as well as compare the performance of its assets to those of its peers. NOI should not be considered a substitute for net income, and the Companyfs use of NOI may not be comparable to similarly titled measures used by other companies. The Company calculates NOI before any allocations to noncontrolling interests, as those interests do not effect the overall performance of the individuals assets being measured and assessed. Definition of: Net Operating Income (NOI) Reconciliation of Net Income (Loss) to Net Operating Income (NOI) $ in thousands (unaudited) 3Q 2019 Office/Corp Roseland Tot al Annualized Net Income (Loss) ($48,819) ($7,202) ($56,021) ($224,084) Deduct: Real estate services income (1,961) (1,450) (3,411) (13,644) Interest and other investment loss (income) (37) (152) (189) (756) Equity in (earnings) loss of unconsolidated joint ventures (307) 420 113 452 General and administrative ] property level ] (1,310) (1,310) (5,240) Gain on change of control of interests ] ] ] ] Realized (gains) losses and unrealized losses on disposition 35,079 ] 35,079 140,316 Gain on sale of land/other ] (296) (296) (1,184) (Gain) on sale of investment in unconsolidated joint ventures ] ] ] ] (Gain) loss from early extinguishment of debt, net 98 ] ] 98 392 Add: Real estate services expenses 1,944 1,961 3,905 15,620 Leasing personnel costs 534 ] 534 2,136 General and administrative 9,029 3,025 12,054 48,216 Depreciation and amortization 32,310 17,228 49,538 198,152 Interest expense 13,120 10,330 23,450 93,800 Property impairments 5,894 ] 5,894 23,576 Land impairments 4,208 2,137 6,345 25,380 Net Operat ing Income (NOI ) $51,092 $24,691 $75,783 $303,132 Add: CLI Share of Unconsolidated JV GAAP NOI 9,612 38,448 Remaining general and administrative 876 3,504 3Q 2019 Port folio NOI (As Reported on Page 6) $86 ,271 $345 ,084 3Q 2019 34