. Mack-Cali Realty Corporation Supplemental Operating and Financial Data 4Q 2018
Table of Contents Company Highlights Page Company Overview 4 Key Financial Metrics 6 Net Asset Value 7 Financial Schedules 11 Debt Statistics 19 Joint Ventures 22 Investment Activity 23 2019 Guidance 24 Office Portfolio Property Listing 27 Office Operating Schedules 29 Roseland Residential Portfolio Roseland Highlights 35 Financial Statements 37 Roseland Operating Schedules 39 4Q 2018 2 This Supplemental Operating and Financial Data should be read in connection with the company’s fourth quarter 2018 earnings press release (included as Exhibit 99.2 of the company’s Current Report on Form 8-K, filed on February 20, 2019) as certain disclosures, definitions and reconciliations in such announcement have not been included in this Supplemental Operating and Financial Data. Building 9 at Port Imperial- Weehawken, NJ (In-Construction) 25 Christopher Columbus - Jersey City, NJ (1Q 2019 Start) Harborside Plaza 8/9 - Jersey City, NJ (Future)
Company Highlights 4Q 2018

Company Overview 4 4Q 2018 Corporate Profile Mack-Cali (CLI) is a fully integrated REIT with a dual asset platform comprised of core office and growing residential holdings. We are geographically focused on the high barrier-to-entry Hudson River waterfront targeting cash flow growth through all economic cycles. Company Objectives Mack-Cali’s office portfolio strives to achieve the highest possible rents in select markets with a continuous focus on improving the quality of our portfolio. Mack-Cali’s residential portfolio, via our Roseland Residential platform, is a market-leading residential developer and owner of Class A properties. We expect continued growth and cash flow contribution from our Roseland holdings as our development pipeline of active construction projects and planned starts is put into service. Company Highlights Residence Inn at Port Imperial – Weehawken, NJ Opened December 2018
5 4Q 2018 Company Highlights 4Q 2018 Performance Highlights Achieved Core FFO of $45.3 million, or $0.45 per share Produced AFFO of $21.6 million Office: Leased 358,642 square feet of office space; finished 4Q 2018 at 83.2% leased (excluding non-core) Residential: The operating portfolio, excluding lease-up properties, finished 4Q at 95.9% leased Commenced construction on 233 Canoe Brook, a 200-unit community directly adjacent to the Short Hills Mall and the second success from the Company’s suburban office repurposing efforts Subsequent to year-end, commenced construction on 25 Christopher Columbus, a 750-unit premier residential tower in downtown Jersey City 4Q 2018 Lease-Ups/Stabilizations In December 2018, the Residence Inn at Port Imperial commenced operations. The hotel, a 164-key limited service Marriott in Weehawken, NJ, is the first phase of a 372-key, dual-flag development, with the Marriott Envue projected to open in June 2019. In 4Q 2018, continued strong leasing activity at its other 2018 deliveries. By year-end 2018, the company stabilized four of five 2018 deliveries (847 units) and achieved an average stabilized yield of 6.5%. As of February 18, the projects are leased as follows: RiverHouse 11 at Port Imperial, a 295-unit community in Weehawken, NJ: 97.6% leased – STABLE Portside 5/6 at East Pier, a 296-unit continuation of our East Boston master-planned community: 95.9% leased – STABLE Signature Place, a 197-unit development in Morris Plains, NJ: 97.0% leased – STABLE Metropolitan Lofts, a 59-unit development in Morristown, NJ: 100.0% leased – STABLE 145 Front at City Square: Phase I: 83.1% leased, Phase II: 30.5% leased (combined Phase I & II 365 units 64.7% leased) . Transaction Activity On December 31, 2018, the Company executed the first phase of its Flex Portfolio disposition, selling the Elmsford Portfolio for $70M. The remaining 4 portfolios are under negotiation, soon to go to contract and expected to close in the first half of 2019 In 4Q 2018, the Company secured favorable permanent financings on RiverHouse 11, with proceeds of $100 million at an effective rate of 4.52%, and on Portside 5/6, with proceeds of $97 million at an effective rate of 4.56% Subsequent to year-end, the Company closed on the acquisition of Prudential’s 50% ownership interest in M2, a 311-unit community in Jersey City, at a gross asset valuation of $195M. The acquisition, funded by Rockpoint capital and proceeds from the refinancing, follows the 3Q 2018 partnership acquisition of the sister Marbella property Subsequent to year-end, the Company entered into contract to acquire Soho Lofts, a 377-unit community in Jersey City, for $263.5M. The acquisition, to be funded by 1031 proceeds, represents the Company’s continued strategy of concentrating investment in our core market: the NJ Waterfront Subsequent to year-end, the Company acquired 99 Wood Ave S, a 272,000 SF class A office building in Metropark for $61.5M. Subsequent to year-end, the Company executed the disposition of Park Square, a 159-unit community in Rahway, NJ for $34.9M Monaco, Jersey City, NJ 150 JFK Pkwy, Short Hills, NJ Company Achievements
$ in thousands, except per share amounts and ratios Key Financial Metrics Core FFO pe r Di l ute d Sha re (1) Ne t I ncome pe r Di l ute d Sha re Ma rke t Va l ue of Equi ty (2) Common Equi ty (I ncl ude s OP Uni ts ) Pre fe rre d Equi ty (Rockpoi nt) OP Equi ty (Pre fe rre d OPs ) Book Va l ue of JV Mi nori ty I nte re s t Tota l De bt, Ne t Tota l Ma rke t Ca pi ta l i za ti on Shares and Units: 0.45 0.45 $2,300,227 1,969,768 278,135 52,324 42,150 2,792,651 5,135,027 0.43 (0.05) $2,445,549 2,137,674 255,551 52,324 43,243 2,807,718 5,296,510 0.45 (0.05) $2,322,868 2,039,203 231,341 52,324 20,959 2,646,436 4,990,263 0.50 0.45 $1,893,848 1,676,855 164,669 52,324 0.50 (0.01) $2,396,851 2,163,610 159,884 52,324 21,003 21,033 2,615,211 4,530,061 2,809,568 5,206,419 Common Sha re s Ou ts ta ndi ng Common Uni ts Ou ts ta ndi ng Combi ne d Sha re s a nd Uni ts We i ghte d Ave ra ge - Di l ute d (2) Com m on S ha re Pri ce ( $’s ) : 90,320,306 10,229,349 100,549,656 100,844,973 90,307,280 10,241,849 100,549,129 100,711,806 90,286,268 10,266,143 100,552,411 100,597,697 90,136,278 10,269,204 100,405,482 100,603,901 89,914,113 10,438,855 100,352,968 100,467,893 At the End of the Pe ri od Hi gh Duri ng Pe ri od Low Duri ng Pe ri od Di vi de nds De cl a re d pe r Sha re Debt Ratios: $19.59 22.26 19.02 0.20 $21.26 21.92 18.92 0.20 $20.28 20.86 16.23 0.20 $16.71 21.98 15.86 0.20 $21.56 24.04 21.18 0.20 9.3x (a) 8.7x 7.8x 13.7x 11.4x 3.1x 2.2x Ne t De bt to Ad jus te d EBI TDA Ne t De bt to Ad jus te d EBI TDA - Le s s CI P De bt Ne t De bt to Ad jus te d EBI TDA - Offi ce Portfol i o Ne t De bt to Ad jus te d EBI TDA - Re s i de nti a l Portfol i o Ne t De bt to Ad jus te d EBI TDA - Re s i de nti a l Portfol i o Le s s CI P De bt I nte re s t Cove ra ge Ra ti o Fi xe d Cha rge Cove ra ge Ra ti o 10.0x 8.9x 8.3x 15.8x 10.9x 3.3x 2.2x 9.7x 8.6x 8.1x 16.7x 10.9x 3.5x 2.3x 8.8x (3) 7.9x 7.5x 14.1x 9.8x 3.7x 2.5x 9.3x 8.6x 8.0x 17.6x 12.7x 3.3x 2.4x Tota l De bt/ Tota l Ma rke t Ca pi ta l i za ti on 54.4% 53.0% 53.0% 57.7% 56.7% Tota l De bt/ Tota l Book Ca pi ta l i za ti on 55.2% 55.6% 54.5% 54.3% 54.0% Tota l De bt/ Tota l Unde pre ci a te d As s e ts 45.3% 45.8% 44.6% 44.5% 46.5% Se cure d De bt/ Tota l Unde pre ci a te d As s e ts Notes: 23.2% 22.3% 20.6% 20.1% 23.5% (a) Net debt to EBITDA benefitted by 0.4x due to tax expense adjustments and flex sale timing. See supporting “Key Metrics” notes on page 45. Company Highlights 4Q 2018 6 4Q 20183Q 20182Q 20181Q 20184Q 2017
7 4Q 2018 Net Asset Value (Unaudited) Company Highlights $ in millions (except per share amounts) Notes: See footnotes and “Information About Net Asset Value (NAV)” on pages 9 and 10.
Net Asset Value – Residential Breakdown (Unaudited) 8 4Q 2018 Company Highlights $ in millions See footnotes and “Information About Net Asset Value (NAV)” on pages 9 and 10. Hudson River Waterfront 62.8% Boston Metro 20.5% NJ Corridor 8.7% Washington, D.C. 6.0% New York Metro 1.0% Philadelphia Metro 1.0% NAV by Market
Notes: Net Asset Value (Unaudited) 9 4Q 2018 The year one cap rate, applied to the Projected 2018 Cash NOI, is derived from the present value of periodic cash flows over five years and a terminal value based on stabilized income and a market cap rate, all discounted at an unlevered internal rate of return. See Information About Net Operating Income on page 48. The Company calculates estimated gross asset values for each of its operating office assets by taking the sum of (i) the present value of periodic cash flows over five years and (ii) a terminal value based on estimated stabilized income and a market capitalization rate at stabilization, all discounted at an unlevered internal rate of return. This value, divided by the projected net operating income for a one year period yields the year one imputed capitalization rate. Management projects the periodic cash flows over five years and the stabilized income from a combination of in-place lease contracts, prospective renewals of expiring leases and prospective lease-up of vacant space. Factors considered by management in projecting releasing and lease-up of vacant space and estimating the applicable market rental rates include: identification of leases currently being negotiated by management; historical annual leasing volumes for such property types; and comparable leases that have been executed for properties within the Company’s portfolio and for competitor buildings in similar locations. Reflects FY 2018 Cash NOI for office assets; projected 12-month NOI for stabilized residential assets and the projected stabilized NOI for residential assets in-construction and lease-up. See Information About Net Operating Income on page 48. NAV is generally arrived at by calculating the estimated gross asset values for each of the Company’s real estate properties, investments and other significant assets and interests, and then deducting from such amounts the corresponding net debt and third parties’ interests in the assets. Gross asset values for stabilized operating multi-family real estate properties are calculated using the direct capitalization method by dividing projected net operating income for the next one year period by an estimated market capitalization rate for each property. Gross asset values for operating office properties are presented by dividing projected net operating income for the next one year period by an estimated year one imputed capitalization rate for each property. See Footnote 4 for a more detailed description of the methodology used by management to estimate gross asset values for its operating office properties. Management projects net operating income that it expects to receive for future periods from a combination of in-place lease contracts, prospective renewals of expiring leases and prospective lease-up of vacant space. Market capitalization rates are estimated for each property based on its asset class and geographic location and are based on information from recent property sale transactions as well as from publicly available information regarding unrelated third party property transactions. The value range is determined by adding or subtracting 0.50% to the year 1 cap rate for office properties and 0.25% to the year 1 cap rate for residential properties. Property cash flows have been reduced by credit loss reserves, leasing and base building capital expenditures, including Harborside renovations. The Waterfront valuation includes $80 million in capital for the Harborside renovations. Additionally, the analysis includes approximately $88 million in base building capital during the first three years of the five year discounted cash flow. The capital is allocated to physical building improvements and is estimated $40 million at the Waterfront, $28 million in the Class A Suburban, and $20 million in the Suburban portfolio’s, respectively. Furthermore, the analysis includes $10 million in leasing capital budgeted in each of the Waterfront, Class A Suburban and Suburban portfolios. This is in addition to the tenant improvements, leasing commissions and capital reserves budgeted. NOI is adjusted to exclude approximately $3 million of favorable real estate tax results realized in the fourth quarter of 2018. Valuations for non-core assets, which are those assets being considered for sale or disposal, or in the active marketing process, are generally based on recent contract prices for similar properties in the process of being sold, letters of intent and ongoing negotiations for properties. Includes the Company's ownership interests in the Hyatt Regency Jersey City and three office joint venture properties. Wegman’s $31 million asset value calculated using $1.56 million projected 2018 cash NOI capped at 5%. 24 Hour Fitness $21 million asset value calculated using $1.06 million projected cash NOI capped at 5%. See Information About Net Operating Income on page 48.
10 4Q 2018 Notes: Net Asset Value (Unaudited) Company Highlights The value of land is based on a combination of recent or pending transactions for land parcels within our relevant markets and unrelated third parties, and sometimes may utilize land appraisals for certain markets, if available for other purposes, such as for transaction financing. Further, we consider what a land parcel’s value would need to be when combined with all other development costs to yield what we believe to be an appropriate target rate of return for a development project. The per apartment unit or per square foot office space values are derived by dividing the aggregate land value by the number of potential apartment units or square feet of office space the land can accommodate. The number of potential units or square feet of office space a land parcel can accommodate is most commonly governed by either in-place governmental approvals or density regulations set forth by existing zoning guidelines. Valuations for properties planned for or undergoing a repositioning or repurposing utilize a projected stabilized net operating income for the asset upon completion of the repositioning/repurposing activities. After applying an estimated capitalization rate to a projected stabilized net operating income, the capitalized value is next discounted back based on the projected number of periods to re-stabilize the asset. The discount rate applied is determined based on a risk assessment of the repositioning/repurposing activities and comparable target returns in the marketplace, and further validated by outside market sources, when available for that market. Additionally, adjustments are made to the estimated value by deducting any estimated future costs necessary to complete the planned activities, as well as adding back the discounted projected interim operating cash flows expected to be generated by the property until re-stabilization has been achieved. Joint venture investments are generally valued by: applying a capitalization rate to projected NOI for the joint venture’s asset (which is similar to the process for valuing those assets wholly owned by the Company, as described above and previously), and deducting any joint venture level debt and any value allocable to joint venture partners’ interests. Includes Roseland’s last residential subordinate interest (Metropolitan at 40 Park) and commercial subordinate interests. The valuation approach for assets in-construction or lease-up are similar to that applied to assets undergoing repositioning/repurposing, as described above. After applying an estimated capitalization rate, currently ranging from 4.5% to 5.25%, to a projected stabilized net operating income, estimated to total approximately $46.6 million upon completion of the construction or lease-up activities, the Company deducts any estimated future costs totaling $565.9 million required to complete construction of the asset to arrive at an estimated value attributable to the asset. The Company then discounts the capitalized value back based on the projected number of periods to reach stabilization. The discount rate applied, currently ranging from 7% to 9.75%, is determined based on a risk assessment of the development activities and comparable target returns in the marketplace. The Company then adds back the discounted projected interim cash flows expected to be generated during the projected lease-up period to reach stabilization. Represents the discount to stabilized value applied to assets that have not yet achieved their respective Projected Stabilized NOI due to construction, lease-up or renovation. See Information About Net Operating Income on page 48. The residential valuation analysis totals to a Roseland NAV of $1,754,000,000 and additional Mack-Cali residential holdings of $106,000,000 or an aggregate $1,860,000,000, with the company’s share of this NAV of $1,582,000,000 (“MCRC Share”). This latter amount represents the company's share of Roseland NAV, net of the $278,000,000 attributable to Rockpoint's noncontrolling interest. The decrease in the approximate NAV per share of $0.33 from September 30, 2018 to December 31, 2018 is due primarily to reprojection of income at select operating and in-construction properties, including the Hyatt Regency Jersey City, Marriott Hotels at Port Imperial and Wegman’s. Overall, NAV is arrived at by calculating the estimated gross asset values for each of their real estate properties, investments and other significant assets and interests, and then deducting from such amounts the corresponding net debt and third parties’ interests in the assets. Gross asset values for the operating real estate properties are calculated using the direct capitalization method by dividing projected net operating income for a one year period by an estimated current capitalization rate for each property. For each operating property, management projects net operating income that it expects to receive for future periods from a combination of in-place lease contracts, prospective renewals of expiring leases and prospective lease-up of vacant space. Factors considered by management in projecting releasing and lease-up of vacant space and estimating the applicable market rental rates include: identification of leases currently being negotiated by management; historical annual leasing volumes for such property types; and comparable leases that have been executed for properties within the Registrants’ portfolio and for competitor buildings in similar locations. A capitalization rate is estimated for each property based on its asset class and geographic location. Estimates of capitalization rates are based on information from recent property sale transactions as well as from publicly available information regarding unrelated third party property transactions. The use of NAV as a measure of value is subject to certain inherent limitations. The assessment of the estimated NAV of a particular property is subjective in that it involves estimates and assumptions and can be calculated using various acceptable methods. The Company’s methods of determining NAV may differ from the methods used by other companies. Accordingly, the Company’s estimated NAV may not be comparable to measures used by other companies. As with any valuation methodology, the methodologies utilized by the Company in estimating NAV are based upon a number of estimates, assumptions, judgments or opinions that may or may not prove to be correct. Capitalization rates obtained from publicly available sources also are critical to the NAV calculation and are subject to the sources selected and variability of market conditions at the time. Investors in the Company are cautioned that NAV does not represent (i) the amount at which the Company’s securities would trade at a national securities exchange, (ii) the amount that a security holder would obtain if he or she tried to sell his or her securities, (iii) the amount that a security holder would receive if the Company liquidated its assets and distributed the proceeds after paying all of their expenses and liabilities or (iv) the book value of the Company’s real estate, which is generally based on the amortized cost of the property, subject to certain adjustments. Information About Net Asset Value (NAV)
11 4Q 2018 Balance Sheet Company Highlights $ in thousands (unaudited) Notes: See supporting “Balance Sheet” notes on page 45 for more information.
12 4Q 2018 Income Statement – Quarterly Comparison Company Highlights $ in thousands, except per share amounts (unaudited)
FFO, Core FFO & AFFO – Quarterly Comparison 13 4Q 2018 Company Highlights $ in thousands, except per share amounts and ratios (unaudited) Notes: (a) Net debt to EBITDA benefitted by 0.4x due to tax expense adjustments and flex sale timing. See footnotes and “Information About FFO, Core FFO, & AFFO” on page 17.
EBITDAre – Quarterly Comparison 14 4Q 2018 Company Highlights $ in thousands (unaudited) Notes: See unconsolidated joint venture NOI details on page 22 for 4Q 2018. See Information About EBITDAre on page 17.
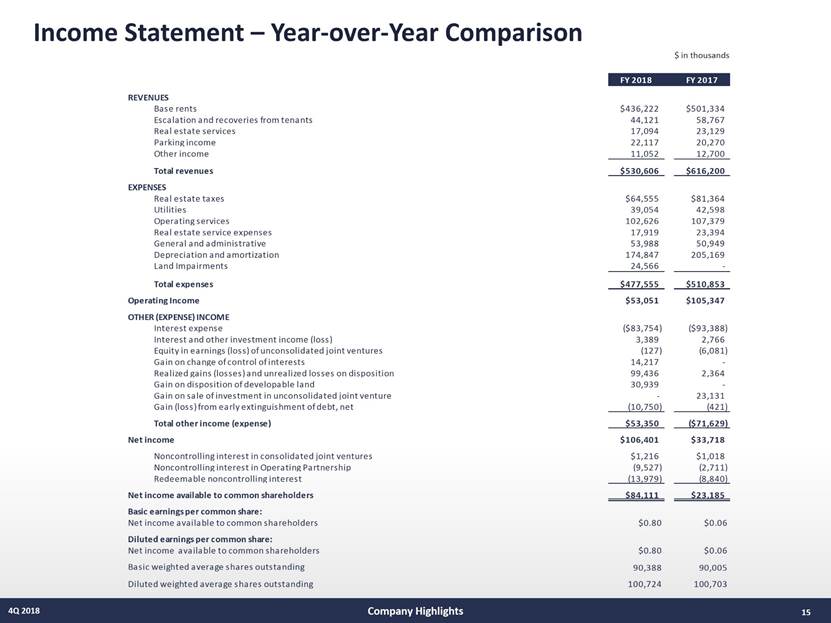
15 4Q 2018 Income Statement – Year-over-Year Comparison Company Highlights $ in thousands
FFO, Core FFO & AFFO – Year-over-Year Comparison 16 4Q 2018 Company Highlights $ in thousands except per share amounts and ratios (unaudited) Notes: (a) Net debt to EBITDA benefitted by 0.1x due to tax expense adjustments and flex sale timing. See footnotes and “Information About FFO, Core FFO, & AFFO” on page 17.
FFO, Core FFO & AFFO (Notes) 17 4Q 2018 Company Highlights Notes Includes the Company’s share from unconsolidated joint ventures, and adjustments for noncontrolling interest, of $3,810 and $4,729 for the three months ended December 31, 2018 and 2017, respectively, and $17,683 and $20,336 for the year ended December 31, 2018 and 2017, respectively. Excludes non-real estate-related depreciation and amortization of $557 and $511 for the three months ended December 31, 2018 and 2017, respectively, and $2,139 and $1,742 for the year ended December 31, 2018 and 2017, respectively. Funds from operations is calculated in accordance with the definition of FFO of the National Association of Real Estate Investment Trusts (NAREIT). See “Information About FFO, Core FFO and AFFO” below. Includes free rent of $4,428 and $7,527 for the three months ended December 31, 2018 and 2017, respectively, and $16,545 and $29,401 for the year ended December 31, 2018 and 2017, respectively. Also includes the Company's share from unconsolidated joint ventures of ($165) and $267 for the three months ended December 31, 2018 and 2017, respectively, and ($955) and $1,235 for the year ended December 31, 2018 and 2017, respectively. Includes the Company's share from unconsolidated joint ventures of $0 and $80 for the three months ended December 31, 2018 and 2017, respectively, and $107 and $336 for the year ended December 31, 2018 and 2017, respectively. Excludes expenditures for tenant spaces in properties that have not been owned by the Company for at least a year. 1Q 2018 and YTD 2018 Includes $2.6 million of the Company’s share of its first annual sale of an economic tax credit certificate associated with the Urby Harborside joint venture from the State of New Jersey to a third party. Net Debt calculated by taking the sum of senior unsecured notes, unsecured revolving credit facility, and mortgages, loans payable and other obligations, and deducting cash and cash equivalents, all at period end. Calculated based on weighted average common shares outstanding, assuming redemption of Operating Partnership common units into common shares (10,176 and 10,439 shares for the three months ended December 31, 2018 and 2017, respectively, and 10,204 and 10,405 shares for the year ended December 31, 2018 and 2017, respectively). Equals Net Debt at period end divided by Adjusted EBITDA (for quarter periods, Adjusted EBITDA annualized multiplying quarter amounts by 4). Without annualizing the proceeds from the Urby Harborside tax credit, the 1Q 2018 net debt to EBITDA ratio is 9.0x. Net income available to common shareholders in 2018 included $24.6 million of land impairment charges and $30.9 million from a gain on sale of developable land, which are included in the calculation to arrive at funds from operations as such gains and charges relate to non-depreciable assets. Funds from operations (“FFO”) is defined as net income (loss) before noncontrolling interests of unitholders, computed in accordance with generally accepted accounting principles (“GAAP”), excluding gains or losses from depreciable rental property transactions (including both acquisitions and dispositions), and impairments related to depreciable rental property, plus real estate-related depreciation and amortization. The Company believes that FFO per share is helpful to investors as one of several measures of the performance of an equity REIT. The Company further believes that as FFO per share excludes the effect of depreciation, gains (or losses) from property transactions and impairments related to depreciable rental property (all of which are based on historical costs which may be of limited relevance in evaluating current performance), FFO per share can facilitate comparison of operating performance between equity REITs. FFO per share should not be considered as an alternative to net income available to common shareholders per share as an indication of the Company’s performance or to cash flows as a measure of liquidity. FFO per share presented herein is not necessarily comparable to FFO per share presented by other real estate companies due to the fact that not all real estate companies use the same definition. However, the Company’s FFO per share is comparable to the FFO per share of real estate companies that use the current definition of the National Association of Real Estate Investment Trusts (“NAREIT”). A reconciliation of net income per share to FFO per share is included in the financial tables above. Core FFO is defined as FFO, as adjusted for items that may distort the comparative measurement of the Company’s performance over time. Adjusted FFO ("AFFO") is defined as Core FFO less (i) recurring tenant improvements, leasing commissions and capital expenditures, (ii) straight-line rents and amortization of acquired below-market leases, net, and (iii) other non-cash income, plus (iv) other non-cash charges. Core FFO and AFFO are both non-GAAP financial measures that are not intended to represent cash flow and are not indicative of cash flows provided by operating activities as determined in accordance with GAAP. Core FFO and AFFO are presented solely as supplemental disclosures that the Company’s management believes provides useful information regarding the Company's operating performance and its ability to fund its dividends. There are not generally accepted definitions established for Core FFO or AFFO. Therefore, the Company's measures of Core FFO and AFFO may not be comparable to the Core FFO and AFFO reported by other REITs. A reconciliation of net income to Core FFO and AFFO are included in the financial tables above. Information About FFO, Core FFO and AFFO EBITDAre is a non-GAAP financial measure. The Company computes EBITDAre in accordance with standards established by the National Association of Real Estate Investment Trusts, or NAREIT, which may not be comparable to EBITDAre reported by other REITs that do not compute EBITDAre in accordance with the NAREIT definition, or that interpret the NAREIT definition differently than the Company does. The White Paper on EBITDAre approved by the Board of Governors of NAREIT in September 2017 defines EBITDAre as net income (loss) (computed in accordance with Generally Accepted Accounting Principles, or GAAP), plus interest expense, plus income tax expense, plus depreciation and amortization, plus (minus) losses and gains on the disposition of depreciated property, plus impairment write-downs of depreciated property and investments in unconsolidated joint ventures, plus adjustments to reflect the entity's share of EBITDAre of unconsolidated joint ventures. The Company presents EBITDAre, because the Company believes that EBITDAre, along with cash flow from operating activities, investing activities and financing activities, provides investors with an additional indicator of the Company’s ability to incur and service debt. EBITDAre should not be considered as an alternative to net income (determined in accordance with GAAP), as an indication of the Company’s financial performance, as an alternative to net cash flows from operating activities (determined in accordance with GAAP), or as a measure of the Company’s liquidity. Information About EBITDAre
Same Store Performance 18 4Q 2018 Company Highlights $ in thousands Notes: (a) The aggregate sum of: property-level revenue, straight-line and ASC 805 adjustments over the given time period; less: operating expense, real estate taxes and utilities over the same period for the same store portfolio. (b) Aggregate property-level revenue over the given period; less: operating expense, real estate taxes and utilities over the same period for the same store portfolio. (1) Values represent the Company’s pro rata ownership of operating portfolio.
19 4Q 2018 Debt Summary & Maturity Schedule Company Highlights $ in thousands Notes: See supporting “Debt Summary & Maturity Schedule” notes on page 45.
20 4Q 2018 Debt Profile Company Highlights Notes: See supporting “Debt Profile” notes on page 45. $ in thousands
21 4Q 2018 2019/2020 Debt Maturities Company Highlights $ in thousands Notes: See supporting “2019/2020 Debt Maturities” notes on page 45.
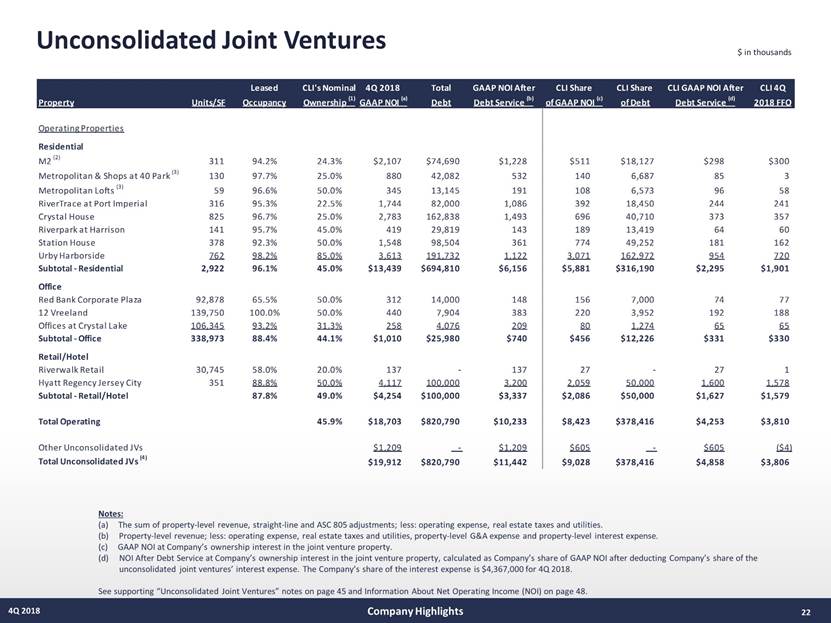
Unconsolidated Joint Ventures 22 4Q 2018 Company Highlights $ in thousands Notes: (a) The sum of property-level revenue, straight-line and ASC 805 adjustments; less: operating expense, real estate taxes and utilities. (b) Property-level revenue; less: operating expense, real estate taxes and utilities, property-level G&A expense and property-level interest expense. (c) GAAP NOI at Company’s ownership interest in the joint venture property. NOI After Debt Service at Company’s ownership interest in the joint venture property, calculated as Company’s share of GAAP NOI after deducting Company’s share of the unconsolidated joint ventures’ interest expense. The Company’s share of the interest expense is $4,178,000 for 4Q 2018. See supporting “Unconsolidated Joint Ventures” notes on page 45 and Information About Net Operating Income (NOI) on page 48.
Transaction Activity 23 Company Highlights 4Q 2018 $ in thousands (incl. per unit values) except per SF Notes: Represents 100% of asset value. The Company purchased its partner’s 50% interest at Marbella for $37.4 million net of refinancing proceeds. The Company purchased its partner’s 12.5% interest in Metropolitan and Shops at 40 Park, as well as its partner’s 25% interest in Metropolitan Lofts for a combined $2.6 million. See supporting “Transaction Activity” notes on page 45.
Guidance Rollforward 24 Company Highlights 4Q 2018
Guidance Assumptions 25 Company Highlights 4Q 2018 $ in millions (incl. per unit values) except per SF
Office Portfolio 4Q 2018

Property Listing 27 4Q 2018 Office Portfolio Notes: See supporting “Property Listing” notes on page 46.
2019 Expirations by Building 28 Asking rents on vacant space are on average 3.5% higher than expiring rents 4Q 2018 Office Portfolio Notes: Subsequent to year-end, the company executed the disposition of 2115 Linwood Avenue for $16 million.
Leasing Activity 29 4Q 2018 Office Portfolio Notes: Percentage leased values reflect both Plymouth Rock Management Co.’s recently executed lease at 581 Main Street as well as its lease at 1 River Center 3, of which 29,540 sf is expiring 2/10/19. Suburban percentage leased excluding the 29,540 sf leased to Plymouth Rock would be 81.8%. Inclusive of escalations.
30 4Q 2018 Office Portfolio Leasing Rollforwards
31 4Q 2018 Top 15 Tenants Office Portfolio Notes: See supporting “Top 15 Tenants” notes on page 46.
32 4Q 2018 Office Portfolio Lease Expirations Notes: See supporting “Expirations” notes on page 46.
33 4Q 2018 Office Portfolio Lease Expirations (Cont.) Notes: See supporting “Expirations” notes on page 46.
Roseland Residential Portfolio 4Q 2018

Adam Freindlich! Roseland (RRT) manages a dynamic portfolio of operating and under construction assets, with an enviable land pipeline primarily in high barrier to entry, transit oriented locations. We are a premier owner and developer of residential real estate on the New Jersey waterfront with direct access to Hudson Yards and Brookfield Place Platform Poised for Sustained Growth: 4Q 2018 NAV was approximately $1.86B, comprised of $278M of Rockpoint equity and $1.58B of MC equity ($15.69/MC share) In December 2018, the Residence Inn at Port Imperial, a 164-key limited service Marriott hotel in Weehawken, NJ, commenced operations. The hotel is the first phase of a 372-key, dual-flag development, with its sister property, the Marriott Envue, projected to open in June 2019. Commenced construction on 233 Canoe Brook, a 200-unit community directly adjacent to the Short Hills Mall and the second success from the Company’s suburban office repurposing efforts Subsequent to year-end, commenced construction on 25 Christopher Columbus, a 750-unit premier residential tower in downtown Jersey City Lease-Up Communities 2018: achieved stabilization at RiverHouse 11 (295 units), Signature Place (197 units) Metropolitan Lofts (59 units) and Portside 5/6 at East Pier (296 units), as well as continued momentum at 145 Front Phase I & II (237 units & 128 units respectively) As of February 18, our lease-up portfolio—solely from 2018 deliveries of 1,212 units—was 87.3% leased As of December 31, 2018, Rockpoint had an additional $45M capital commitment to Roseland Subsequent to year-end, the Company closed on the acquisition of Prudential’s 50% ownership interest in M2, a 311-unit community in Jersey City, at a gross asset valuation of $195M. The acquisition, funded by Rockpoint capital and proceeds from the refinancing, follows the 3Q 2018 partnership acquisition of the sister Marbella property Subsequent to year-end, the Company entered into contract to acquire Soho Lofts, a 377-unit community in Jersey City, for $263.5M. The acquisition, to be funded by 1031 proceeds, represents our continued strategy of concentrating investment in our core market: the NJ Waterfront Subsequent to year-end, the Company executed the disposition of Park Square, a 159-unit community in Rahway, NJ for $34.9M Pipeline of 9,890 units of strategically located land holdings includes 6,284 units along the NJ Waterfront—nearly all with zoning in place We forecast continued growth in residential NOI after debt service from completion of our 2,321 unit/key in-construction portfolio coupled with stabilization of our lease-up portfolio 35 4Q 2018 Roseland Highlights Roseland Residential 4Q 2018 YE 2019 YE 2020 Operating & Construction Apts. (projected) 8,609 9,051 10,480 Future Development Apts. 9,890 9,666 8,237 % Growth in Operating & Construction Units - 5.1% 15.8%
2015/2016 Achievements - Development Development Activity and Cash Flow Growth 4Q 2018 Roseland Residential Notes: The Residence Inn (164 keys) opened in 4Q 2018. The Marriott Envue (208 keys) is projected to open in June 2019 Projected stabilized yield on in-construction portfolio without the Marriott Hotels at Port Imperial is 6.08 percent. NOI amounts are projected only. See Information About Net Operating Income (NOI) on page 48. $ in millions (unaudited) 36
Roseland Balance Sheet 37 4Q 2018 Roseland Residential $ in thousands (unaudited)
Roseland Income Statement 38 4Q 2018 Roseland Residential $ in thousands (unaudited)
Jersey City Residential Calculator 39 Notes: Reflects 2018 tax rates for single filers. Jersey City is a compelling financial alternative to Manhattan, providing significant income advantages after taxes and rent. 4Q 2018 Roseland Residential
$ in thousands, except per home Operating & Lease-Up Communities 40 4Q 2018 Roseland Residential Notes: See Information About Net Operating Income on page 48. See supporting “Operating & Lease-Up Communities” notes on page 46. (2) Marbella FY 2018 NOI composed of $5,801 UJV NOI from January 1, 2018 to August 2, 2018 ($2,569 1Q 2018, $2,412 2Q 2018, $820 3Q 2018) and $4,205 of . consolidated NOI from August 2, 2018 to December 31, 2018 ($1,735 3Q 2018, $2,470 4Q 2018). 4Q 2018 Percentage Leased (Stabilized): 95.9% 4Q 2018 Avg. Revenue Per Home (Stabilized): $2,673
Operating Communities - Commercial 4Q 2018 41 Roseland Residential Notes: See Information About Net Operating Income on page 48. (1) Marbella FY 2018 NOI composed of $5,801 UJV NOI from January 1, 2018 to August 2, 2018 ($2,569 1Q 2018, $2,412 2Q 2018, $820 3Q 2018) and $4,205 of . consolidated NOI from August 2, 2018 to December 31, 2018 ($1,735 3Q 2018, $2,470 4Q 2018). $ in thousands
In-Construction Communities 42 4Q 2018 Roseland Residential RRT’s share of projected stabilized NOI after debt service will approximate $36.0 million (approximates to FFO) $ in thousands Notes: NOI amounts are projected only. See Information About Net Operating Income (NOI) on page 48. See supporting “In-Construction Communities” notes on page 46.
Future Developments Location Apartment PI South - Building 16 Weehawken, NJ 131 PI South - Office 1/3 (1) Weehawken, NJ - Urby Harborside III Jersey City, NJ 750 Plaza 9 Jersey City, NJ 1,060 Liberty Landing Phase I Jersey City, NJ 265 Liberty Landing - Future Phases Jersey City, NJ 585 PI South - Building 2 Weehawken, NJ 200 PI North - Riverbend 6 West New York, NJ 471 PI North - Building I West New York, NJ 224 PI North - Building J West New York, NJ 141 Subtotal - Hudson River Waterfront 3,827 Acquisition Options (2) Freehold Freehold, NJ 400 107 Morgan Jersey City, NJ 804 Subtotal - Acquisition Options 1,204 2019/2020 Priority Starts 1,653 2019/2020 Possible Starts 540 Total Future Start Communities 9,890 As of December 31, 2018, the Company has a future development portfolio of 9,890 residential units All priority starts (1,653 units) are located on the New Jersey Waterfront Future Start Communities 43 4Q 2018 Roseland Residential Future Developments Location Apartment 1 Water Street White Plains, NY 300 6 Becker Farm Roseland, NJ 299 1633 Littleton (repurposing) Parsippany, NJ 345 65 Livingston Roseland, NJ 140 Subtotal - Northeast Corridor 1,084 Overlook IIIA Malden, MA 215 Overlook IV/V Malden, MA 299 Subtotal - Boston Metro 514 Crystal House - III Arlington, VA 252 Crystal House - Future Arlington, VA 300 Subtotal - Washington, DC 552 Notes: See supporting “Future Start Communities” notes on page 46. Current 2019/2020 Priority Starts Location Apartments Ownership Target Start PI South - Park Parcel Weehawken, NJ 224 100.00% 2019 Plaza 8 Jersey City, NJ 679 100.00% 2020 Urby Harborside II Jersey City, NJ 750 85.00% 2020 2018/2019 Total Priority Starts 1,653 93.19% 2019/2020 Possible Starts Portside 1-4 East Boston, MA 300 100.00% 233 Canoe Brook Road - Hotel Short Hills, NJ 240 100.00% 2019/2020 Total Possible Starts 540 100.00% 51 Washington Street Conshohoken, PA 310 150 Monument Road Bala Cynwyd, PA 206 Subtotal - Philadelphia 516
Residential Equity Requirements 4Q 2018 Roseland Residential As summarized in the table below, Mack-Cali is planning on and expects to have excess capital source availability to achieve the following development objectives: i. Complete Roseland’s in-construction portfolio of 2,321 units/keys ii. Complete Roseland’s funding requirement for 2019/2020 Priority Starts comprising 1,653 units Notes: (1) Represents capital sources prior to reinvestment of Roseland cash flow generation and 1031 proceeds. $ in thousands Total Cost Construction Capital Units Remaining Debt Requirement USE: In Construction Portfolio (Remaining Capital) Comment In Construction Portfolio Represents remaining requirements for the in construction portfolio summarized on Page 42 2,321 $819,675 $650,650 $169,025 Less: Existing JV Partner Commitments Represents third party capital commitments (Riverwalk C) (3,742) Roseland Capital Requirement - Remaining $165,283 (A) USE: Priority Starts Priority Starts Represents three priority 2019 and 2020 starts in our core geographies 1,653 $893,540 $580,801 $312,739 Less: Land Equity/Fundings to Date Represents the Company's existing land equity in Probable Starts ($59,785/unit) (98,825) Less: Existing JV Partner Commitments Represents third party capital commitments (Urby Harborside II) (28,875) Roseland Capital Obligation $185,039 (B) Total Roseland Capital Uses 3,974 $350,322 (A+B) SOURCE: Capital Availability Comment Rockpoint Capital Represents the balance on Rockpoint's $300M commitment $45,000 Refinancings Represents excess refinancing proceeds upon takeout financing on construction portfolio 100,000 Dispositions Represents select dispositions for redeployment of capital into Roseland's core geographies 160,000 New Project-level Joint Ventures Represents 50/50 joint venture on select Priority Start 125,000 Total Roseland Capital Sources $430,000 Excess Capital Source Potential (1) $79,678
Appendix Key Financial Metrics - (Page 6) Funds from operations (“FFO”) is calculated in accordance with the definition of the National Association of Real Estate Investment Trusts (NAREIT). See p.17 “Information About FFO, Core FFO & AFFO”. Includes any outstanding preferred units presented on a converted basis into common units, non-controlling interests in consolidated joint ventures and redeemable non-controlling interests. Without annualizing the proceeds from the Urby Harborside tax credit, the net debt to EBITDA ratio was 9.0x. Balance Sheet - (Page 11) Includes land held for future development of $180,479 for Office/Corp. and $285,451 for Roseland as of 4Q 2018. Includes mark-to-market lease intangible net assets of $92,805 and mark-to-market lease intangible net liabilities of $42,166 as of 4Q 2018. Debt Summary & Maturity Schedule - (Page 19) 2016 term loan, maturing on January 7, 2019, has three year term with two 1-year extension options available. The Company executed its first extension option on January 7,2019. 2017 term loan, maturing on January 25, 2020, has three year term with two 1-year extension options available. The actual weighted average LIBOR rate for the Company’s outstanding variable rate debt was 2.45 percent as of December 31, 2018, plus the applicable spread. Excludes amortized deferred financing costs primarily pertaining to the Company’s unsecured revolving credit facility which amounted to $830 thousand for the three months ended December 31, 2018. Minority interest share of consolidated debt is approximately $32.8 million Debt Profile - (Page 20) Effective rate of debt, including deferred financing costs, comprised of the cost of terminated treasury lock agreements (if any), debt initiation costs, mark-to-market adjustment of acquired debt and other transaction costs, as applicable. Senior unsecured debt is rated BB+/Ba1/BB+ by S&P, Moody’s and Fitch respectively. Cost of terminated treasury lock agreements (if any), offering and other transaction costs and the discount/premium on the notes, as applicable. Subsequent to year-end, executed first of two 1-year extension options on 2016 term loan, now maturing on January 7, 2020. The Company has an additional 1-year extension option available. 2017 term loan, maturing on January 25, 2020, has three year term with two 1-year extension options available. 2019/2020 Debt Maturities - (Page 21) Construction loan LTVs are calculated using the respective maximum loan balance. Subsequent to year-end, the Company executed the disposition of Park Square Subsequent to year-end, the Company executed the partnership acquisition of M2, financed in part by a $117 million mortgage. Subsequent to year-end, executed first of two 1-year extension options. Unconsolidated Joint Ventures - (Page 22) Amounts represent the Company’s share based on ownership percentage. Subsequent to year-end, the Company acquired Prudential’s 50% ownership interest in M2, consolidating the asset on the Company’s balance sheet. On December 11, 2018, the Company acquired its partner’s interest in Metropolitan, Shops at 40 Park and Metropolitan Lofts, increasing its ownership from 12.5% to 25% in Metropolitan and Shops at 40 Park and from 25% to 50% ownership in Metropolitan Lofts. Unconsolidated Joint Venture reconciliation is as follows: Transaction Activity - (Page 23) Acquisitions list gross costs; dispositions list gross sales proceeds. The Company purchased its partner’s 50% interest at Marbella for $37.4 million net of refinancing proceeds. The Company purchased its partner’s 12.5% interest in Metropolitan and Shops at 40 Park, as well as its partner’s 25% interest in Metropolitan Lofts for a combined $2.6 million. Weighted average cap rate calculated using forward 12-month NOI at period of sale. Price Per SF calculation includes 1-11 Martine, a 82,000 SF condo space that did not generate income since its acquisition in 2Q 2016. Weighted average cap rate excludes One Lake Street. Partnership acquisition at Metropolitan (130 units, 12.5% interest acquisition), Shops at 40 Park (50,973 SF retail, 12.5% interest acquisition) and Metropolitan Lofts (59 units, 25% interest acquisition). 45 4Q 2018 4Q 2018 Equity in Earnings of Unconsolidated Joint Ventures $960 Unconsolidated Joint Venture Funds from Operations 3,806 Joint Venture Share of Add-Back of Real Estate-Related Depreciation 4,766 Minority Interest in Consolidated Joint Venture Share of Depreciation (956) EBITDA Depreciation Add-Back $3,810 $ in thousands
Appendix - Continued Property Listing - (Page 27) Includes annualized base rental revenue plus escalations for square footage leased to commercial and retail tenants only. Excludes leases for amenity, parking and month-to-month tenants. Annualized base rental revenue plus escalations is based on actual December 2018 billings times 12. For leases whose rent commences after January 1, 2019 annualized base rental revenue is based on the first full month’s billing times 12. As annualized base rental revenue is not derived from historical GAAP results, historical results may differ from those set forth above. Subsequent to year-end, the company executed the disposition of 2115 Linwood Avenue for $16 million. Average base rents + escalations reflect rental values on a triple net basis. Excludes non-core holdings targeted for sale at 708,786 SF; excludes consolidated repositionings taken offline totaling 465,860 SF. Total consolidated office portfolio of 15,284,749 SF. Top 15 Tenants - (Page 31) Annualized base rental revenue is based on actual December 2018 billings times 12. For leases whose rent commences after January 1, 2019, annualized base rental revenue is based on the first full month’s billing times 12. As annualized base rental revenue is not derived from historical GAAP results, historical results may differ from those set forth above. Represents the percentage of space leased and annual base rental revenue to commercial tenants only. 45,256 square feet expire in 2019; 237,350 square feet expire in 2029. 9,356 square feet expire in 2019; 33,363 square feet expire in 2021; 388,207 square feet expire in 2027. 650 square feet expire in 2019; 295,922 square feet expire in 2032. 66,606 square feet expire in 2024; 54,341 square feet expire in 2026. 29,540 square feet expire in 2019; 129,786 square feet expire in 2031. 17,855 square feet expire in 2021; 38,930 square feet expire in 2023; 59,853 square feet expire in 2024; 20,395 square feet expire in 2026; 15,408 square feet expire in 2027. 82,936 square feet expire in 2026; 56,360 square feet expire in 2030. Expirations - (Pages 32-33) Includes office, office/flex, industrial/warehouse & standalone retail property tenants only. Excludes leases for amenity, retail, parking & month-to-month tenants. Some tenants have multiple leases. Reconciliation to Company’s total net rentable square footage is as follows: Annualized base rental revenue is based on actual December 2018 billings times 12. For leases whose rent commences after January 1, 2019 annualized base rental revenue is based on the first full month’s billing times 12. As annualized base rental revenue is not derived from historical GAAP results, historical results may differ from those set forth above. Includes leases in effect as of the period end date, some of which have commencement dates in the future, and leases expiring December 31, 2018 aggregating 10,108 square feet and representing annualized base rent of $375,809 for which no new leases were signed. Operating & Lease-up Communities - (Page 40) 1Q 2018 NOI affected favorably by one-time tax settlement of $405 thousand. Excluding the settlement, 1Q 2018 NOI would have been $429 thousand. Marbella FY 2018 NOI composed of $5,801 UJV NOI from January 1, 2018 to August 2, 2018 ($2,569 1Q 2018, $2,412 2Q 2018, $820 3Q 2018) and $4,205 of consolidated NOI from August 2, 2018 to December 31, 2018 ($1,735 3Q 2018, $2,470 4Q 2018). RiverHouse 11 3Q 2018 NOI of $195,000 was accounted for in NOI (loss) from services, land/development/repurposing & other assets. Unconsolidated joint venture income represented at 100% venture NOI. See Information on Net Operating Income (NOI) on page 46. Subsequent to year-end on January 31, 2019, the Company acquired Prudential’s 50% partnership interest in M2, increasing the Company’s legal ownership in the property from 24.265% to 74.265%. Excludes proceeds from the $2.6 million dollar tax credit in 1Q 2018. As of December 31, 2018 Priority Capital included Metropolitan at $20,914,422 (Prudential). For 145 Front at City Square Phases I & II, average revenue per home calculations, NOI and debt balance shown as consolidated. Excludes approximately 83,083 SF of ground floor retail. In-Construction Communities - (Page 42) Represents maximum loan proceeds. Represents development costs funded with debt or capital as of December 31, 2018. Sitework commenced 4Q 2018, though official commencement 1Q 2019. The maximum loan balance presented is the anticipated debt and as no formal agreement has been signed, which may be subject to change. Projected stabilized yield without the Marriott Hotels at Port Imperial is 6.08 percent. Future Start Communities - (Page 43) Currently approved for approximately 290,000 square feet of office space. Freehold: Roseland has signed an acquisition agreement, subject to certain conditions. 107 Morgan: Mack-Cali has a note encumbering the property. 46 4Q 2018 Square Feet Square footage leased to commercial tenants 11,750,750 Square footage used for corporate offices, management offices, building use, retail tenants, food services, other ancillary service tenants and occupancy adjustments 350,470 Square footage unleased 2,717,669 Total net rentable square footage (excluding ground leases) 14,818,889
Global Definitions 47 Average Revenue Per Home: Calculated as total apartment revenue for the quarter ended September 30, divided by the average percent occupied for the quarter ended September 30, 2018, divided by the number of apartments and divided by three. Operating Communities: Communities that have achieved Project Stabilization. Consolidated Operating Communities: Wholly owned communities and communities whereby the Company has a controlling interest. Predevelopment Communities: Communities where the Company has commenced predevelopment activities that have a near-term projected project start. Class A Suburban: Long-term hold office properties in targeted submarkets; formerly defined as Urban Core. Project Completion: As evidenced by a certificate of completion by a certified architect or issuance of a final or temporary certificate of occupancy. Flex Parks: Primarily office/flex properties, including any office buildings located within the respective park. Project Stabilization: Lease-Up communities that have achieved over 95 Percentage Leased for six consecutive weeks. Future Development: Represents land inventory currently owned or controlled by the Company. Projected Stabilized Yield: Represents Projected Stabilized Residential NOI divided by Total Costs. See following page for “Projected Stabilized Residential NOI” definition. Identified Repurposing Communities: Communities not currently owned by RRT, which have been identified for transfer from Mack-Cali to RRT for residential repurposing. Repurposing Communities: Commercial holdings of the Company which have been targeted for rezoning from their existing office to new multi-family use and have a likelihood of achieving desired rezoning and project approvals. In-Construction Communities: Communities that are under construction and have not yet commenced initial leasing activities. Subordinated Joint Ventures: Joint Venture communities where the Company's ownership distributions are subordinate to payment of priority capital preferred returns. Lease-Up Communities: Communities that have commenced initial operations but have not yet achieved Project Stabilization. Suburban: Long-term hold office properties (excluding Class A Suburban and Waterfront locations); formerly defined as Suburban Core MCRC Capital: Represents cash equity that the Company has contributed or has a future obligation to contribute to a project. Third Party Capital: Capital invested by third parties and not Mack-Cali. Net Asset Value (NAV): The metric represents the net projected value of the Company’s interest after accounting for all priority debt and equity payments. The metric includes capital invested by the Company. Total Costs: Represents full project budget, including land and developer fees, and interest expense through Project Completion. Non-Core: Properties designated for eventual sale/disposition or repositioning/redevelopment. Waterfront: Office assets located on NJ Hudson River waterfront. 4Q 2018
Information About Net Operating Income (NOI) 48 4Q 2018 NOI represents total revenues less total operating expenses, as reconciled to net income above. The Company considers NOI to be a meaningful non-GAAP financial measure for making decisions and assessing unlevered performance of its property types and markets, as it relates to total return on assets, as opposed to levered return on equity. As properties are considered for sale and acquisition based on NOI estimates and projections, the Company utilizes this measure to make investment decisions, as well as compare the performance of its assets to those of its peers. NOI should not be considered a substitute for net income, and the Company’s use of NOI may not be comparable to similarly titled measures used by other companies. The Company calculates NOI before any allocations to noncontrolling interests, as those interests do not effect the overall performance of the individuals assets being measured and assessed. Definition of: Net Operating Income (NOI) Reconciliation of Net Income to Net Operating Income (NOI) $ in thousands (unaudited) Notes: (1) Adjustment reflects non-real estate overhead general and administrative expense.
49 4Q 2018 Company Information, Executive Officers & Analysts

DISCLOSURE REGARDING FORWARD-LOOKING STATEMENTS The Company considers portions of this information, including the documents incorporated by reference, to be forward-looking statements within the meaning of Section 21E of the Securities Exchange Act of 1934, as amended. The Company intends such forward-looking statements to be covered by the safe harbor provisions for forward-looking statements contained in Section 21E of such act. Such forward-looking statements relate to, without limitation, our future economic performance, plans and objectives for future operations and projections of revenue and other financial items. Forward-looking statements can be identified by the use of words such as “may,” “will,” “plan,” “potential,” “projected,” “should,” “expect,” “anticipate,” “estimate,” “target”, “continue” or comparable terminology. Forward-looking statements are inherently subject to certain risks, trends and uncertainties, many of which we cannot predict with accuracy and some of which we might not even anticipate. Although the Company believes that the expectations reflected in such forward-looking statements are based upon reasonable assumptions at the time made, the Company can give no assurance that such expectations will be achieved. Future events and actual results, financial and otherwise, may differ materially from the results discussed in the forward-looking statements. Readers are cautioned not to place undue reliance on these forward-looking statements. Among the factors about which the Company has made assumptions are: -risks and uncertainties affecting the general economic climate and conditions, which in turn may have a negative effect on the fundamentals of the Company’s business and the financial condition of the Company’s tenants and residents; -the value of the Company’s real estate assets, which may limit the Company’s ability to dispose of assets at attractive prices or obtain or maintain debt financing secured by our properties or on an unsecured basis; -the extent of any tenant bankruptcies or of any early lease terminations; -The Company’s ability to lease or re-lease space at current or anticipated rents; -changes in the supply of and demand for the Company’s properties; -changes in interest rate levels and volatility in the securities markets; -The Company’s ability to complete construction and development activities on time and within budget, including without limitation obtaining regulatory permits and the availability and cost of materials, labor and equipment; -forward-looking financial and operational information, including information relating to future development projects, potential acquisitions or dispositions, leasing activities, capitalization rates and projected revenue and income; -changes in operating costs; -The Company’s ability to obtain adequate insurance, including coverage for terrorist acts; -The Company’s credit worthiness and the availability of financing on attractive terms or at all, which may adversely impact our ability to pursue acquisition and development opportunities and refinance existing debt and the Company’s future interest expense; -changes in governmental regulation, tax rates and similar matters; and -other risks associated with the development and acquisition of properties, including risks that the development may not be completed on schedule, that the tenants or residents will not take occupancy or pay rent, or that development or operating costs may be greater than anticipated. For further information on factors which could impact us and the statements contained herein, see Item 1A: Risk Factors in MCRC’s Annual Report on Form 10-K for the Year ended December 31, 2018. We assume no obligation to update and supplement forward-looking statements that become untrue because of subsequent events, new information or otherwise. This Supplemental Operating and Financial Data is not an offer to sell or solicitation to buy any securities of the Mack-Cali Reality Corporation (“MCRC”). Any offers to sell or solicitations of the MCRC shall be made by means of a prospectus. The information in this Supplemental Package must be read in conjunction with, and is modified in its entirety by, the Annual Report on Form 10-K (the “10-K”) filed by the MCRC for the same period with the Securities and Exchange Commission (the “SEC”) and all of the MCRC’s other public filings with the SEC (the “Public Filings”). In particular, the financial information contained herein is subject to and qualified by reference to the financial statements contained in the 10-K, the footnotes thereto and the limitations set forth therein. Investors may not rely on the Supplemental Package without reference to the 10-K and the Public Filings. Any investors’ receipt of, or access to, the information contained herein is subject to this qualification. 50 4Q 2018