Exhibit 99.2
Roseland Residential Trust Supplemental Operating and Financial Data Roseland Residential Trust Supplemental Operating and Financial Data 1Q 2017
Exhibit 99.2
Roseland Residential Trust Supplemental Operating and Financial Data Roseland Residential Trust Supplemental Operating and Financial Data 1Q 2017
2 Jersey City Urby at Harborside 36% leased as of April 30, 2017 Asset Highlights 762 units 69 floors Studios – 25% (188 units) One Bedrooms – 59% (450 units) Two Bedrooms – 16% (124 units) 355 Parking Spaces Annual Tax Award: $3.3mm (10 years) 2018E NOI & Award: $24.4mm Operating Performance Leasing Commencement – 3/1/17 4/30/17 Leased Percentage - 36% Units Leased - 275 RRT Ownership – 85% RRT Cash Flow (2018E): $12.1mm
Index RRT Overview Company Overview NAV Breakdown Financial Highlights Development Highlights 2017 Objectives Geographic Breakdown RRT Financials Balance Sheet Income Statement Liability Overview Portfolio Financials Operating Communities In-Construction Communities Predevelopment and Future Development 3 Q1 2017 Quarry Place at Tuckahoe 41% Leased as of April 30, 2017 Chase II at Overlook Ridge 56% Leased as of April 30, 2017
Roseland Residential Trust Overview Q1 2017
The Company- Roseland Residential Trust 5 Q1 2017 Roseland Residential Trust (RRT or Roseland) is a full service developer and operator of class A multi-family assets. We consider ourselves fully knowledgeable and excellent sharpshooters in our markets. Our future is largely on the New Jersey waterfront (over 50% of our holdings), where we control an extensive land portfolio in premier locations at a low basis with no debt The RRT platform oversees operating and in-construction assets (8,122 units), a geographically desirable land portfolio (11,040 units), sourcing of new development and acquisition opportunities, and repurposing activities. The residential platform will focus in its core markets on executing targeted developments and acquisitions of its partners’ interests RRT’s executive leadership, a cohesive team since 2003, has an average experience of 19 years at Roseland and 28 years in the industry: Marshall Tycher Founder & Chairman Michael DeMarco Chief Executive Officer Andrew Marshall President & Chief Operating Officer Ivan Baron Chief Legal Counsel Bob Cappy Chief Financial Officer Gabriel Shiff Chief Investment Officer Brenda Cioce President, Roseland Residential Services 1 Q1 Highlights: Roseland closed with The Rockpoint Group, L.L.C. on a $300mm equity commitment to facilitate the continued expansion of RRT Roseland commenced leasing activities at Urby. As of April 30, 2017 the property was 36% leased, representing absorption of 275 apartments in two months of leasing activity, with average rents at $55.49/SF, or $2,878 per apartment On April 3, 2017 Roseland closed on the acquisition of the 523-apartment Monaco in Jersey City, converting its 15% subordinate ownership to 100%
Roseland Market and Portfolio Overview- Management’s Discussion 6 Q1 2017 RRT manages a growing portfolio of owned, under construction, and future development assets on the New Jersey Waterfront, Boston, Philadelphia and Washington D.C. with the remaining holdings primarily in suburban locations in high income areas in New Jersey. RRT is well positioned to benefit from the demographics and shortage of new class A housing in these markets, with fundamentals and macroeconomic trends in our core geographies continuing to show strength. Platform Poised For Growth: RRT’s Q1 NAV was approximately $1.49bn comprised of $150mm of Rockpoint capital and $1.338bn of MC equity ($13.38/share). MC’s $13.38 per share value compares to a Q4 value of $13.52 The quarterly variance is a result of a $100mm cash transfer from RRT to MC for debt amortization (-$1.00/share) and portfolio asset value growth of $86mm (+$0.86/share) Roseland’s transformation is largely complete with the elimination of nearly all subordinate interests and the execution of the Rockpoint capital commitment Rockpoint has an additional $150mm capital commitment to RRT, with RRT having no cash obligation before Rockpoint funding RRT has a portfolio of strategic and valuable land holdings, mostly with zoning in place (Jersey City – 4,000; Port Imperial – 2,000; Overlook Ridge – 800) RRT has a track record of on-time and on-budget product delivery RRT’s stabilized communities are experiencing rent growth; RRT’s lease-up communities have absorbed quickly in the market (Urby at 36%; Chase II at 56%; Quarry Place at 41%) Financial Impact: Projected material growth in RRT cash flow 2018; Operating cash flow projection of $54mm in 2018 from $17mm in 2016 a percentage change of 218% Rent Growth: Rents in our primary sub-markets, markets fueling much of our future development activity, have continued to grow over the last year: Jersey City at 1.4% and Overlook Ridge at 6.5% (with no concessions). RRT’s remaining portfolio, has experienced ~3.0% rental growth over the last year (East Boston at 0.5% ; Port Imperial 0% due to adjacent construction activity; Washington, DC at 4.9% ; Other NJ Holdings at 2.2%)
RRT Jersey City Market Achievements: Jersey City Urby at Harborside (lease-up): 36% leased (275 units) at $55.49/SF in two months of leasing activity M2 at Marbella (stabilized): the community opened in May 2016 and absorbed at 50 apartments/month at $49.62/SF Marbella and Monaco: While absorbing Jersey City Urby and M2 (586 leases), these adjacent operating communities maintained an average leased percentage of 96.8% with rent growth over the last year In Q1 2017, RRT acquired its joint venture partner’s interest in Plaza 8 & 9 thereby converting its 50% ownership to 100% on this premier waterfront development site. This site along with Plaza 6 (Urby II & III) will allow RRT to develop an additional ~3,500 units along the waterfront On April 3, 2017, RRT acquired its remaining partners’ interest in Monaco, increasing its subordinate ownership from 15% at year-end to 100% Jersey City Market Overview The Myth: Development pipeline charts include potential construction starts in secondary or tertiary sub-markets (~60% of pipeline), some without streets or utilities Premier Sub-Markets: RRT’s growth is exclusively located in the Waterfront & Exchange Place sub-markets, These markets will be the synergistic beneficiary of Mack-Cali’s repositioning of the Harborside office community, including the addition of a ferry dock, as well as the migration of New York employment to Manhattan’s west side 7 Q1 2017 Roseland Market and Portfolio Overview- Management’s Discussion (cont.)
Competitive Portfolio Metrics: Roseland’s high-barrier-to-entry class A portfolio is at the forefront of characteristics supportive of market-leading property valuations and comparable/superior to leading publicly traded residential REITs: (i) top in stabilized market rents: Average revenue per unit of $2,662 (ii) young, and trending lower, average building age: Average age of 10 years (iii) geographically concentrated in northeast gateway markets: Approximately 87% of the assets are in a gateway market with average Percentage Leased of 95.8% Notes: Includes 612 hotel keys and 1,280 apartments of Identified Repurposing units (see page 37). Classification Operating Communities Operating (Subordinated Interests) In-Construction Communities Subtotal Predevelopment and Future Communities Total (1) Q1 2017 4,757 1,065 2,300 8,122 11,040 19,162 Y/E 2017 5,842 542 3,342 9,436 19,162 Y/E 2018 6,864 542 4,061 11,467 7,695 19,162 Y/E 2019 7,580 542 4,405 12,527 6,635 19,162 8 Q1 2017 9,726 Roseland Market and Portfolio Overview- Management’s Discussion (cont.) Target Portfolio: RRT targets approximately 9,726 operating and in-construction apartments by year-end 2017, with forecasted growth to 12,527 apartments by year-end 2019 (54% growth as compared to March 31, 2017)
Portfolio Overview- Net Asset Value (NAV) Summary As of April 30, 2017 Roseland had an NAV of approximately $1.5bn Status: Roseland’s 8,122 unit Operating and In-Construction portfolio contributes 80.7% of NAV In-Construction Assets: RRT’s In-Construction portfolio currently contributes approximately $303mm of NAV with expected growth to over $458mm NAV upon stabilization 9 Q12017 Notes: Roseland NAV represents a valuation midpoint between $1.41bn and $1.56bn. Worcester at City Square Worcester, MA Initial Occupancy: Q4 2017 RiverTrace at Port Imperial West New York, NJ Stablized ($ in millions) Number of Units Total Per Unit Debt JV Partner Roseland RRT % of Total Operating Properties - Wholly Owned 8 2,550 $914 $358 $464 $0 $450 30.2% Operating Properties - Joint Venture 6 2,730 1,488 545 697 378 412 27.7% Operating Properties - Subordinate Interest 2 542 315 581 139 141 35 2.3% Subtotal: Operating Properties 16 5,822 $2,717 $467 $1,300 $519 $897 60.3% In-Construction 9 2,300 423 184 74 47 303 20.4% Pre / Future Development 33 11,040 426 39 0 158 268 18.0% Subtotal 58 19,162 $3,566 $186 $1,374 $724 $1,468 98.7% Fee Business Fee Income Business / Platform $20 $20 1.3% Total Total 58 19,162 $3,586 $1,374 $724 $1,488 100.0% (1) Number of Properties / Projects Estimated Asset Value Asset Value Breakdown Status
Portfolio Overview- Net Asset Value (NAV) Breakdown 10 Q1 2017 Top NAV (net equity) contributors (45%)(1) Urby at Harborside - $220mm Monaco - $168mm Alterra at Overlook Ridge - $96mm Portside 7 & 5/6 at East Pier - $93mm Chase I & II at Overlook Ridge - $94mm $671mm Notes: NAV inclusive of post-quarter closing of Monaco (April 3, 2017). Roseland’s approximate $1.5bn NAV was comprised of: Gross Portfolio Value ($ in Millions) Stabilized Gross Asset Value $4,221 Less: Discount for CIP (649) Discounted Gross Asset Value $3,572 Less: Existing Debt ($1,361) Less: 3rd Party Interests (723) Roseland Net Asset Value $1,488 MCRC Share ~$1,338 Rockpoint Share ~$150 Hudson River Waterfront 56% Boston Metro 24% New York Metro 10% Washington, D.C. 7% Philadelphia Metro 2% Other 1% NAV by Market
Equity Commitment: Rockpoint will commit to fund $300mm into RRT over the next two years, with $150mm funded at closing Mack-Cali will have the option to fund up to $200mm into RRT after Rockpoint’s commitment is fully funded RRT received a deemed funded Existing Equity value at closing of $1.23bn Upon full Rockpoint and Mack-Cali funding, pro forma ownership would be ~83% Mack-Cali and ~17% Rockpoint: As of quarter-end, pro-rata ownership was approximately 89.1% Mack- Cali and 10.9% Rockpoint Waterfall: 6% annual dividend on funded capital (Rockpoint and RRT) 6% annual return on RRT Existing Equity ($1.23bn), with Rockpoint receiving an additional 5% of the amount distributed to RRT Pro Rata based on funded capital and RRT Existing Equity RRT Promote: Upon a capital event, Rockpoint’s pro-rata distribution shall reduce by 50% after achieving an 11% annual IRR Other Key Provisions: RRT and Rockpoint will have the right to cause redemption of the “Rockpoint Transaction” after the fifth anniversary of the closing date without penalty RRT will control governance of the company, but for limited events where consent is required Mack-Cali will have the right to spinout its interests in RRT or otherwise create a public listing for RRT at anytime Roseland Capitalization - Rockpoint Transaction Overview(1) 11 Q1 2017 Affiliates of Rockpoint Group, L.L.C. (“Rockpoint”) closed on a $300mm strategic commitment to facilitate RRT’s ongoing and future development, acquisition and repurposing activities. As of quarter-end, $150mm of Rockpoint capital has been funded. Note: Please see public filings for complete Rockpoint Transaction disclosure.
Roseland Overview- Acquisition Highlights RRT executed multiple transactions to reduce its subordinate interests and expand its ownership and cash flow participation: Recent Highlights: Acquired partners’ interest in Plaza 8 and 9, a premier development site along the Jersey City waterfront resulting in 100% ownership (closed Q1 2017) Acquired partners’ interests in Monaco in Jersey City (523 units) resulting in 100% ownership (closed April 3, 2017) Immediate annual cash flow contribution of approximately $7.8mm 12 Q1 2017 Acquisition Activity Results JV partner’s interest in Monaco 100% ownership in Monaco (523 units) JV partner’s interest in Plaza 8 and 9 100% ownership in Plaza 8 and 9 (~1300 units) Majority and minority partner’s interest in Portside at East Pier 100% ownership in Portside at East Pier (175 units) 100% ownership in Portside 5/6 and 1-4 (596 units) Minority JV partner’s subordinated interest in RiverTrace 22.5% ownership in RiverTrace (316 units) Land partner’s interest in five land parcels in Port Imperial 100% ownership in Parcels 11, 8-9, 16, 1-3 Office, and Park Parcel (~1,000 units) JV partner’s interest in Port Imperial South Garage and Retail 70% ownership in Port Imperial Garage and Retail South from 44% Majority JV partner’s interest in The Chase at Overlook Ridge Overlook Ridge land parcels 100% ownership in The Chase at Overlook Ridge (371 units) 100% ownership in The Chase II at Overlook Ridge (292 units) 100% ownership in remaining land parcels (~800 units)
Notes: Year-end projections based on execution of Roseland’s development/operating plan described herein and internal company projections.. Roseland has exhibited growth across key financial metrics with forecasts of continued material growth(1) Roseland Overview- Cash Flow and Financial Projections 13 Q1 2017 Y/E: 2017 2018 2019 Total Total Total Operating & Construction Apts. 9,726 11,467 12,527 Future Development Apts. 9,436 7,695 6,635 Subordinated Interests Apts. 542 542 542 Average Operating and Construction Ownership 75.9% 79.4% 79.9% Property Operating Cash Flow ($ in millions) $26.4 $53.7 $66.2 % FFO Growth - 103% 23% NAV ($ in millions) $1,771 $2,418 $3,117 $0 $10 $20 $30 $40 $50 $60 $70 2017 2018 2019 Property Operating Cash Flow ($ in millions)
Notes: Projected stabilized yield without the Marriott Hotels at Port Imperial is 6.42 percent. 2015/2016 Achievements - Development Roseland Overview- Development Activity and Cash Flow 14 Q1 2017 Lease-Up Commencements Began Leasing % Leased As of 4/30/2017 Units Projected Yield Stabilized RRT Cash Flow Quarry Place at Tuckahoe Nov-16 41.7% 108 6.61% $1.76M Chase II at Overlook Ridge Nov-16 55.1% 292 6.52% $2.60M Urby at Harborside Mar-17 36.1% 762 7.27% $11.11M Total 41.4% 1,162 7.07% $15.47M In-Construction Portfolio Signature Place at Morris Plains Q4 2017 197 6.64% $2.2M Residences at City Square Q4 2017 365 6.46% $3.6M Lofts at 40 Park Q1 2018 59 6.72% $280K RiverHouse 11 at Port Imperial Q1 2018 295 6.20% $4.20M Portside 5/6 Q2 2018 296 6.18% $3.80M Marriott Hotels at Port Imperial Q2 2018 372 10.03% $7.10M 51 Washington Street Q2 2019 310 6.00% $2.4M 233 Canoe Brook (Apartments) Q3 2019 200 7.14% $3.27M 150 Monument Road Q4 2019 206 6.11% $1.58M Total 2,300 7.05% (1) $28.43M Total 3,462 7.06% $43.9M By year-end 2020, Roseland projects additional annual cash flow contribution of approximately $44mm from its current lease-up and in-construction development activities. Roseland’s in-construction portfolio has deliveries scheduled through 2019, generating continuously growing cash flow RiverHouse 11 at Port Imperial Quarry Place at Tuckahoe
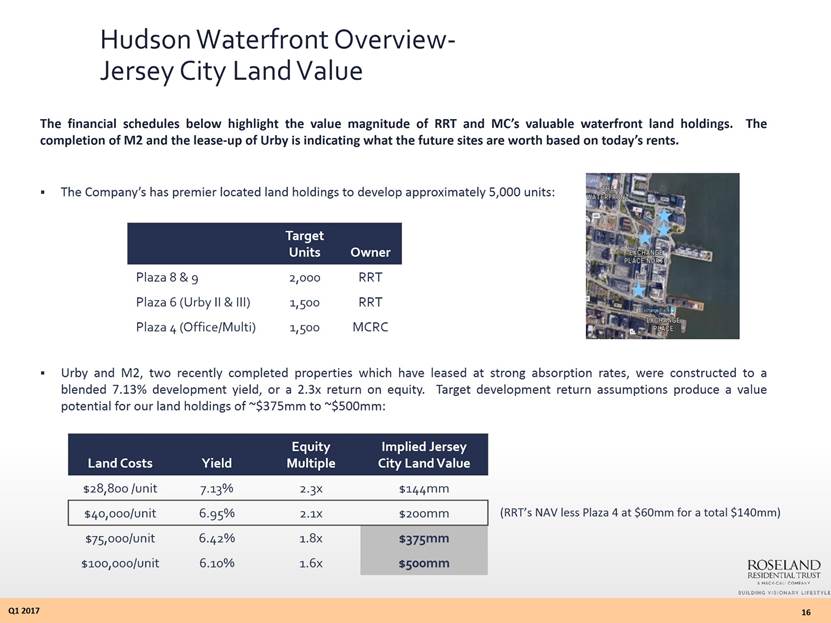
Hudson Waterfront Overview- Jersey City Jersey City continues to exhibit strong demand for luxury housing as residents seek an alternative to Manhattan rents with convenient access to public transportation and an expanding restaurant and neighborhood lifestyle. RRT has concentrated on developing its portfolio of Jersey City assets, most recently by increasing Roseland ownership to 100% in Plaza 8 and Plaza 9 and in Monaco. 15 Q1 2017 JERSEY CITY, NJ RRT Core Jersey City Holdings NYC Jersey City 2017 Projected Cash Flow 2019 Projected Cash Flow % RRT NAV $11mm $20mm 38% Monaco - 523 units Stabilized Urby at Harborside - 762 units 36% leased (275 units) With over 14 square miles and multiple sub-markets, RRT assets are strategically located on the highly desirable waterfront sub-market
Hudson Waterfront Overview- Jersey City Land Value The financial schedules below highlight the value magnitude of RRT and MC’s valuable waterfront land holdings. The completion of M2 and the lease-ups of Urby is indicating what the future sites are worth based on today’s rents. The Company’s has premier located land holdings to develop approximately 5,000 units: Urby and M2, two recently completed properties which have leased at strong absorption rates, were constructed to a blended 7.13% development yield, or a 2.3x return on equity. Target development return assumptions produce a value potential for our land holdings of ~$375mm to ~$500mm: 16 Q1 2017 Target Units Owner Plaza 8 & 9 2,000 RRT Plaza 6 (Urby II & III) 1,500 RRT Plaza 4 (Office/Multi) 1,500 MCRC Land Costs Yield Equity Multiple Implied Jersey City Land Value $28,800 /unit 7.13% 2.3x $144mm $50,000/unit 6.79% 2.0x $250mm $75,000/unit 6.42% 1.8x $375mm $100,000/unit 6.10% 1.6x $500mm
Hudson Waterfront Overview- Port Imperial Port Imperial is a 200-acre mixed-use development site on the New Jersey waterfront directly across from Midtown Manhattan. The combined site straddles the Weehawken and West New York border, offering unparalleled views of Manhattan. Roseland’s development of Port Imperial has transformed the site into a significant residential, commercial and transportation center. 17 Q1 2017 NYC Significant Metrics Operating Communities Land Holdings % RRT NAV RiverTrace 2,000+ units Office parcel 16% In Construction Marriott Hotels 372 Keys Initial Occupancy: Q1 2018 Stabilized NOI: $13.0mm River House 11 295 Units Initial Occupancy: Q1 2018 Stabilized NOI: $7.7mm Port Imperial is located directly across from Midtown View of NYC from Port Imperial
Capital Raise: The Company closed on the Rockpoint Transaction in March thereby facilitating the continued growth of RRT without burdening the Company’s balance sheet Repurposing Activities: Roseland envisions continued success in its repurposing program of converting under performing office holdings to higher valued residential use Recent Construction Starts: Q4 – 2015: Signature Place in Morris Plains, NJ (197 units) Q4 – 2016: 150 Monument Road in Bala Cynwyd, PA (206 units) Q4 – 2016: 233 Canoe Brook Road in Short Hills, NJ (200 units; 240 keys) Leasing: Roseland targets the stabilization of 1,162 apartments in 2017 (Chase II at Overlook Ridge, Quarry Place at Tuckahoe, Urby at Harborside) Subordinate Interest Reduction: RRT has made significant strides in reducing its subordinate interest partnerships. At year-end 2015, RRT had an interest in 3,025 subordinate operating apartments. Inclusive of the Monaco closing in April 2017 RRT’s subordinate interest portfolio was reduced to 542 apartments (an 82% reduction) Capital Commitments: Roseland’s known projected future capital commitments for its in-construction portfolio is approximately $83mm Construction Starts: 2017 target start activity of 1,604 apartments will produce an operating and in-construction portfolio at year-end 2017 of approximately 9,726 apartments, with average ownership of 76% 18 Q1 2017 Roseland Overview- 2017 Strategic Objectives Monaco Jersey City, NJ Apts: 523
Numerous sources have reported +23,000 unit development hitting Jersey City in the near future In fact, this is only the potential numbers which include secondary locations, some without streets or utilities To date, successful absorption of ~8,000, with the market maintaining strong occupancy and continued rent growth Of the 15,000 remaining units, secondary sub-markets make up approximately 9,000 (60%) of the remaining units ~ 6,000 units are approved for development in Jersey City Premier Markets (Waterfront and Exchange Place) Jersey City- Over Development: The Myth 19 Journal Square 3,600 units Liberty Harbor 4,400 units Waterfront 3,000 units Represents approved future multifamily development in Premier Market. Operating (1996-2016) Submarkets Premier Markets 8,000 Journal Square 3,600 Waterfront 3,000 Liberty Harbor 4,400 Exchange Place 3,000 Other 1,000 6,000 9,000 Exchange Place 3,000 units Q1 2017
Jersey City- Future Competitive Pipeline 20 Jersey City Premier Market Development Jersey City Urby at Harborside -762 units - opened in March 2017. As of April 30 2017, it was 36% leased. RRT has no additional product currently under construction. Of the ~6,000 units approved for future development, approximately 1,250 are scheduled to open over the next several months. The 2017 remaining deliveries consist of three projects, including one in Liberty Harbor and two in the Newport submarket, at an average unit count of 415 units 2017 Projected Openings (Primary Markets) Units Projected Opening Developer The Ellipse 376 Summer - 2017 Lefrak The Vantage 448 Summer - 2017 Fisher Development Hudson Exchange 421 Fall - 2017 Forest City Total 1,245 Waterfront Exchange Place Jersey City The market has reacted to fears of over supply by slowing down delivery. Q1 2017 Jersey City Current Lease-up Absorption Leasing Commenced Units Current % Leased Units Leased Urby Mar-17 762 36% 275 Journal Squared Mar-17 538 ~30% ~160 Trump Bay Street Dec-16 447 ~50% ~269
Operating and In-Construction Properties- Geographic Breakdown 21 Q1 2017 Portfolio Summary (% by units) Operating Properties In Construction Boston Metro 4 properties / 1,560 units 2 properties / 661 units Total 6 properties / 2,221 units Jersey City 4 properties / 2,008 units Suburban NJ, NY & PA 6 properties / 738 units 5 properties / 972 units Total 11 properties / 1,710 units Washington DC 2 properties / 1,200 units Port Imperial 1 properties / 316 units 2 properties / 667 units Total 3 properties / 983 units Roseland’s operating portfolio is predominantly located in gateway markets with an average asset age of 10 years. Port Imperial 18% Suburban NJ, NY & PA 20% Washington DC 13% Jersey City 23% Boston Metro 26%
Future Development Properties- Geographic Breakdown 22 Q1 2017 Portfolio Summary (% by units) Boston Metro 4 properties / 1,104 units Jersey City 7 properties / 4,000+ units Suburban NJ, NY & PA 11 properties / 2,755 units Washington DC 2 properties / 552 units Port Imperial 8 properties / 2,029 units Roseland’s strategically located land portfolio will fuel its future growth: Acquisition Risk: Portfolio growth is not subject to acquisition risk as Roseland controls its sizable future development portfolio inclusive of accretive repurposing opportunities Development Risk: Future development is substantially in communities where Roseland has developed before, or more specifically adjacent to existing developments, thereby dramatically reducing our development risk. This allows RRT to have intimate knowledge on operating expenses and construction costs, and most importantly, achievable rent thresholds Port Imperial 19% Suburban NJ, NY & PA 27% Washington DC 5% Jersey City 38% Boston Metro 11%
Financial Schedules Q1 2017

Financial Highlights- RRT Balance Sheet 24 $ in thousands Q1 2017 Notes: Increase primarily resulting from acquisition of Plaza 8 and 9 interests ($61 million), in-construction development and repurposing expenditures ($62 million), and the transfer of 135 Chestnut, 120 Passaic and One Water Street to RRT ($9 million). Increase primarily resulting from Alterra I and II financing ($100 million) and construction loan advances ($42 million). AS OF AS OF MAR 31, 2017 DEC 31, 2016 ASSETS Rental Property Land and Leasehold Interests $274,618 $210,697 Buildings and Improvements 627,079 582,361 Construction in Progress 239,095 217,920 Furniture, Fixtures and Equipment 20,260 18,312 Total Gross Rental Property (1) 1,161,052 1,029,290 Less: Accumulated Depreciation (39,794) (41,186) Net Investment in Rental Property 1,121,258 988,104 Cash and Cash Equivalents 144,926 17,186 Investments in Unconsolidated Joint Ventures 241,965 238,498 Unbilled Rents Receivable, net 519 165 Deferred Charges and Other Assets 43,404 33,736 Restricted Cash 4,331 3,280 Accounts Receivable 2,781 3,559 Total Assets 1,559,184 $1,284,528 LIABILITIES AND EQUITY LIABILITIES Mortgages, Loans Payable and Other Obligations (2) $424,957 283,104 Accounts Pay, Accrued Expenses and Other Liabilities 51,089 36,945 Rents Recieved in Advance and Security Deposits 2,958 2,406 Accrued Interest Payable 1,251 420 Total Liabilities 480,255 322,875 Redeemable Noncontrolling Interests - Rockpoint Capital 150,527 - Noncontrolling Interest in Consolidated Joint Ventures 20,468 20,707 Mack-Cali Capital 907,934 940,946 Total Liabilities and Equity 1,559,184 1,284,528
Financial Highlights- RRT Income Statement 25 $ in thousands Q1 2017 Notes: Includes net operating income before debt service from Consolidated Operating Communities of $6.1 million and $4.2 million, depreciation of $3.9 million and $4.1 million and amortization of in-place leases related to the acquisition of Chase I and Portside 7 of $0 and $1.6 million for the three months ended March 31, 2017 and March 31, 2016, respectively. Three Months Ended Three Months Ended March 31, 2017 March 31, 2016 REVENUE: Base Rents $9,350 $8,203 Escalation and Recoveries from Tenants 417 287 Parking Income 1,590 1,327 Other Income 460 474 Total Revenue $11,817 $10,291 EXPENSES: Real Estate Taxes $2,297 $2,064 Utilities 708 681 Operating Services 3,070 2,870 Real Estate Service Expenses (Net) 500 682 General and Administrative 2,372 3,255 Acquisition Costs - - Depreciation and Amortization 4,239 5,732 Total Expenses $13,186 $15,284 Operating Income Loss (1) ($1,369) ($4,993) OTHER (EXPENSE) INCOME: Interest Income $40 $1 Equity in Earnings (Loss) in Unconsolidated Joint Ventures (464) (1,231) Gain on Sale of Investment in Unconsolidated Joint Ventures 5,149 10,156 Total Other (Expense) Income $4,725 $8,926 Net Income (Loss) $3,356 $3,933 Minority Interest in Consolidated JV's 238 681 Redeemable Noncontrolling Interest - Distributions (527) - Net Income Available to Common Equity 3,067 4,614
Financial Highlights- Debt Maturities 26 Q1 2017 Notes: Reflects debt at effective ownership percentage. Excludes debt associated with Unconsolidated Subordinate Joint Ventures. Weighted average LIBOR rate for floating rate debt is 0.8901%. Includes approximately $135 million of actual construction loans balances as of March 31, 2017, which have a maximum loan balance of approximately $422 million. At quarter-end, Roseland’s total indebtedness was $715mm comprised of $425mm consolidated debt and $290mm of allocated unconsolidated debt (1) Blended fixed rate interest: 4.20% Blended floating rate interest: 3.39% Total consolidated leverage represents 28% debt ratio assuming a Roseland net equity of $1.5bn (see page 8) $ in thousands As of 3/31/17 Consolidated Debt Maturities Fixed Rate Floating Rate (2) Total % of Total Weighted Average on Fixed Rate Debt Weighted Average on Floating Rate Debt (2) 2017 $0 $28,539 $28,539 6.6% N/A 3.1% 2018 0 64,847 64,847 15.1% N/A 4.0% 2019 0 69,013 69,013 16.0% N/A 3.0% 2021 4,000 0 4,000 0.9% 4.4% N/A 2023 131,498 0 131,498 30.6% 3.5% N/A Thereafter 132,600 0 132,600 30.8% 4.0% N/A Total Mortgages Payable per Balance Sheet $268,098 $162,399 $430,497 (3) 100.0% 3.8% 3.4% Total Mortgage Deferred Finance Costs (5,540) Total Mortgages Payable and Misc Obligations $268,098 $162,399 $424,957 Unconsolidated JV Debt Maturities Fixed Rate Floating Rate (2) Total % of Total Weighted Average on Fixed Rate Debt Weighted Average on Floating Rate Debt (2) 2017 0 17,714 17,714 6.1% N/A 3.2% 2020 41,250 527 41,777 14.4% 3.2% 3.5% Thereafter 230,131 0 230,131 79.5% 4.9% N/A Total Unconsolidated JV mortgages payable (1) $271,381 $18,241 $289,622 100.0% 4.6% 3.2%
Community Highlights Q1 2017

Financial Highlights- Operating & Lease-Up Communities As of March 31, 2017, Roseland had: Wholly-owned or joint venture interest in 3,838 stabilized operating apartments and 1,984 apartments in lease-up or repositioning stages (Total: 5,822 apartments) The stabilized portfolio had a leased percentage of 97.5%, compared to 96.1% in Q4 2016 Jersey City Urby at Harborside, began leasing in March 2017, and was 18% leased as of Q1 2017 (current: 36%) The Chase II at Overlook Ridge, MA was 40.4% leased as of Q1 2017 (current: 56%) Quarry Place at Tuckahoe, NY was 31.5% leased as of Q1 2017 (current: 41%) Roseland continues to convert its promoted interests via disposition, acquisition or ownership buy-ups. Recent achievements include: Monaco, Jersey City, NJ: Subsequent to quarter-end, Roseland acquired its partners’ majority and minority interests. Converting a 15% subordinate interest position to a wholly owned asset RiverTrace at Port Imperial: Converted to a 22.5% heads-up, cash-flowing, JV in October 2016 28 Q1 2017
Financial Highlights- Operating Communities 29 Q1 2017 Notes: Ownership represents Company participation after satisfaction of Priority Capital. See Capitalization Details schedule herein. Subsequent to quarter-end Roseland, increased its ownership to 100 percent. Unit count excludes 3 apartments offline until completion of all renovations; Percentage Leased excludes 44 units undergoing renovation. Excludes approximately 83,083 SF of ground floor retail. $ in thousands Average Average Percentage Percentage Revenue Revenue Rentable Avg. Year Leased Leased Per Home Per Home NOI NOI Operating Communities Location Ownership Apartments SF Size Complete Q1 2017 Q4 2016 Q1 2017 Q4 2016 Q1 2017 Q4 2016 Consolidated Alterra at Overlook Ridge Revere, MA 100.00% 722 663,139 918 2008 97.8% 96.3% $1,880 $1,921 $2,374 $2,039 The Chase at Overlook Ridge Malden, MA 100.00% 371 337,060 909 2014 98.9% 96.5% 2,061 2,100 1,484 1,510 Park Square Rahway, NJ 100.00% 159 184,957 1,163 2009 96.9% 97.5% 2,107 2,113 385 349 Riverw atch New Brunswick, NJ 100.00% 200 147,852 739 1997 99.5% 97.0% 1,801 1,809 445 402 Portside at East Pier - 7 East Boston, MA 100.00% 175 156,091 892 2015 99.4% 97.2% 2,677 2,809 956 935 Consolidated 100.00% 1,627 1,489,099 915 98.3% 96.6% $2,019 $2,062 $5,644 $5,235 Joint Ventures RiverTrace at Port Imperial West New York, NJ 22.50% 316 295,767 936 2014 95.3% 94.9% $3,158 $3,134 $1,771 $1,731 M2 Jersey City, NJ 24.27% 311 273,132 878 2016 96.8% 95.5% 3,194 3,038 1,912 1,669 RiverPark at Harrison Harrison, NJ 45.00% 141 125,498 890 2014 97.2% 97.8% 2,199 2,264 521 474 Station House Washington, DC 50.00% 378 290,348 768 2015 93.9% 93.9% 2,793 2,792 2,138 1,942 Joint Ventures 34.82% 1,146 984,745 859 95.5% 95.1% $2,929 $2,888 $6,342 $5,816 Subordinate Interests (1) Marbella Jersey City, NJ 24.27% 412 369,515 897 2003 98.1% 97.1% $3,170 $3,113 $2,626 $2,301 Monaco (2) Jersey City, NJ 28.76% 523 475,742 910 2011 98.5% 96.2% 3,522 3,448 3,822 3,534 Metropolitan at 40 Park Morristown, NJ 12.50% 130 124,237 956 2010 99.2% 93.8% 3,335 3,346 734 806 Subordinate Interests 25.04% 1,065 969,494 910 98.4% 96.3% $3,363 $3,306 $7,182 $6,641 Total Residential - Stabilized 59.74% 3,838 3,443,338 897 97.5% 96.1% $2,664 $2,654 $19,168 $17,692 Lease-up / Repositions Consolidated The Chase II at Overlook Ridge Malden, MA 100.00% 292 261,101 894 2016 40.4% 11.0% NA NA (180) (69) Quarry Place at Tuckahoe Eastchester, NY 76.25% 108 105,509 977 2016 31.5% 12.0% NA NA (160) (67) Consolidated 93.59% 400 366,610 917 38.0% 11.3% $0 $0 ($340) ($136) Joint Ventures Crystal House (3) Arlington, VA 25.00% 822 738,786 899 1962 87.3% 92.4% 1,899 1,885 2,247 2,209 Urby at Harborside Jersey City, NJ 85.00% 762 474,476 623 2017 18.0% NA NA NA 0 NA Joint Ventures 53.86% 1,584 1,213,262 766 54.0% 48.0% $985 $978 $2,247 $2,209 Total Residential - Operating Communities (4) 60.46% 5,822 5,023,210 863 81.57% 77.15% $2,024 $2,016 $21,075 $19,765 Operating Highlights
Financial Highlights- Operating Communities 30 Q1 2017 Notes: The MCRC Balance represents capital account held by Marbella Rosegarden, L.L.C., of which the Company owns a 48.53 percent interest. Includes preferred return on capital account. Equity Capital balances apply to Metropolitan at 40 Park. The MCRC balance represents capital account held by Rosewood Epsteins, L.L.C., of which the Company owns a 50 percent interest. Upon a capital event, the Company receives a promoted additional 25 percent interest over a 9.00 percent IRR to heads-up capital accounts. $ in thousands Third Outstanding Maximum Maturity Interest MCRC Party Return Operating Communities Ownership Apartments Balance Balance Date Rate Capital Capital Rate Notes Consolidated Alterra at Overlook Ridge 100.00% 722 $100,000 $100,000 2/1/2024 3.75% The Chase at Overlook Ridge 100.00% 371 72,500 72,500 2/1/2023 3.625% Park Square 100.00% 159 27,500 27,500 4/10/2019 L + 1.75% Riverw atch 100.00% 200 0 0 Portside at East Pier - 7 100.00% 175 58,998 58,998 8/1/2023 3.44% Consolidated 100.00% 1,627 $258,998 $258,998 Joint Ventures RiverTrace at Port Imperial 22.50% 316 $82,000 $82,000 11/10/2026 3.21% M2 24.27% 311 72,986 75,000 3/30/2018 L + 2.25% 15,997 50,215 9.00% RiverPark at Harrison 45.00% 141 30,000 30,000 8/1/2025 3.70% $1,373 $1,811 7.25% Station House 50.00% 378 100,700 100,700 7/1/2033 4.82% 45,658 45,501 Joint Ventures 34.82% 1,146 $285,686 $287,700 $63,028 $97,527 Subordinate Interests Marbella 24.27% 412 $95,000 $95,000 5/1/2018 4.99% $125 $7,567 9.50% (1),(2) Monaco 28.76% 523 165,000 165,000 2/1/2021 4.19% 0 83,721 9.00% (2) Metropolitan at 40 Park 12.50% 130 37,438 37,438 9/1/2020 3.25% 695 21,765 9.00% (2),(3) Joint Ventures 25.04% 1,065 $297,438 $297,438 $820 $113,053 Total Residential - Stabilized 59.74% 3,838 $842,122 $844,136 $63,848 $210,580 Lease-up / Repositions Consolidated The Chase II at Overlook Ridge 100.00% 292 $40,317 $48,000 12/16/2018 L + 2.25% Quarry Place at Tuckahoe 76.25% 108 28,540 28,540 8/1/2017 L + 2.35% 27,664 869 8.00% Consolidated 93.59% 400 $68,857 $76,540 $27,664 $869 Joint Ventures Crystal House 25.00% 794 $165,000 $165,000 4/1/2020 3.17% $27,187 $80,848 (4) Urby at Harborside 85.00% 762 173,919 192,000 8/1/2029 5.197% 109,059 19,246 Joint Ventures 54.38% 1,556 $338,919 $357,000 $136,246 $100,094 Total Residential - Operating Communities 60.64% 5,794 $1,249,898 $1,277,676 $227,758 $311,543 Project Debt Capital Balance Overview
Financial Highlights- Operating Commercial Assets 31 Q1 2017 $ in thousands Notes: Capital balance applies to both Port Imperial Garage South and Port Imperial Retail South. Equity Capital balances apply to Shops at 40 Park. The MCRC balance represents capital account held by Rosewood Epsteins, L.L.C., of which the Company owns a 50 percent interest. Third Outstanding Maximum Maturity Interest MCRC Party Return Operating Commercial Balance Balance Date Rate Capital Capital Rate Notes Consolidated Port Imperial Garage South $32,600 $32,600 12/1/2029 4.78% $1,184 $4,498 (1) Port Imperial Retail South 4,000 4,000 12/1/2021 4.41% 0 0 Port Imperial Garage North 0 0 0 0 Port Imperial Retail North 0 0 0 0 Consolidated $36,600 $36,600 $1,184 $4,498 Subordinate Interests Shops at 40 Park $6,283 $6,283 8/13/2018 3.63% $0 $0 (2) Riverwalk at Port Imperial 0 0 0 5,832 9.00% Subordinate Interests $6,283 $6,283 $0 $5,832 Total Commercial $42,883 $42,883 $1,184 $10,330 Project Debt Capital Balance Overview Percentage Percentage Rentable Year Leased Leased NOI NOI NOI Operating Commercial Location Ownership Spaces SF Complete Q1 2017 Q4 2016 Q1 2017 Q4 2016 YTD 2017 Consolidated Port Imperial Garage South Weehawken, NJ 70.00% 800 320,426 2013 NA NA $389 $481 $389 Port Imperial Retail South Weehawken, NJ 70.00% 16,736 2013 53.5% 53.5% 73 25 73 Port Imperial Garage North Weehawken, NJ 100.00% 786 304,617 2015 NA NA 216 384 216 Port Imperial Retail North Weehawken, NJ 100.00% 8,365 2015 100.0% 100.0% 71 75 71 Consolidated 84.44% 650,144 69.0% 69.0% $749 $965 $749 Subordinate Interests Shops at 40 Park Morristown, NJ 12.50% 50,973 2010 65.5% 65.5% $211 $209 $211 Riverwalk at Port Imperial West New York, NJ 20.00% 30,745 2008 50.9% 64.0% 177 129 177 Subordinate Interests 15.32% 81,718 60.0% 64.9% $388 $338 $388 Total Commercial 76.72% 731,862 67.99% 68.54% $1,137 $1,303 $1,137 Operating Highlights
Financial Highlights- In-Construction Communities As of March 31, 2017, Roseland had: Wholly owned or joint venture interests in 1,928 in-construction apartments and 372 hotel keys (9 projects) The in-construction portfolio is projected to produce stabilized NOI of $54 million; Roseland’s average ownership is approximately 96% After projected debt service of approximately $22 million, Roseland’s estimated share of net cash flow is approximately $32 million Roseland has a remaining equity capital commitment to the buildout of this portfolio of approximately $83mm 32 Q1 2017
Financial Highlights- In-Construction Communities 33 Q1 2017 Notes: Includes temporary advance of $670K. Projected stabilized yield without the hotel project is 6.42 percent. $ in thousands Third Projected Projected Apartment MCRC Party MCRC Initial Project Stabilized Stabilized Community Location Ownership Homes/Keys Costs Debt Capital Capital Costs Capital Start Occupancy Stabilization NOI Yield Consolidated Marriott Hotels at Port Imperial Weehawken, NJ 90.00% 372 129,600 94,000 32,040 3,560 62,684 32,710 (1) Q3 2015 Q2 2018 Q2 2019 13,000 10.03% Residences at City Square Worcester, MA 100.00% 365 92,015 58,000 34,015 0 43,359 34,015 Q3 2015 Q4 2017 Q4 2018 5,942 6.46% Signature Place at Morris Plains Morris Plains, NJ 100.00% 197 58,651 42,000 16,651 0 26,559 16,651 Q4 2015 Q4 2017 Q3 2018 3,894 6.64% Portside 5/6 East Boston, MA 100.00% 296 111,388 73,000 38,388 0 48,326 38,388 Q4 2015 Q2 2018 Q2 2019 6,882 6.18% RiverHouse 11 at Port Imperial Weehawken, NJ 100.00% 295 123,984 78,000 45,984 0 54,198 30,335 Q1 2016 Q1 2018 Q1 2019 7,693 6.20% 51 Washington Street Conshohocken, PA 100.00% 310 89,440 53,664 35,776 0 20,841 21,014 Q3 2016 Q2 2019 Q2 2020 5,370 6.00% 233 Canoe Brook (Apts) Short Hills, NJ 100.00% 200 82,642 43,470 39,172 0 5,634 5,253 Q4 2016 Q3 2019 Q3 2020 6,326 7.65% 150 Monument Road Bala Cynwyd, PA 100.00% 206 59,308 35,585 23,723 0 4,281 4,853 Q4 2016 Q4 2019 Q4 2020 3,643 6.14% Consolidated 98.34% 2,241 $747,028 $477,719 $265,749 $3,560 $265,882 $183,219 $52,750 7.01% Joint Ventures Lofts at 40 Park Morristown, NJ 25.00% 59 17,972 13,950 2,011 2,011 5,670 1,740 Q3 2016 Q1 2018 Q1 2019 1,208 6.72% Joint Ventures 25.00% 59 $17,972 $13,950 $2,011 $2,011 $5,670 $1,740 $1,208 6.72% Total In-Construction Communities 96.46% 2,300 $765,000 $491,669 $267,760 $5,571 $271,552 $184,959 $53,958 7.05% (2) Development Schedule Project Capitalization - Total Capital as of 1Q-17
Financial Highlights- In-Construction Communities 34 Q1 2017 Notes: Includes accrued preferred return. We forecast construction loan commitments of approximately $133mm. $ in thousands Third Apartment Outstanding Maximum Maturity Interest MCRC Party Return Community Ownership Homes/Keys Balance Balance Date Rate Capital Capital Rate Consolidated Marriott Hotels at Port Imperial 90.00% 372 $24,530 $94,000 10/6/2018 L + 4.50% $36,500 $3,992 8.00% Residences at City Square 100.00% 365 5,036 58,000 12/10/2019 L + 2.50% 34,015 0 Signature Place at Morris Plains 100.00% 197 6,147 42,000 5/20/2019 L + 2.35% 16,651 0 Portside 5/6 100.00% 296 8,084 73,000 9/19/2019 L + 2.50% 38,388 0 RiverHouse 11 at Port Imperial 100.00% 295 22,246 78,000 11/24/2019 L + 2.35% 30,335 0 51 Washington Street 100.00% 310 0 0 (2) 21,014 0 233 Canoe Brook (Apts) 100.00% 200 0 0 (2) 5,253 0 150 Monument Road 100.00% 206 0 0 (2) 4,853 0 Consolidated 98.34% 2,241 $66,043 $345,000 $187,009 $3,992 Joint Ventures Lofts at 40 Park 25.00% 59 2,107 13,950 2/1/2020 L + 2.50% 1,740 1,740 Joint Ventures 25.00% 59 $2,107 $13,950 $1,740 $1,740 Total In-Construction Communities 96.46% 2,300 $68,150 $358,950 $188,749 $5,732 Project Debt Current Capital Balance Overview (1)
As of March 31, 2017 the Company had a future development portfolio of approximately 11,040 apartments 2017 target starts are located in close proximity to operating RRT assets or in identified premier suburban markets Financial Highlights- 2017 Starts 35 Q1 2017 Notes: Roseland is under negotiations to increase its current 20 percent subordinate ownership to 40 percent heads-up ownership. Roseland has a signed acquisition agreement, subject to certain conditions. Current Scheduled 2017 Starts Location Apartments Ownership Start PI North - Building C (1) West New York, NJ 363 40.00% Q2 2017 Overlook IIIC Malden, MA 314 100.00% Q4 2017 Freehold (2) Freehold, NJ 400 100.00% Q4 2017 Crystal House - III Arlington, VA 252 50.00% Q4 2017 PI South - Building 8/9 Weehawken, NJ 275 100.00% Q4 2017 2017 Starts 1,604 78.57%
Financial Highlights- Future Start Communities 36 Q1 2017 Notes: Approved for approximately 290,000 square feet of office space. Ownership subject to change based on final negotiation. Current Projected Future Developments Location Apartment Ownership Const Start PI South - Building 16 Weehawken, NJ 131 100.00% Future PI South - Office 1/3 (1) Weehawken, NJ N/A 100.00% Future PI South - Park Parcel Weehawken, NJ 224 100.00% Future Urby at Harborside - II Jersey City, NJ 750 85.00% Future Urby at Harborside - III Jersey City, NJ 750 85.00% Future Plaza 8 Jersey City, NJ 1,000 100.00% Future Plaza 9 Jersey City, NJ 1,000 100.00% Future Liberty Landing Phase I Jersey City, NJ 265 50.00% Future Liberty Landing - Future Phases Jersey City, NJ 585 50.00% Future PI South - Building 2 Weehawken, NJ 200 50.00% Future San Remo (2) Jersey City, NJ 250 33.33% Future PI North - Riverbend 6 West New York, NJ 471 20.00% Future PI North - Building I West New York, NJ 224 20.00% Future PI North - Building J West New York, NJ 141 20.00% Future Subtotal - Hudson River Waterfront 5,991 Overlook IIIA Malden, MA 445 100.00% Future Overlook IV Malden, MA 45 100.00% Future Portside 1-4 East Boston, MA 300 100.00% Future Subtotal - Boston Metro 790
Financial Highlights- Future Start Communities (cont.) 37 Q1 2017 Notes: Includes 1,280 Identified Repurposing opportunities, with target transfers in 2017. Current Projected Future Developments Location Apartment Ownership Const Start 233 Canoe Brook Road - Hotel Short Hills, NJ 240 100.00% Future 1633 Littleton (repurposing) Parsippany, NJ 345 100.00% Future Identified Repurposing A Bergen County, NJ 300 100.00% Future RRT Repurposing B Bergen County, NJ 200 100.00% Future Identified Repurposing C Bergen County, NJ 225 100.00% Future Identified Repurposing D Essex County, NJ 300 100.00% Future RRT Repurposing E Westchester County, NY 290 100.00% Future Identified Repurposing F-I Essex County, NJ 140 100.00% Future Identified Repurposing F-2 Essex County, NJ 140 100.00% Future Identified Repurposing G Morris County, NJ 175 100.00% Future Subtotal - Northeast Corridor 2,355 Crystal House - Future Arlington, VA 300 50.00% Future Subtotal - Washington, DC 300 Total Predevelopment and Future Developments (1) 11,040
Definitions 38 Q1 2017 Average Revenue Per Home: Calculated as total apartment revenue for the quarter ended March 31, 2017, divided by the average percent occupied for the quarter ended March 31, 2017, divided by the number of apartments and divided by three. Percentage Leased: The percentage of apartments that are either currently occupied or vacant apartments leased for future occupancy. Consolidated Operating Communities: Wholly owned communities and communities whereby the Company has a controlling interest. Predevelopment Communities: Communities where the Company has commenced predevelopment activities that have a near-term projected project start. Future Development: Represents land inventory currently owned or controlled by the Company. Project Completion: As evidenced by a certificate of completion by a certified architect or issuance of a final or temporary certificate of occupancy. Identified Repurposing Communities: Communities not currently owned by RRT, which have been identified for transfer from Mack-Cali to RRT for residential repurposing. Project Stabilization: Lease-Up communities that have achieved over 95 Percentage Leased for six consecutive weeks. In-Construction Communities: Communities that are under construction and have not yet commenced initial leasing activities. Projected Stabilized NOI: Pro forma NOI for Lease-Up, In-Construction or Future Development communities upon achieving Project Stabilization Lease-Up Communities: Communities that have commenced initial operations but have not yet achieved Project Stabilization. Projected Stabilized Yield: Represents Projected Stabilized NOI divided by Total Costs. MCRC Capital: Represents cash equity that the Company has contributed or has a future obligation to contribute to a project. Repurposing Communities: Commercial holdings of the Company which have been targeted for rezoning from their existing office to new multi-family use and have a likelihood of achieving desired rezoning and project approvals. Net Asset Value (NAV): We consider NAV to be a useful metric for investors to estimate the fair value of the Roseland platform. The metric represents the net projected value of the Company’s interest after accounting for all priority debt and equity payments. The metric includes capital invested by the Company. Subordinated Joint Ventures: Joint Venture communities where the Company's ownership distributions are subordinate to payment of priority capital preferred returns. Net Operating Income (NOI): Total property revenues less real estate taxes, utilities and operating expenses. Third Party Capital: Capital invested other than MCRC Capital. Operating Communities: Communities that have achieved Project Stabilization. Total Costs: Represents full project budget, including land and developer fees, and interest expense through Project Completion.
DISCLOSURE REGARDING FORWARD-LOOKING STATEMENTS The Company considers portions of this information, including the documents incorporated by reference, to be forward-looking statements within the meaning of Section 21E of the Securities Exchange Act of 1934, as amended. The Company intends such forward-looking statements to be covered by the safe harbor provisions for forward-looking statements contained in Section 21E of such act. Such forward-looking statements relate to, without limitation, our future economic performance, plans and objectives for future operations and projections of revenue and other financial items. Forward-looking statements can be identified by the use of words such as “may,” “will,” “plan,” “potential,” “projected,” “should,” “expect,” “anticipate,” “estimate,” “target”, “continue” or comparable terminology. Forward-looking statements are inherently subject to risks and uncertainties, many of which we cannot predict with accuracy and some of which we might not even anticipate. Although the Company believes that the expectations reflected in such forward-looking statements are based upon reasonable assumptions at the time made, the Company can give no assurance that such expectations will be achieved. Future events and actual results, financial and otherwise, may differ materially from the results discussed in the forward-looking statements. Readers are cautioned not to place undue reliance on these forward-looking statements. Among the factors about which the Company has made assumptions are: -risks and uncertainties affecting the general economic climate and conditions, which in turn may have a negative effect on the fundamentals of the Company’s business and the financial condition of the Company’s tenants and residents; -the value of the Company’s real estate assets, which may limit the Company’s ability to dispose of assets at attractive prices or obtain or maintain debt financing secured by our properties or on an unsecured basis; -the extent of any tenant bankruptcies or of any early lease terminations; -The Company’s ability to lease or re-lease space at current or anticipated rents; -changes in the supply of and demand for the Company’s properties; -changes in interest rate levels and volatility in the securities markets; -The Company’s ability to complete construction and development activities on time and within budget, including without limitation obtaining regulatory permits and the availability and cost of materials, labor and equipment; -forward-looking financial and operational information, including information relating to future development projects, potential acquisitions or dispositions, and projected revenue and income; -changes in operating costs; -The Company’s ability to obtain adequate insurance, including coverage for terrorist acts; -The Company’s credit worthiness and the availability of financing on attractive terms or at all, which may adversely impact our ability to pursue acquisition and development opportunities and refinance existing debt and the Company’s future interest expense; -changes in governmental regulation, tax rates and similar matters; and -other risks associated with the development and acquisition of properties, including risks that the development may not be completed on schedule, that the tenants or residents will not take occupancy or pay rent, or that development or operating costs may be greater than anticipated. For further information on factors which could impact us and the statements contained herein, see Item 1A: Risk Factors in MCRC’s Annual Report on Form 10-K for the year ended December 31, 2016. We assume no obligation to update and supplement forward-looking statements that become untrue because of subsequent events, new information or otherwise. This Supplemental Operating and Financial Data is not an offer to sell or solicitation to buy any securities of the Mack-Cali Reality Corporation (“MCRC”). Any offers to sell or solicitations of the MCRC shall be made by means of a prospectus. The information in this Supplemental Package must be read in conjunction with, and is modified in its entirety by, the Quarterly on Form 10-Q (the “10-Q”) filed by the MCRC for the same period with the Securities and Exchange Commission (the “SEC”) and all of the MCRC’s other public filings with the SEC (the “Public Filings”). In particular, the financial information contained herein is subject to and qualified by reference to the financial statements contained in the 10-Q, the footnotes thereto and the limitations set forth therein. Investors may not rely on the Supplemental Package without reference to the 10-Q and the Public Filings. Any investors’ receipt of, or access to, the information contained herein is subject to this qualification. 39 Q1 2017
Q1 2017