Exhibit 99.1

FIRST QUARTER 2016
Supplemental Operating and Financial Data
Exhibit 99.1
FIRST QUARTER 2016
Supplemental Operating and Financial Data
INDEX
|
|
PAGE(S) |
|
|
|
|
Company Today |
3 |
|
|
|
|
Focus List |
4 - 6 |
|
|
|
|
Economic Incentives and Programs |
7 |
|
|
|
|
Spotlight on: |
|
|
|
|
|
Results |
8 - 9 |
|
|
|
|
Leasing |
10 - 14 |
|
|
|
|
Earnings |
15 - 23 |
|
|
|
|
Financials |
24 - 26 |
|
|
|
|
Portfolio |
27 - 28 |
|
|
|
|
Details on: |
|
|
|
|
|
Leasing |
29 - 39 |
|
|
|
|
Earnings |
40 |
|
|
|
|
Financials |
41 - 44 |
|
|
|
|
Portfolio |
45 - 51 |
|
|
|
|
Company Information |
52 - 53 |
Mack-Cali Realty Corporation Supplemental Operating and Financial Data for the Quarter Ended March 31, 2016
|
Company Today |
|
|
We are a two platform company — office and multi-family.
We own assets in the Hudson River Waterfront area and other transit-based locations.
REIT publicly traded on NYSE (“CLI”)
Substantial development opportunities for Multi-Family
Apartment platform managed by Roseland Residential Trust (“RRT”)
|
|
|
1Q 2016 |
|
4Q 2015 |
| ||
|
Market capitalization: |
|
$ |
4.7 billion |
|
$ |
4.5 billion |
|
|
|
|
|
|
|
| ||
|
Square feet of office space: |
|
24.0 million |
|
24.2 million |
| ||
|
|
|
|
|
|
| ||
|
% leased for office: |
|
87.2 |
% |
86.2 |
% | ||
|
|
|
|
|
|
| ||
|
GAAP rental rate roll-up |
|
18.4 |
% |
8.3 |
% | ||
|
|
|
|
|
|
| ||
|
Operating multi-family units: |
|
5,644 |
|
5,644 |
| ||
|
|
|
|
|
|
| ||
|
% leased for stabilized multi-family: |
|
96.3 |
% |
95.9 |
% | ||
|
|
|
|
|
|
| ||
|
Sr. unsecured debt ratings: |
|
|
|
|
| ||
|
|
|
|
|
|
| ||
|
(S&P/Moody’s/Fitch) |
|
BBB-/Baa3/BB+ |
|
BBB-/Baa3/BB+ |
| ||
|
|
|
|
|
7 Sylvan Way, Parsippany, NJ |
|
Portside at East Pier, East Boston, MA (Full interest acquired April 2016) |
|
|
|
|
|
|
|
|
|
The Chase at Overlook Ridge, Malden, MA (Full interest acquired January 2016) |
|
101 Hudson Street, Jersey City, NJ |
Mack-Cali Realty Corporation Supplemental Operating and Financial Data for the Quarter Ended March 31, 2016
|
Focus List |
|
|
Our changes over the next 24 months
Completed/Underway (Generate Increased Cash Flow)
1. Staffing levels — reduced by 55 positions or $8M, with continued focus
2. Cost of operations — reduced by $7.5M
3. G&A expense — reduced by $3M
4. In 2016 — continued expense reductions as we reduce the size of the office platform
5. Refinance debt for savings — new 5-year term loan for $350M at 3.13% closed in Jan 2016
Next 12 — 18 Months (Balance Sheet / Capital Expenditures / Long-term Cash Flow)
6. Increase occupancy — 87.2% at 3/31/16 and project a clear path to meeting objective of 90% leased by year end 2016. Was 86.2% at 12/31/15 and 84.2% at 12/31/14
7. Planned dispositions — $750M of assets. $300M closed by 4/30/16 and $450M by 10/31/16
8. Reposition assets to “A” quality — six major capital investment programs currently in place
24 Months (Long-term Strategy Execution)
9. New capital investment — we look for 6% initial yield and 11% IRR on new investments. Under contract to purchase 101 Wood Avenue in Edison, NJ and 111 River Street in Hoboken, NJ
10. Focus on our key markets — exited NYC, DC, etc.
11. Funding and growth of the Roseland operations — in the market with Eastdil — projecting $350M equity raise by 6/30/16
Mack-Cali Realty Corporation Supplemental Operating and Financial Data for the Quarter Ended March 31, 2016
|
Focus List - Net Debt to EBITDA Business Plan Effect |
|
|
The Company has a plan with multiple options regarding its Net Debt to EBITDA leverage ratio. The Company expects to take steps to reduce the ratio to a more conservative level.
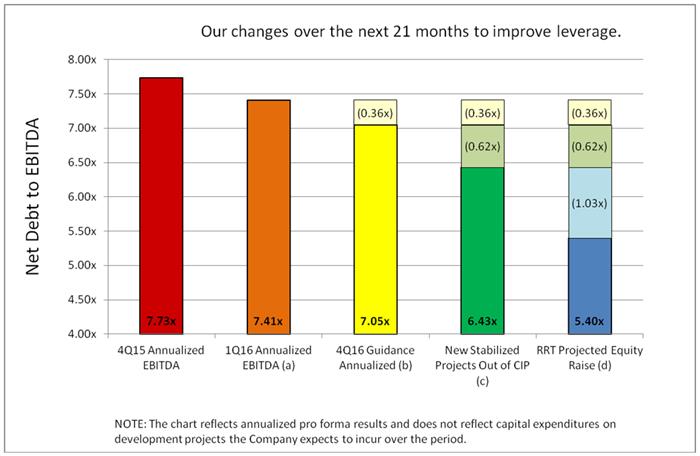
(a) 1Q 2016 Annualized EBITDA is calculated by taking 1Q 2016 EBITDA multiplied by 4. Ratio reflects Net Debt of $2,152,866 as of March 31, 2016. See calculation of EBITDA and Net Debt on page 15.
(b) Assumes successful lease up and expense savings, translating into estimated $19 million in increased EBITDA.
(c) Assumes projects in construction at March 31, 2016 going into service and stabilizing at a 10% return on equity, translating into estimated $30 million in increased EBITDA.
(d) Assumes successful equity raise for multi-family subsidiary, reducing Net Debt by $350 million with estimated proceeds.
Mack-Cali Realty Corporation Supplemental Operating and Financial Data for the Quarter Ended March 31, 2016
|
Focus List - 2017 Lease Expirations |
|
|
2017 is shaping up well to have excellent cash and GAAP results.
· 2017 Expirations total 3.3 million square feet, or 15.9% of leased space (reduced from 3.6 million at 12/31/15).
· We proactively engage significant tenants well in advance of expirations.
· 1.4 million square feet do not expire until the fourth quarter.
· Anticipate occupancy of approximately 90% at year-end 2016; at that level will backfill any vacant space quickly.
· Approximately 25% of 2017 expirations are on the Waterfront (820,000 square feet).
· Quarter-by-quarter, Waterfront rents are increasing and concession packages reducing.
· Progress was made on 2017 expirations during first quarter as follows:
(Square footage in 000’s)
|
|
2017 Expirations as of December 31, 2015 |
|
3,591 |
|
|
|
|
Reduction in 2017 expirations in first quarter, 2016 |
|
(326 |
) |
|
|
|
2017 Expirations as of March 31, 2016 |
|
3,265 |
|
|
Following is our approach to remaining 2017 expirations:
(Square footage in 000’s)
|
|
3,265 |
|
expiring |
|
|
(734 |
) |
in properties we plan to sell |
|
|
(211 |
) |
renewals we expect to finalize near-term in Core and Waterfront properties |
|
|
(704 |
) |
remaining on Waterfront, with a growing backlog of tenant demand |
|
|
(658 |
) |
in Flex space, with historically high retention and occupancy rates |
|
|
958 |
|
remaining in Core suburban properties |
· 958,000 square feet expiring within Core suburban portfolio of 9.4 million square feet represents a manageable 10% rollover in 2017.
Mack-Cali Realty Corporation Supplemental Operating and Financial Data for the Quarter Ended March 31, 2016
|
Economic Incentives and Programs |
|
|
The State of New Jersey currently offers a compelling incentive program to attract and retain businesses in the State through its “Grow New Jersey” program. Below is a program summary and example of an incentive calculation.
Grow NJ
· Provides job-based tax credits for job creation and retention
· Tax credits of $5,000 to $9,750 per job/per year, for up to 10 years for new jobs to the state
· Limited to specific “Qualified Incentive Areas”
· Urban Transit Hub municipalities (“UTH”)
· ‘Mega projects’—logistics, manufacturing, energy, defense, or maritime businesses in a port district
· Distressed municipalities
· Projects in other priority areas
· Eligibility:
· Minimum 35 new jobs and/or 50 retained jobs for most commercial projects
Example — New Tenant to Jersey City
· New jobs at a 6 employees (EEs) per 1,000sf density
|
# of |
|
|
|
Starting |
|
Base |
| |
|
New EEs |
|
SF |
|
Rental Rate |
|
Rent/yr |
| |
|
|
|
60,000 |
|
$40/sf |
|
$ |
2,400,000 |
|
|
360 |
|
|
|
|
|
(2,880,000 |
) | |
|
|
|
Effective rent after incentive |
|
(480,000 |
) | |||
|
Base award (UTH) |
|
$ |
5,000 |
|
|
Bonuses |
|
|
| |
|
Within 0.5 miles of transit station |
|
$ |
2,000 |
|
|
251-400 jobs |
|
500 |
| |
|
Targeted Industry |
|
500 |
| |
|
|
|
$ |
8,000 |
per job/per year |
|
|
|
or |
| |
|
|
|
$ |
2,880,000 |
per year |
· If occupancy is higher than 6 EEs per 1,000sf, the tenant receives the further benefit, which adds to their NOI
· Award based on targeted industry
· Tenant must commit to 1.5 years of term to qualify for 1 year of benefit
· Urban Transit Hub location
· Doesn’t include increases in fixed rent or additional rent payable under the lease
· Retention benefit could be substantially less than as illustrated
Mack-Cali Realty Corporation Supplemental Operating and Financial Data for the Quarter Ended March 31, 2016
Spotlight on Results
Operating Highlights
For the first quarter 2016, Core FFO was $0.49 per share after adjusting for a $913,000 valuation charge at quarter end for mark-to-market of unhedged interest rate swaps as compared to $0.43 per share for the quarter ended March 31, 2015. The quarter’s Core FFO per share of $0.49 grew 13.9 percent primarily due to increased base rents and lower net property expenses.
Funds from operations (FFO) for the quarter ended March 31, 2016 amounted to $48.2 million, or $0.48 per share, as compared to $43.1 million, or $0.43 per share, for the quarter ended March 31, 2015.
Net income (loss) available to common shareholders for the quarter ended March 31, 2016 amounted to $62.2 million, or $0.69 per share, as compared to $(2.5) million, or $(0.03) per share, for the quarter ended March 31, 2015. Included in net income for the quarter ended March 31, 2016 was $61.5 million of net gains from property-related transactions (net of noncontrolling interests in Operating Partnership of $7.2 million). All per share amounts presented above are on a diluted basis.
Mack-Cali’s consolidated commercial in-service portfolio was 87.2 percent leased at March 31, 2016, as compared to 86.2 percent leased at December 31, 2015. The increase in percentage leased is primarily due to positive absorption through leasing activity of 0.8 percent and 0.2 percent as a result of sold properties.
For the quarter ended March 31, 2016, the Company executed 82 leases at its consolidated in-service commercial portfolio totaling 1,124,140 square feet. Of these totals, 385,658 square feet were for new leases and 738,482 square feet were for lease renewals and other tenant retention transactions. Lease transactions included 349,423 square feet in Core properties, 551,674 square feet in Waterfront properties, 155,662 square feet in Flex properties and 67,381 square feet in Non-Core properties. Lease spreads on a GAAP basis were 9.7 percent for new leases and 18.9 percent for renewed or retained leases.
Real Estate Transaction
On January 5, 2016, the Company, which held a 50 percent subordinated joint venture interest in the unconsolidated Overlook Ridge Apartment Investors LLC, 371-unit multi-family operating property located in Malden, Massachusetts, acquired the remaining interest for $39.8 million in cash plus the assumption of a first mortgage loan secured by the property with a principal balance of $52.7 million. The cash portion of the acquisition was funded primarily through borrowings under the Company’s unsecured revolving credit facility.
Rental Property Sales
(dollars in thousands)
For the quarter ended March 31, 2016
|
|
|
|
|
|
|
|
|
Rentable |
|
|
|
|
| ||
|
Sale |
|
|
|
|
|
# of |
|
Square |
|
Net Sales |
|
Realized |
| ||
|
Date |
|
Property/Address |
|
Location |
|
Buildings |
|
Feet |
|
Proceeds |
|
Gain (loss) |
| ||
|
3/11/16 |
|
2 Independence Way (a) |
|
Princeton, New Jersey |
|
1 |
|
67,401 |
|
$ |
4,119 |
|
$ |
(164 |
) |
|
3/24/16 |
|
1201 Connecticut Avenue, NW |
|
Washington, D.C. |
|
1 |
|
169,549 |
|
90,591 |
|
58,764 |
| ||
|
Total Property Sales: |
|
|
|
|
|
2 |
|
236,950 |
|
$ |
94,710 |
|
$ |
58,600 |
|
(a) The Company recorded an impairment charge of $3.2 million on this property during the year ended December 31, 2015 as it estimated that the carrying value of the property may not be recoverable over its anticipated holding period.
The Company recently announced that it reached an agreement to sell its remaining asset in Washington, D.C. at 1400 L Street for approximately $70.5 million, and on April 26, 2016, it completed the sale of 125 Broad Street, for approximately $202 million, exiting the New York City market. The Company expects to complete the 1400 L Street sale by May 2016.
Mack-Cali Realty Corporation Supplemental Operating and Financial Data for the Quarter Ended March 31, 2016
Spotlight on Results
Balance Sheet/Capital Markets
In January 2016, the Company obtained a new $350 million unsecured term loan, which matures in January 2019 with two one-year extension options. The interest rate for the new term loan is currently 140 basis points over LIBOR, subject to adjustment on a sliding scale based on the Company’s unsecured debt ratings, or at the Company’s option, a defined leverage ratio. Mack-Cali entered into interest rate swap arrangements to fix LIBOR for the duration of the term loan. Including costs, the loan provides for a current all-in fixed rate of 3.13 percent. There is no premium or penalty associated with full or partial prepayment of the term loan.
Proceeds from the unsecured term loan were used primarily to repay outstanding borrowings on its $600 million unsecured revolving credit facility, and to repay the Company’s $200 million, 5.8 percent senior unsecured notes that matured on January 15, 2016.
As of March 31, 2016, the Company had total indebtedness of approximately $2.3 billion, with a weighted average annual interest rate of approximately 4.95 percent and a debt-to-undepreciated assets ratio of 40.4 percent. The Company had an interest coverage ratio of 2.9 times for the quarter ended March 31, 2016.
Dividends
In March, the Company’s Board of Directors declared a cash dividend of $0.15 per common share (indicating an annual rate of $0.60 per common share) for the first quarter 2016, which was paid on April 15, 2016 to shareholders of records as of April 5, 2016.
Mack-Cali Realty Corporation Supplemental Operating and Financial Data for the Quarter Ended March 31, 2016
Spotlight on Leasing - Quarter in Review
Consolidated Commercial Leasing Summary
The Company had another successful quarter of leasing with GAAP rental roll-ups averaging 18.4 percent in the first quarter, demonstrating improvement over a solid prior quarter with a 8.3 percent average GAAP rental roll-ups.
Portfolio Summary
|
|
|
3/31/2016 |
|
12/31/2015 |
|
|
Number of buildings |
|
215 |
|
217 |
|
|
Total square feet |
|
23,974,930 |
|
24,211,880 |
|
|
Square feet leased |
|
20,910,999 |
|
20,865,233 |
|
|
Square feet vacant |
|
3,063,931 |
|
3,346,647 |
|
|
Number of tenants |
|
1,588 |
|
1,611 |
|
Leasing Transactions - 1st Quarter 2016 (by type)
|
|
|
Number of |
|
Total |
|
Sq. Ft. |
|
Sq. Ft. Renewed |
|
Average |
|
Median |
|
Weighted Avg. |
|
Weighted Avg. |
|
Leasing Costs |
| ||
|
|
|
Transaction |
|
Square Feet |
|
New Leases |
|
and Other Retained |
|
Square Feet |
|
Square Feet |
|
Term (Yrs) |
|
Rent |
|
PSF/Year |
| ||
|
|
|
|
|
|
|
|
|
|
|
|
|
|
|
|
|
|
|
|
| ||
|
Core |
|
37 |
|
349,423 |
|
166,821 |
|
182,602 |
|
9,444 |
|
4,252 |
|
7.0 |
|
$ |
28.89 |
|
$ |
5.59 |
|
|
Waterfront |
|
9 |
|
551,674 |
|
153,950 |
|
397,724 |
|
61,297 |
|
35,040 |
|
10.8 |
|
35.15 |
|
6.77 |
| ||
|
Flex |
|
20 |
|
155,662 |
|
51,938 |
|
103,724 |
|
7,783 |
|
4,263 |
|
4.0 |
|
18.05 |
|
2.50 |
| ||
|
|
|
|
|
|
|
|
|
|
|
|
|
|
|
|
|
|
|
|
| ||
|
Sub-Total |
|
66 |
|
1,056,759 |
|
372,709 |
|
684,050 |
|
16,012 |
|
5,593 |
|
8.5 |
|
30.56 |
|
5.75 |
| ||
|
Non-Core |
|
16 |
|
67,381 |
|
12,949 |
|
54,432 |
|
4,211 |
|
2,612 |
|
2.7 |
|
23.15 |
|
2.55 |
| ||
|
|
|
|
|
|
|
|
|
|
|
|
|
|
|
|
|
|
|
|
| ||
|
TOTALS |
|
82 |
|
1,124,140 |
|
385,658 |
|
738,482 |
|
13,709 |
|
4,501 |
|
8.2 |
|
$ |
30.12 |
|
$ |
6.08 |
|
Leasing Transactions - 1st Quarter 2016 (by new/renewal)
|
|
|
|
|
|
|
|
|
|
|
|
|
|
|
Weighted |
|
Leasing |
| ||
|
|
|
Number of |
|
Percent of |
|
|
|
Average |
|
Median |
|
Term |
|
Avg Base |
|
Costs |
| ||
|
|
|
Transactions |
|
Transactions |
|
Square Feet |
|
Square Feet |
|
Square Feet |
|
(Yrs) |
|
Rent (a) |
|
PSF/Year (b) |
| ||
|
|
|
|
|
|
|
|
|
|
|
|
|
|
|
|
|
|
| ||
|
New |
|
25 |
|
30 |
% |
385,658 |
|
15,426 |
|
6,425 |
|
10.4 |
|
$ |
30.77 |
|
$ |
6.56 |
|
|
Renew/Other Retained |
|
57 |
|
70 |
% |
738,482 |
|
12,956 |
|
3,175 |
|
7.0 |
|
29.77 |
|
5.71 |
| ||
|
|
|
|
|
|
|
|
|
|
|
|
|
|
|
|
|
|
| ||
|
TOTAL |
|
82 |
|
100 |
% |
1,124,140 |
|
13,709 |
|
4,501 |
|
8.2 |
|
$ |
30.12 |
|
$ |
6.08 |
|
(a) Equals triple net rent plus common area costs and real estate taxes, as applicable.
(b) Represents estimated workletter costs of $36,309,048 and commissions of $19,671,209 committed, but not necessarily expended, during the period for second generation space aggregating 1,124,140 square feet.
Mack-Cali Realty Corporation Supplemental Operating and Financial Data for the Quarter Ended March 31, 2016
Spotlight on Leasing - Quarter in Review
Consolidated Commercial Leasing Summary (continued)
Leasing Transactions - Rental Rate Roll Up/Down (by new/renewal)
For the three months ended March 31, 2016
|
|
|
|
|
Number of |
|
Number of |
|
Number of |
|
|
|
|
|
|
GAAP |
|
Transactions |
|
Transactions |
|
Transactions |
|
|
|
|
|
|
Roll Up/(Down) |
|
Rolled Up |
|
Flat |
|
Rolled Down |
|
Total |
|
|
|
|
|
|
|
|
|
|
|
|
|
|
|
New |
|
9.7 |
% |
5 |
|
— |
|
1 |
|
6 |
|
|
Renew/Other Retained |
|
18.9 |
% |
41 |
|
— |
|
7 |
|
48 |
|
|
|
|
|
|
|
|
|
|
|
|
|
|
|
TOTAL |
|
18.4 |
% |
46 |
|
— |
|
8 |
|
54 |
|
For the three months ended December 31, 2015
|
|
|
|
|
Number of |
|
Number of |
|
Number of |
|
|
|
|
|
|
GAAP |
|
Transactions |
|
Transactions |
|
Transactions |
|
|
|
|
|
|
Roll Up/(Down) |
|
Rolled Up |
|
Flat |
|
Rolled Down |
|
Total |
|
|
|
|
|
|
|
|
|
|
|
|
|
|
|
New |
|
3.2 |
% |
14 |
|
1 |
|
4 |
|
19 |
|
|
Renew/Other Retained |
|
9.0 |
% |
33 |
|
8 |
|
8 |
|
49 |
|
|
|
|
|
|
|
|
|
|
|
|
|
|
|
TOTAL |
|
8.3 |
% |
47 |
|
9 |
|
12 |
|
68 |
|
Mack-Cali Realty Corporation Supplemental Operating and Financial Data for the Quarter Ended March 31, 2016
Spotlight on Leasing - Rollforwards
(for the three months ended March 31, 2016)
Leasing Activity
See detail on pages 29-30
Percent leased increased by 100 basis points in the first quarter. Progress was made in the quarter to strategically dispose of non-core assets, which raised percent leased by 20 basis points. Positive absorption in the quarter through leasing activity provided another 80-basis-point gain to bring the consolidated commercial portfolio to 87.2 percent leased at March 31, 2016
|
|
|
|
|
|
|
Sq. Ft. |
|
|
|
|
|
|
|
|
|
Net |
|
|
|
Sq. Ft. |
|
|
|
|
|
|
Pct. Leased |
|
Inventory |
|
Leased |
|
Inventory |
|
Leased Sq. Ft. |
|
Expiring/ |
|
Incoming |
|
Leasing |
|
Inventory |
|
Leased |
|
Pct. Leased |
|
|
|
|
12/31/2015 |
|
12/31/15 |
|
12/31/15 |
|
Acquired/Disposed |
|
Acquired/Disposed |
|
Adj. Sq. Ft. |
|
Sq. Ft. |
|
Activity |
|
3/31/16 |
|
3/31/16 |
|
3/31/16 |
|
|
|
|
|
|
|
|
|
|
|
|
|
|
|
|
|
|
|
|
|
|
|
|
|
|
|
Core |
|
88.7 |
% |
9,401,105 |
|
8,334,490 |
|
— |
|
— |
|
(289,836 |
) |
349,423 |
|
59,587 |
|
9,401,105 |
|
8,394,077 |
|
89.3 |
% |
|
Waterfront |
|
86.7 |
% |
4,317,978 |
|
3,744,230 |
|
— |
|
— |
|
(372,830 |
) |
551,674 |
|
178,844 |
|
4,317,978 |
|
3,923,074 |
|
90.9 |
% |
|
Flex |
|
91.9 |
% |
5,207,813 |
|
4,785,221 |
|
— |
|
— |
|
(169,805 |
) |
155,662 |
|
(14,143 |
) |
5,207,813 |
|
4,771,078 |
|
91.6 |
% |
|
|
|
|
|
|
|
|
|
|
|
|
|
|
|
|
|
|
|
|
|
|
|
|
|
|
Sub-Total |
|
89.1 |
% |
18,926,896 |
|
16,863,941 |
|
— |
|
— |
|
(832,471 |
) |
1,056,759 |
|
224,288 |
|
18,926,896 |
|
17,088,229 |
|
90.3 |
% |
|
Non-Core |
|
75.7 |
% |
5,284,984 |
|
4,001,292 |
|
(236,950 |
) |
(156,931 |
) |
(88,972 |
) |
67,381 |
|
(21,591 |
) |
5,048,034 |
|
3,822,770 |
|
75.7 |
% |
|
|
|
|
|
|
|
|
|
|
|
|
|
|
|
|
|
|
|
|
|
|
|
|
|
|
TOTALS |
|
86.2 |
% |
24,211,880 |
|
20,865,233 |
|
(236,950 |
) |
(156,931 |
) |
(921,443 |
) |
1,124,140 |
|
202,697 |
|
23,974,930 |
|
20,910,999 |
|
87.2 |
% |
Percentage Leased
|
|
|
Pct. Leased |
|
Impact of |
|
Impact of |
|
Pct. Leased |
|
|
|
|
12/31/15 |
|
Portfolio Changes |
|
Leasing Activity |
|
3/31/16 |
|
|
|
|
|
|
|
|
|
|
|
|
|
Core |
|
88.7 |
% |
0.0 |
% |
0.6 |
% |
89.3 |
% |
|
Waterfront |
|
86.7 |
% |
0.0 |
% |
4.2 |
% |
90.9 |
% |
|
Flex |
|
91.9 |
% |
0.0 |
% |
(0.3 |
)% |
91.6 |
% |
|
|
|
|
|
|
|
|
|
|
|
|
Sub-Total |
|
89.1 |
% |
0.0 |
% |
1.2 |
% |
90.3 |
% |
|
Non-Core |
|
75.7 |
% |
0.5 |
% |
(0.5 |
)% |
75.7 |
% |
|
|
|
|
|
|
|
|
|
|
|
|
TOTALS |
|
86.2 |
% |
0.2 |
% |
0.8 |
% |
87.2 |
% |
|
“Core” |
Long-term hold office properties (excluding Waterfront locations) |
|
“Waterfront” |
Office assets located on NJ Hudson River waterfront |
|
“Flex” |
Non-office commercial assets, primarily office/flex properties |
|
“Non-Core” |
Properties designated for eventual sale/disposition or repositioning |
Mack-Cali Realty Corporation Supplemental Operating and Financial Data for the Quarter Ended March 31, 2016
Spotlight on Leasing - Quarter Stats
Summary of Lease Expirations
(as of March 31, 2016)
See detail on pages 32-39
Our objective is to lengthen the lease term and reduce concessions to provide a more stable and consistent revenue in our portfolio.
|
|
|
|
|
Net Rentable |
|
Pct of Leased |
|
Annualized |
|
Avg. |
|
Pct of |
| ||
|
|
|
Number of |
|
Area of |
|
Sq. Ft. |
|
Base Rental |
|
Annualized |
|
Annualized |
| ||
|
Year of |
|
Leases |
|
Leases |
|
Leases |
|
Revenue |
|
Base Rent |
|
Base Rent |
| ||
|
Expiration |
|
Expiring |
|
Expiring |
|
Expiring |
|
Expiring |
|
Per Sq. Ft. |
|
Expiring |
| ||
|
|
|
|
|
|
|
|
|
|
|
|
|
|
| ||
|
2016 |
|
197 |
|
1,184,662 |
|
5.8 |
|
$ |
27,170,266 |
|
$ |
22.94 |
|
5.5 |
|
|
2017 |
|
331 |
|
3,264,835 |
|
15.9 |
|
83,380,187 |
|
25.54 |
|
16.8 |
| ||
|
2018 |
|
302 |
|
2,915,102 |
|
14.2 |
|
66,566,160 |
|
22.83 |
|
13.4 |
| ||
|
2019 |
|
258 |
|
2,447,790 |
|
11.9 |
|
52,941,119 |
|
21.63 |
|
10.7 |
| ||
|
2020 |
|
216 |
|
1,746,584 |
|
8.5 |
|
38,729,150 |
|
22.17 |
|
7.8 |
| ||
|
2021 & beyond |
|
537 |
|
8,952,739 |
|
43.7 |
|
228,313,397 |
|
25.50 |
|
45.8 |
| ||
|
|
|
|
|
|
|
|
|
|
|
|
|
|
| ||
|
TOTALS |
|
1,841 |
|
20,511,712 |
|
100.0 |
|
$ |
497,100,279 |
|
$ |
24.23 |
|
100.0 |
|
Mack-Cali Realty Corporation Supplemental Operating and Financial Data for the Quarter Ended March 31, 2016
Spotlight on Leasing - Rental Rate Effects
The following schedule sets forth the percentage change in GAAP rent for transactions signed within the period. Transactions signed for space which has been vacant for longer than 12 months are excluded.
|
|
|
Transaction Type |
|
1st Qtr ‘16 |
|
4th Qtr ‘15 |
|
|
|
|
|
|
|
|
|
|
|
Core |
|
|
|
|
|
|
|
|
|
|
New |
|
2.7 |
% |
0.2 |
% |
|
|
|
Renew/Other Retained |
|
7.7 |
% |
8.9 |
% |
|
|
|
|
|
|
|
|
|
|
|
|
Weighted Average |
|
7.0 |
% |
7.9 |
% |
|
|
|
|
|
|
|
|
|
|
Waterfront |
|
|
|
|
|
|
|
|
|
|
New |
|
N/A |
|
4.5 |
% |
|
|
|
Renew/Other Retained |
|
26.7 |
% |
N/A |
|
|
|
|
|
|
|
|
|
|
|
|
|
Weighted Average |
|
26.7 |
% |
4.5 |
% |
|
|
|
|
|
|
|
|
|
|
Flex |
|
New |
|
32.9 |
% |
20.6 |
% |
|
|
|
Renew/Other Retained |
|
12.9 |
% |
9.3 |
% |
|
|
|
|
|
|
|
|
|
|
|
|
Weighted Average |
|
14.9 |
% |
11.2 |
% |
|
|
|
|
|
|
|
|
|
|
Sub-Total |
|
New |
|
9.7 |
% |
3.1 |
% |
|
|
|
Renew/Other Retained |
|
19.9 |
% |
8.9 |
% |
|
|
|
|
|
|
|
|
|
|
|
|
Weighted Average |
|
19.4 |
% |
8.1 |
% |
|
|
|
|
|
|
|
|
|
|
Non-Core |
|
New |
|
10.3 |
% |
10.9 |
% |
|
|
|
Renew/Other Retained |
|
3.9 |
% |
11.0 |
% |
|
|
|
|
|
|
|
|
|
|
|
|
Weighted Average |
|
4.3 |
% |
11.0 |
% |
|
|
|
|
|
|
|
|
|
|
TOTAL |
|
New |
|
9.7 |
% |
3.2 |
% |
|
|
|
Renew/Other Retained |
|
18.9 |
% |
9.0 |
% |
|
|
|
|
|
|
|
|
|
|
|
|
Weighted Average |
|
18.4 |
% |
8.3 |
% |
Mack-Cali Realty Corporation Supplemental Operating and Financial Data for the Quarter Ended March 31, 2016
Spotlight on Earnings - FFO, Core FFO & AFFO
(in thousands, except per share/unit amounts) (unaudited)
Core FFO per share for 1Q-16 was $0.49, an increase of $0.06 per share over 1Q-15. Increased leasing costs due to greater leasing activity in the current quarter is expected to produce higher earnings and coverage in future periods.
|
|
|
Three Months Ended |
| ||||
|
|
|
March 31, |
| ||||
|
|
|
2016 |
|
2015 |
| ||
|
Net income (loss) available to common shareholders |
|
$ |
62,191 |
|
$ |
(2,521 |
) |
|
Add (deduct): Noncontrolling interest in Operating Partnership |
|
7,284 |
|
(314 |
) | ||
|
Real estate-related depreciation and amortization on continuing operations (a) |
|
47,459 |
|
46,031 |
| ||
|
Gain on change of control of interests |
|
(10,156 |
) |
— |
| ||
|
Deduct: Realized (gains) losses and unrealized losses on disposition of rental property, net |
|
(58,600 |
) |
(144 |
) | ||
|
Funds from operations available to common shareholders (b) |
|
$ |
48,178 |
|
$ |
43,052 |
|
|
|
|
|
|
|
| ||
|
Add: |
|
|
|
|
| ||
|
Mark-to-market interest rate swap |
|
$ |
913 |
|
$ |
— |
|
|
Core FFO |
|
$ |
49,091 |
|
$ |
43,052 |
|
|
|
|
|
|
|
| ||
|
Add (Deduct) Non-Cash Items: |
|
|
|
|
| ||
|
Straight-line rent adjustments (c) |
|
$ |
2,361 |
|
$ |
(139 |
) |
|
Amortization of market lease intangibles, net (d) |
|
169 |
|
231 |
| ||
|
Amortization of stock compensation |
|
886 |
|
411 |
| ||
|
Non real estate depreciation and amortization |
|
225 |
|
243 |
| ||
|
Amortization of debt discount/(premium) and mark-to-market, net |
|
(610 |
) |
(997 |
) | ||
|
Amortization of deferred financing costs |
|
1,169 |
|
953 |
| ||
|
Deduct: |
|
|
|
|
| ||
|
Non-incremental revenue generating capital expenditures: |
|
|
|
|
| ||
|
Building improvements |
|
(4,368 |
) |
(6,799 |
) | ||
|
Tenant improvements and leasing commissions (e) |
|
(10,538 |
) |
(5,221 |
) | ||
|
Tenant improvements and leasing commissions on space vacant for more than one year |
|
(16,461 |
) |
(7,139 |
) | ||
|
Adjusted FFO (b) |
|
$ |
21,924 |
|
$ |
24,595 |
|
|
|
|
|
|
|
| ||
|
Core FFO (calculated above) |
|
$ |
49,091 |
|
$ |
43,052 |
|
|
Deduct: |
|
|
|
|
| ||
|
Equity in earnings (loss) of unconsolidated joint ventures |
|
1,554 |
|
3,529 |
| ||
|
Equity in earnings share of depreciation and amortization |
|
(4,621 |
) |
(5,471 |
) | ||
|
Add-back: |
|
|
|
|
| ||
|
Interest expense |
|
24,993 |
|
27,215 |
| ||
|
Recurring JV distributions |
|
2,346 |
|
1,913 |
| ||
|
Income (loss) in non-controlling interest in consolidated joint ventures |
|
(706 |
) |
(490 |
) | ||
|
EBITDA |
|
$ |
72,657 |
|
$ |
69,748 |
|
|
|
|
|
|
|
| ||
|
Net debt at period end (g) |
|
$ |
2,152,866 |
|
$ |
2,088,257 |
|
|
Net debt to EBITDA (h) |
|
7.41x |
|
7.49x |
| ||
|
|
|
|
|
|
| ||
|
Diluted weighted average shares/units outstanding (f) |
|
100,315 |
|
100,266 |
| ||
|
|
|
|
|
|
| ||
|
Funds from operations per share-diluted |
|
$ |
0.48 |
|
$ |
0.43 |
|
|
Core Funds from Operations per share/unit-diluted |
|
$ |
0.49 |
|
$ |
0.43 |
|
|
Core Adjusted Funds from Operations per share/unit-diluted |
|
$ |
0.21 |
|
$ |
0.24 |
|
|
Dividends declared per common share |
|
$ |
0.15 |
|
$ |
0.15 |
|
Note: See footnotes on next page and “Information About FFO, Core FFO and AFFO” on page 40.
Mack-Cali Realty Corporation Supplemental Operating and Financial Data for the Quarter Ended March 31, 2016
Spotlight on Earnings - FFO, Core FFO & AFFO Footnotes
Footnotes to prior page:
|
(a) |
Includes the Company’s share from unconsolidated joint ventures of $4,621 and $5,471 for the three months ended March 31, 2016 and 2015, respectively. Excludes non-real estate-related depreciation and amortization of $225 and $243 for the three months ended March 31, 2016 and 2015, respectively, and depreciation expense allocable to the Company’s noncontrolling interest in consolidated joint ventures of $151 and $151 for the three months ended March 31, 2016 and 2015, respectively. |
|
(b) |
Funds from operations is calculated in accordance with the definition of FFO of the National Association of Real Estate Investment Trusts (NAREIT). See “Information About FFO, Core FFO and AFFO” on page 40. |
|
(c) |
Includes the Company’s share from unconsolidated joint ventures of $169 and $177 for the three months ended March 31, 2016 and 2015, respectively. |
|
(d) |
Includes the Company’s share from unconsolidated joint ventures of $95 and $124 for the three months ended March 31, 2016 and 2015, respectively. |
|
(e) |
Excludes expenditures for tenant spaces in properties that have not been owned by the Company for at least a year. |
|
(f) |
Calculated based on weighted average common shares outstanding, assuming redemption of Operating Partnership common units into common shares (10,509 and 11,074 shares for the three months ended March 31, 2016 and 2015, respectively), plus dilutive Common Stock Equivalents (i.e. stock options). |
|
(g) |
Net Debt calculated by taking the sum of senior unsecured notes, unsecured revolving credit facility, and mortgages, loans payable and other obligations, and deducting cash and cash equivalents, all at period end. |
|
(h) |
Equals Net Debt at period end divided by EBITDA (for quarter periods, EBIDTA annualized multiplying quarter amounts by 4). |
Mack-Cali Realty Corporation Supplemental Operating and Financial Data for the Quarter Ended March 31, 2016
Spotlight on Earnings -NAV
($’s in millions)
|
|
|
Current |
|
Cap Rate Range |
|
Value Range |
| |||||||
|
|
|
2016 Projected NOI |
|
Low |
|
High |
|
Low |
|
High |
| |||
|
Commercial |
|
|
|
|
|
|
|
|
|
|
| |||
|
NJ Waterfront - projected 2016 NOI |
|
$ |
80.9 |
|
6.00 |
% |
6.50 |
% |
$ |
1,245 |
|
$ |
1,348 |
|
|
NJ Waterfront - projected income from 2017 lease-up of vacant space |
|
9.1 |
|
6.00 |
% |
6.50 |
% |
140 |
|
152 |
| |||
|
|
|
|
|
|
|
|
|
|
|
|
| |||
|
Flex |
|
47.6 |
|
6.00 |
% |
6.50 |
% |
732 |
|
793 |
| |||
|
Core Suburban Office |
|
116.4 |
|
7.50 |
% |
8.00 |
% |
1,455 |
|
1,552 |
| |||
|
Non-core |
|
56.9 |
|
7.50 |
% |
7.50 |
% |
759 |
|
759 |
| |||
|
Office/Hotel JV interests |
|
|
|
|
|
|
|
100 |
|
125 |
| |||
|
Land - Harborside Plaza 4 |
|
|
|
|
|
|
|
84 |
|
84 |
| |||
|
CIP - Wegman’s Project |
|
|
|
|
|
|
|
50 |
|
50 |
| |||
|
Commercial Land/CIP - other |
|
|
|
|
|
|
|
20 |
|
30 |
| |||
|
Total Commercial |
|
|
|
|
|
|
|
$ |
4,585 |
|
$ |
4,893 |
| |
|
|
|
|
|
|
|
|
|
|
|
|
| |||
|
Multi-family platform (gross value before debt) |
|
|
|
|
|
|
|
1,300 |
|
1,300 |
| |||
|
|
|
|
|
|
|
|
|
|
|
|
| |||
|
Gross asset value (before debt) |
|
|
|
|
|
|
|
$ |
5,885 |
|
$ |
6,193 |
| |
|
|
|
|
|
|
|
|
|
|
|
|
| |||
|
Less: Capped value of market mgmt. fee |
|
(18.0 |
) |
7.50 |
% |
7.50 |
% |
(240 |
) |
(240 |
) | |||
|
|
|
|
|
|
|
|
|
|
|
|
| |||
|
Less Debt/Other Liabilities (as of 3-31-16) |
|
|
|
|
|
|
|
$ |
(2,338 |
) |
$ |
(2,338 |
) | |
|
|
|
|
|
|
|
|
|
|
|
|
| |||
|
Approximate Net Asset Value range |
|
|
|
|
|
|
|
$ |
3,307 |
|
$ |
3,615 |
| |
|
|
|
|
|
|
|
|
|
|
|
|
| |||
|
Approximate Net Asset Value per share range (100.3MM shares) |
|
|
|
|
|
|
|
$ |
32.97 |
|
$ |
36.04 |
| |
Mack-Cali Realty Corporation Supplemental Operating and Financial Data for the Quarter Ended March 31, 2016
Spotlight on Earnings - Guidance Assumptions
|
|
|
Current |
|
Previous |
|
|
|
|
|
2016 Guidance |
|
2016 Guidance |
|
|
|
Funds from Operations (FFO) per share |
|
$2.04 to $2.10 |
|
$2.00 to $2.10 |
|
|
|
Metric |
|
Assumptions Range ($’s in millions) |
|
Commentary |
| ||
|
Office Portfolio |
|
|
|
|
|
|
|
|
Occupancy (% leased) at YE-2016 |
|
89.0% - 91.0% |
|
88.0% - 90.0% |
|
Improving leasing activity. |
|
|
Same Store GAAP NOI Original Portfolio |
|
6.0% to 7.0% |
|
5.0% to 6.0% |
|
Expected increase in activity and reduced concessions. |
|
|
Same Store Cash NOI Original Portfolio |
|
2.5% to 3.5% |
|
1.5% to 2.5% |
|
Expected increase in activity and pushing rent. |
|
|
Same Store GAAP NOI Post Sale Portfolio |
|
8.0% to 9.0% |
|
— |
|
Reflects expected same store growth in 2016 from only the Waterfront, Core and Flex properties remaining after the sale of all Non-Core properties. |
|
|
Same Store Cash NOI Post Sale Portfolio |
|
4.0% to 5.0% |
|
— |
|
| |
|
Straight-Line Rent Adjustment |
|
$17 to $19 |
|
$16 to $18 |
|
Including approximately $2 million from projected acquisitions. |
|
|
Dispositions |
|
$700 to $800 |
|
$700 to $800 |
|
$435 million sold or under contract at approximately a 5% cap rate and the remainder at approximately 8.5% for a blend of 6.5% |
|
|
Acquisitions |
|
Up to $600 |
|
Up to $600 |
|
During the course of the year, at cash yields of 6% and GAAP yields of 8%. |
|
|
Base Building CapEx |
|
$35 to $45 |
|
$45 to $50 |
|
Includes special common area improvements for Harborside, Paramus, Parsippany and White Plains portfolios, as well as the overall office/multi-family base building cap ex. |
|
|
Non-Incremental Leasing CapEx |
|
$55 to $65 |
|
$55 to $65 |
|
Approximately 2.7 million square feet of starts at a cost of $21.50 per square-foot. |
|
|
Incremental (Space vacant more than 1 year) |
|
$40 to $50 |
|
$40 to $50 |
|
Approximately 0.9 million square feet of starts at a cost of $50.00 per square-foot. |
|
Mack-Cali Realty Corporation Supplemental Operating and Financial Data for the Quarter Ended March 31, 2016
Spotlight on Earnings - Guidance Assumptions (Continued)
|
|
|
Current |
|
Previous |
|
|
|
|
|
2016 Guidance |
|
2016 Guidance |
|
|
|
Metric |
|
Assumptions Range ($’s in millions) |
|
Commentary | ||
|
Multi-Family Portfolio |
|
|
|
|
|
|
|
Development (Consolidated) |
|
$125 to $145 |
|
$120 to $140 |
|
Equity capital required based on estimated total on-balance development spending of $270-300MM in 2016, net of construction loans. |
|
Development (J.V.) |
|
$30 to $35 |
|
$30 to $35 |
|
Equity investment in unconsolidated joint venture development projects during 2016. |
|
Acquisitions |
|
$105 |
|
$20 |
|
Cash to buy out partner’s interests in several luxury rental communities in the Boston and New Jersey Waterfront markets. |
Mack-Cali Realty Corporation Supplemental Operating and Financial Data for the Quarter Ended March 31, 2016
Spotlight on Earnings - Guidance Assumptions (Continued)
|
|
|
Current |
|
Previous |
|
|
|
|
|
|
2016 Guidance |
|
2016 Guidance |
|
|
|
|
Metric |
|
Assumptions Range ($’s in millions) |
|
Commentary |
| ||
|
Corporate |
|
|
|
|
|
|
|
|
G&A (Corporate) |
|
$34 to $37 |
|
$34 to $37 |
|
Based on staffing levels and incentive compensation likely reduced in late 2016 as we streamline our portfolio. |
|
|
G&A (Multi-family subsidiary) |
|
$8 to $10 |
|
$9 to $11 |
|
Based on staffing levels and incentive compensation. |
|
|
Interest Expense |
|
$96 to $100 |
|
$93 to $97 |
|
After retiring 5.8% bonds in January 2016, and refinancing of $63MM secured debt in April and $142MM in November. |
|
|
Unsecured Debt Financing |
|
Completed $350 million at 3.13% |
|
Completed $350 million at 3.13% |
|
Used proceeds from Unsecured Term Loan in January 2016 to retire $200MM 5.8% Bonds on January 15, 2016, and to pay down outstanding borrowings on our unsecured revolving credit facility. |
|
|
Equity Financing |
|
$350 by 6/30/16 |
|
$350 by 6/30/16 |
|
RRT entity level equity issuance by the end of second quarter 2016. |
|
The guidance and representative assumptions on this page are forward looking statements and reflect our views of current and future market conditions. Our actual results will be affected by known and unknown risks, trends, uncertainties and factors, some of which are beyond our control or ability to predict. Although we believe that the assumptions underlying our guidance are reasonable, they are not guarantees of future performance and some of them will inevitably prove to be incorrect. As a result, our actual future results can be expected to differ from our expectations, and those differences may be material.
Mack-Cali Realty Corporation Supplemental Operating and Financial Data for the Quarter Ended March 31, 2016
Spotlight on Earnings - 2016 Projected Sources & Uses of Funds
We have multiple options regarding our capital plan. Below is a summary of the potential sources and uses for 2016. This plan shows a cash available for strategic plan or reduction of debt of potentially $219 - $234 million.
|
|
|
Actuals |
|
Projected |
|
Projected |
| |||||||||
|
($’s in millions) |
|
Jan. - Mar. |
|
Apr. - Dec. |
|
Full Year 2016 |
| |||||||||
|
Sources |
|
|
|
|
|
|
|
|
|
|
| |||||
|
FFO Net of Straight-Line Rent |
|
$ |
46 |
|
$ |
134 |
– |
$ |
154 |
|
$ |
180 |
– |
$ |
200 |
|
|
Office Sales Net Proceeds |
|
95 |
|
605 |
– |
705 |
|
700 |
– |
800 |
| |||||
|
Net Proceeds from Roseland Residential Equity Raise |
|
- |
|
325 |
– |
375 |
|
325 |
– |
375 |
| |||||
|
Total Sources |
|
$ |
141 |
|
$ |
1,064 |
– |
$ |
1,234 |
|
$ |
1,205 |
– |
$ |
1,375 |
|
|
|
|
|
|
|
|
|
|
|
|
|
| |||||
|
Uses |
|
|
|
|
|
|
|
|
|
|
| |||||
|
Base Bldg CapEx |
|
$ |
4 |
|
$ |
31 |
– |
$ |
41 |
|
$ |
35 |
– |
$ |
45 |
|
|
Non-Incremental Leasing Costs |
|
11 |
|
44 |
– |
54 |
|
55 |
– |
65 |
| |||||
|
Incremental Leasing Costs |
|
16 |
|
24 |
– |
34 |
|
40 |
– |
50 |
| |||||
|
Multi-Family Acquisitions Net of Secured Debt |
|
20 |
|
85 |
– |
85 |
|
105 |
– |
105 |
| |||||
|
Office Acquisitions |
|
- |
|
500 |
– |
600 |
|
500 |
– |
600 |
| |||||
|
Development Spending Net of Secured Debt |
|
32 |
|
93 |
– |
113 |
|
125 |
– |
145 |
| |||||
|
Net Investment in Unconsolidated Joint Ventures |
|
7 |
|
23 |
– |
28 |
|
30 |
– |
35 |
| |||||
|
Dividends / Distributions |
|
15 |
|
45 |
– |
45 |
|
60 |
– |
60 |
| |||||
|
Cash Available for Strategic Plan/ Reduction of Net Debt |
|
36 |
|
219 |
– |
234 |
|
255 |
– |
270 |
| |||||
|
Total Uses |
|
$ |
141 |
|
$ |
1,064 |
– |
$ |
1,234 |
|
$ |
1,205 |
– |
$ |
1,375 |
|
Mack-Cali Realty Corporation Supplemental Operating and Financial Data for the Quarter Ended March 31, 2016
Spotlight on Earnings - Our Stats
($’s in thousands, except ratios and per share amounts)
Mack-Cali executed on its strategy to strengthen its balance sheet and improve its key financial ratios in first quarter 2016.
From 3/31/15 to 3/31/16: Total Debt/Total Market Cap decreased 2.9 basis points, from 51.5 percent to 48.6 percent; Interest Coverage increased 0.4x, from 2.4x to 2.8x; and Fixed Charge Coverage increased 0.2x, from 2.2x to 2.4x. Core FFO per Diluted Share increased from $0.43 to $0.49, and the FFO Payout Ratio decreased from 35 percent to 31 percent. It was a positive quarter for Mack-Cali as demonstrated by favorable improvements in many of these key financial metrics.
|
|
|
03/31/16 |
|
12/31/15 |
|
09/30/15 |
|
06/30/15 |
|
03/31/15 |
|
|
($’s in thousands, except ratios) |
|
|
|
|
|
|
|
|
|
|
|
|
Market Value of Equity (a) |
|
2,410,679 |
|
2,394,512 |
|
1,944,543 |
|
1,901,178 |
|
1,985,839 |
|
|
Total Debt, Net |
|
2,269,287 |
|
2,154,920 |
|
2,043,592 |
|
2,034,819 |
|
2,107,572 |
|
|
Total Market Capitalization |
|
4,679,966 |
|
4,549,432 |
|
3,988,135 |
|
3,935,997 |
|
4,093,411 |
|
|
|
|
|
|
|
|
|
|
|
|
|
|
|
Total Debt/ Total Market Capitalization |
|
48.47 |
% |
47.37 |
% |
51.24 |
% |
51.70 |
% |
51.49 |
% |
|
Total Debt/ Total Book Capitalization |
|
53.67 |
% |
53.03 |
% |
51.07 |
% |
48.99 |
% |
50.19 |
% |
|
Total Debt/ Total Undepreciated Assets |
|
40.44 |
% |
38.98 |
% |
37.59 |
% |
36.22 |
% |
37.53 |
% |
|
Secured Debt/ Total Undepreciated |
|
13.68 |
% |
13.23 |
% |
13.61 |
% |
13.68 |
% |
14.20 |
% |
|
|
|
|
|
|
|
|
|
|
|
|
|
|
Capitalized Interest |
|
4,561 |
|
4,473 |
|
4,356 |
|
3,781 |
|
3,607 |
|
|
|
|
|
|
|
|
|
|
|
|
|
|
|
Portfolio Size: |
|
|
|
|
|
|
|
|
|
|
|
|
Consolidated Properties |
|
222 |
|
223 |
|
222 |
|
227 |
|
230 |
|
|
Consolidated Total Commercial Square Footage |
|
23,974,930 |
|
24,211,880 |
|
24,015,752 |
|
24,837,821 |
|
25,266,990 |
|
|
Commercial Sq. Ft. Leased at End of Period (c) |
|
87.2 |
% |
86.2 |
% |
85.8 |
% |
82.3 |
% |
84.3 |
% |
|
|
|
|
|
|
|
|
|
|
|
|
|
|
Shares and Units: |
|
|
|
|
|
|
|
|
|
|
|
|
Common Shares Outstanding |
|
89,638,312 |
|
89,583,950 |
|
89,310,243 |
|
89,195,529 |
|
89,127,942 |
|
|
Common Units Outstanding |
|
10,499,844 |
|
10,516,844 |
|
10,790,142 |
|
11,012,069 |
|
11,036,898 |
|
|
Combined Shares and Units |
|
100,138,156 |
|
100,100,794 |
|
100,100,385 |
|
100,207,598 |
|
100,164,840 |
|
|
Weighted Average- Diluted (b) |
|
100,315,467 |
|
100,180,068 |
|
100,172,220 |
|
100,314,310 |
|
100,265,509 |
|
|
|
|
|
|
|
|
|
|
|
|
|
|
|
Common Share Price ($’s): |
|
|
|
|
|
|
|
|
|
|
|
|
At the end of the period |
|
23.50 |
|
23.35 |
|
18.88 |
|
18.43 |
|
19.28 |
|
|
High during period |
|
23.71 |
|
24.26 |
|
21.12 |
|
19.73 |
|
20.11 |
|
|
Low during period |
|
17.35 |
|
18.67 |
|
18.01 |
|
16.85 |
|
18.01 |
|
|
|
|
Three Months Ended |
|
|
|
|
|
|
| ||
|
|
|
03/31/16 |
|
03/31/15 |
|
|
|
|
|
|
|
|
Net Debt to EBITDA Annualized |
|
7.41x |
|
7.49x |
|
|
|
|
|
|
|
|
Interest Coverage Ratio |
|
2.93 |
|
2.58 |
|
|
|
|
|
|
|
|
Fixed Charge Coverage Ratio |
|
2.35 |
|
2.20 |
|
|
|
|
|
|
|
|
Earnings per Share—diluted |
|
0.69 |
|
(0.03 |
) |
|
|
|
|
|
|
|
FFO per Share—diluted (a) |
|
0.48 |
|
0.43 |
|
|
|
|
|
|
|
|
Core FFO per Share |
|
0.49 |
|
0.43 |
|
|
|
|
|
|
|
|
Adjusted FFO per share |
|
0.21 |
|
0.24 |
|
|
|
|
|
|
|
|
Dividends Declared per Share |
|
0.15 |
|
0.15 |
|
|
|
|
|
|
|
|
FFO Payout Ratio—diluted (a) |
|
31.23 |
% |
34.93 |
% |
|
|
|
|
|
|
(a) Includes any outstanding preferred units presented on a converted basis into common units and noncontrolling interests in consolidated joint ventures.
(b) Calculated based on shares and units included in basic per share/unit computation, plus dilutive Common Stock Equivalents (i.e. convertible preferred units, options and warrants).
(c) Percentage leased includes leases in effect as of the period end date, some of which have commencement dates in the future and leases that expire at the period end date. Reflects square feet leased at the Company’s consolidated in-service portfolio, excluding in-service properties in lease up (if any).
(d) Funds from operations (“FFO”) is calculated in accordance with the definition of the National Association of Real Estate Investment Trusts (NAREIT). See “Information About FFO, Core FFO and AFFO” on page 40.
Mack-Cali Realty Corporation Supplemental Operating and Financial Data for the Quarter Ended March 31, 2016
Spotlight on Earnings - Same Store
(Consolidated Commercial In-Service Portfolio)
(dollars in thousands)
The current quarter same store results for our commercial portfolio showed very positive momentum, benefiting from solid revenue growth, and a very favorable quarter of property expense savings from the mild weather to start 2016
|
|
|
For the three months ended |
|
|
|
|
| |||||
|
|
|
March 31, |
|
|
|
% |
| |||||
|
|
|
2016 |
|
2015 |
|
Change |
|
Change |
| |||
|
|
|
|
|
|
|
|
|
|
| |||
|
Total Property Revenues |
|
$ |
132,887 |
|
$ |
131,411 |
|
$ |
1,476 |
|
1.1 |
|
|
|
|
|
|
|
|
|
|
|
| |||
|
Real Estate Taxes |
|
20,503 |
|
20,565 |
|
(62 |
) |
(0.3 |
) | |||
|
Utilities |
|
12,586 |
|
16,509 |
|
(3,923 |
) |
(23.8 |
) | |||
|
Operating Services |
|
23,618 |
|
25,927 |
|
(2,309 |
) |
(8.9 |
) | |||
|
Total Property Expenses: |
|
56,707 |
|
63,001 |
|
(6,294 |
) |
(10.0 |
) | |||
|
|
|
|
|
|
|
|
|
|
| |||
|
GAAP Net Operating Income |
|
76,180 |
|
68,410 |
|
7,770 |
|
11.4 |
| |||
|
|
|
|
|
|
|
|
|
|
| |||
|
Less: straight-lining of rents adj. |
|
2,170 |
|
(325 |
) |
2,495 |
|
767.7 |
| |||
|
|
|
|
|
|
|
|
|
|
| |||
|
Net Operating Income |
|
$ |
74,010 |
|
$ |
68,735 |
|
$ |
5,275 |
|
7.7 |
|
|
|
|
|
|
|
|
|
|
|
| |||
|
Average Percentage Leased |
|
87.2 |
% |
84.7 |
% |
|
|
|
| |||
|
|
|
|
|
|
|
|
|
|
| |||
|
Total Properties: |
|
214 |
|
|
|
|
|
|
| |||
|
|
|
|
|
|
|
|
|
|
| |||
|
Total Square Footage: |
|
23,778,802 |
|
|
|
|
|
|
| |||
Mack-Cali Realty Corporation Supplemental Operating and Financial Data for the Quarter Ended March 31, 2016
Spotlight on Financials - Income Statements
(dollars in thousands, except per share amounts) (unaudited)
|
|
|
Three Months Ended |
| ||||
|
|
|
March 31, |
| ||||
|
REVENUES |
|
2016 |
|
2015 |
| ||
|
Base rents |
|
$ |
126,387 |
|
$ |
123,793 |
|
|
Escalations and recoveries from tenants |
|
14,961 |
|
18,399 |
| ||
|
Real estate services |
|
6,812 |
|
7,644 |
| ||
|
Parking income |
|
3,156 |
|
2,542 |
| ||
|
Other income |
|
1,607 |
|
1,337 |
| ||
|
Total revenues |
|
152,923 |
|
153,715 |
| ||
|
|
|
|
|
|
| ||
|
EXPENSES |
|
|
|
|
| ||
|
Real estate taxes |
|
23,226 |
|
22,452 |
| ||
|
Utilities |
|
13,578 |
|
17,575 |
| ||
|
Operating services |
|
26,732 |
|
28,228 |
| ||
|
Real estate services expenses |
|
6,846 |
|
6,639 |
| ||
|
General and administrative |
|
12,249 |
|
11,011 |
| ||
|
Depreciation and amortization |
|
43,063 |
|
40,802 |
| ||
|
Total expenses |
|
125,694 |
|
126,707 |
| ||
|
Operating income |
|
27,229 |
|
27,008 |
| ||
|
|
|
|
|
|
| ||
|
OTHER (EXPENSE) INCOME |
|
|
|
|
| ||
|
Interest expense |
|
(24,993 |
) |
(27,215 |
) | ||
|
Interest and other investment income (loss) |
|
(669 |
) |
267 |
| ||
|
Equity in earnings (loss) of unconsolidated joint ventures |
|
(1,554 |
) |
(3,529 |
) | ||
|
Gain on change of control of interests |
|
10,156 |
|
— |
| ||
|
Realized gains (losses) on disposition of rental property, net |
|
58,600 |
|
144 |
| ||
|
Total other (expense) income |
|
41,540 |
|
(30,333 |
) | ||
|
Net income (loss) |
|
68,769 |
|
(3,325 |
) | ||
|
Noncontrolling interest in consolidated joint ventures |
|
706 |
|
490 |
| ||
|
Noncontrolling interest in Operating Partnership |
|
(7,284 |
) |
314 |
| ||
|
Net income (loss) available to common shareholders |
|
$ |
62,191 |
|
$ |
(2,521 |
) |
|
|
|
|
|
|
| ||
|
Basic earnings per common share: |
|
|
|
|
| ||
|
Net income (loss) available to common shareholders |
|
$ |
0.69 |
|
$ |
(0.03 |
) |
|
|
|
|
|
|
| ||
|
Diluted earnings per common share: |
|
|
|
|
| ||
|
Net income (loss) available to common shareholders |
|
$ |
0.69 |
|
$ |
(0.03 |
) |
|
|
|
|
|
|
| ||
|
Basic weighted average shares outstanding |
|
89,721 |
|
89,192 |
| ||
|
|
|
|
|
|
| ||
|
Diluted weighted average shares outstanding |
|
100,315 |
|
100,266 |
| ||
Mack-Cali Realty Corporation Supplemental Operating and Financial Data for the Quarter Ended March 31, 2016
Spotlight on Financials - Balance Sheets
(dollars in thousands, except per share amounts) (unaudited)
|
|
|
March 31, |
|
December 31, |
| ||
|
Assets |
|
2016 |
|
2015 |
| ||
|
Rental property |
|
|
|
|
| ||
|
Land and leasehold interests |
|
$ |
684,960 |
|
$ |
735,696 |
|
|
Buildings and improvements |
|
3,557,813 |
|
3,648,238 |
| ||
|
Tenant improvements |
|
353,842 |
|
408,617 |
| ||
|
Furniture, fixtures and equipment |
|
16,576 |
|
15,167 |
| ||
|
|
|
4,613,191 |
|
4,807,718 |
| ||
|
Less — accumulated depreciation and amortization |
|
(1,382,962 |
) |
(1,464,482 |
) | ||
|
|
|
3,230,229 |
|
3,343,236 |
| ||
|
Rental property held for sale, net |
|
200,044 |
|
— |
| ||
|
Net investment in rental property |
|
3,430,273 |
|
3,343,236 |
| ||
|
Cash and cash equivalents |
|
116,421 |
|
37,077 |
| ||
|
Investments in unconsolidated joint ventures |
|
303,647 |
|
303,457 |
| ||
|
Unbilled rents receivable, net |
|
120,035 |
|
120,246 |
| ||
|
Deferred charges, goodwill and other assets, net |
|
220,997 |
|
203,850 |
| ||
|
Restricted cash |
|
27,566 |
|
35,343 |
| ||
|
Accounts receivable, net of allowance for doubtful accounts of $602 and $1,407 |
|
9,511 |
|
10,754 |
| ||
|
|
|
|
|
|
| ||
|
Total assets |
|
$ |
4,228,450 |
|
$ |
4,053,963 |
|
|
|
|
|
|
|
| ||
|
Liabilities and Equity |
|
|
|
|
| ||
|
Senior unsecured notes, net |
|
$ |
1,064,363 |
|
$ |
1,263,782 |
|
|
Unsecured term loan, net |
|
347,351 |
|
— |
| ||
|
Revolving credit facility |
|
90,000 |
|
155,000 |
| ||
|
Mortgages, loans payable and other obligations, net |
|
767,573 |
|
726,611 |
| ||
|
Dividends and distributions payable |
|
15,047 |
|
15,582 |
| ||
|
Accounts payable, accrued expenses and other liabilities |
|
137,030 |
|
135,057 |
| ||
|
Rents received in advance and security deposits |
|
50,109 |
|
49,739 |
| ||
|
Accrued interest payable |
|
23,994 |
|
24,484 |
| ||
|
Total liabilities |
|
2,495,467 |
|
2,370,255 |
| ||
|
Commitments and contingencies |
|
|
|
|
| ||
|
|
|
|
|
|
| ||
|
Equity: |
|
|
|
|
| ||
|
Mack-Cali Realty Corporation stockholders’ equity: |
|
|
|
|
| ||
|
Common stock, $0.01 par value, 190,000,000 shares authorized, 89,638,312 and 89,583,950 shares outstanding |
|
896 |
|
896 |
| ||
|
Additional paid-in capital |
|
2,571,509 |
|
2,570,392 |
| ||
|
Dividends in excess of net earnings |
|
(1,066,867 |
) |
(1,115,612 |
) | ||
|
Accumulated other comprehensive loss |
|
(5,675 |
) |
— |
| ||
|
Total Mack-Cali Realty Corporation stockholders’ equity |
|
1,499,863 |
|
1,455,676 |
| ||
|
|
|
|
|
|
| ||
|
Noncontrolling interests in subsidiaries: |
|
|
|
|
| ||
|
Operating Partnership |
|
175,688 |
|
170,891 |
| ||
|
Consolidated joint ventures |
|
57,432 |
|
57,141 |
| ||
|
Total noncontrolling interests in subsidiaries |
|
233,120 |
|
228,032 |
| ||
|
|
|
|
|
|
| ||
|
Total equity |
|
1,732,983 |
|
1,683,708 |
| ||
|
|
|
|
|
|
| ||
|
Total liabilities and equity |
|
$ |
4,228,450 |
|
$ |
4,053,963 |
|
Mack-Cali Realty Corporation Supplemental Operating and Financial Data for the Quarter Ended March 31, 2016
Spotlight on Financials - Debt Summary
(as of March 31, 2016)
As of March 31, 2016, the Company had minimal floating rate debt of only $197 million, or under nine percent, of its total debt. The Company will be extending maturities on its obligations whenever possible while reducing interest costs.
Debt Breakdown
(dollars in thousands)
|
|
|
|
|
% |
|
Weighted Average |
|
Weighted Average |
| |
|
|
|
Balance |
|
of Total |
|
Interest Rate (a) |
|
Maturity in Years |
| |
|
Fixed Rate Unsecured Debt and Other Obligations |
|
$ |
1,425,000 |
|
62.31 |
% |
4.32 |
% |
4.22 |
|
|
Fixed Rate Secured Debt |
|
664,638 |
|
29.06 |
% |
6.78 |
% |
2.83 |
| |
|
Variable Rate Secured Debt |
|
107,603 |
|
4.70 |
% |
4.79 |
% |
1.24 |
| |
|
Variable Rate Unsecured Debt |
|
90,000 |
|
3.93 |
% |
1.74 |
% |
1.33 |
| |
|
Totals/Weighted Average: |
|
$ |
2,287,241 |
|
100.00 |
% |
4.95 |
%(b) |
3.56 |
|
|
Adjustment for unamortized debt discount |
|
(6,094 |
) |
|
|
|
|
|
| |
|
Unamortized deferred financing costs |
|
(11,860 |
) |
|
|
|
|
|
| |
|
Total Debt, net |
|
$ |
2,269,287 |
|
|
|
|
|
|
|
Future Repayments
(dollars in thousands)
|
|
|
|
|
|
|
|
|
Weighted Average |
| |||
|
|
|
Scheduled |
|
Principal |
|
|
|
Interest Rate of |
| |||
|
Period |
|
Amortization |
|
Maturities |
|
Total |
|
Future Repayments (a) |
| |||
|
April 1 to December 31, 2016 |
|
$ |
6,037 |
|
$ |
171,504 |
|
$ |
177,541 |
|
8.56 |
% |
|
2017 (b) |
|
7,275 |
|
497,254 |
|
504,529 |
|
3.65 |
% | |||
|
2018 |
|
7,311 |
|
231,536 |
|
238,847 |
|
6.68 |
% | |||
|
2019 |
|
1,970 |
|
681,567 |
|
683,537 |
|
5.24 |
% | |||
|
2020 |
|
1,977 |
|
— |
|
1,977 |
|
4.05 |
% | |||
|
Thereafter |
|
8,862 |
|
671,948 |
|
680,810 |
|
4.09 |
% | |||
|
Sub-total |
|
33,432 |
|
2,253,809 |
|
2,287,241 |
|
|
| |||
|
Adjustment for unamortized debt discount/premium and mark-to-market, net, as of March 31, 2016 |
|
(6,094 |
) |
— |
|
(6,094 |
) |
|
| |||
|
Unamortized deferred financing costs |
|
(11,860 |
) |
— |
|
(11,860 |
) |
|
| |||
|
|
|
|
|
|
|
|
|
|
| |||
|
Totals/Weighted Average: |
|
$ |
15,478 |
|
$ |
2,253,809 |
|
$ |
2,269,287 |
|
4.95 |
%(c) |
|
(a) |
The actual weighted average LIBOR rate for the Company’s outstanding variable rate debt was 0.44 percent as of March 31, 2016, plus the applicable spread. |
|
(b) |
Includes outstanding borrowings of the Company’s unsecured revolving credit facility of $90 million which matures in 2017 with two six-month extension options with the payment of a fee. |
|
(c) |
Excludes amortized deferred financing costs pertaining to the Company’s unsecured revolving credit facility which amounted to $0.8 million for the three months ended March 31, 2016. |
Mack-Cali Realty Corporation Supplemental Operating and Financial Data for the Quarter Ended March 31, 2016
Spotlight on Portfolio - Property Types
(as of March 31, 2016)
|
|
|
|
|
# of |
|
Commercial |
|
Garage |
|
|
|
|
# of |
|
Apartment |
|
Square |
|
Parking |
|
|
Property |
|
Properties |
|
Homes |
|
Feet |
|
Spaces |
|
|
MULTI-FAMILY RENTAL PORTFOLIO |
|
|
|
|
|
|
|
|
|
|
Stabilized Operating Communities: |
|
|
|
|
|
|
|
|
|
|
Consolidated Properties |
|
7 |
|
1,672 |
|
|
|
1,586 |
|
|
Unconsolidated Joint Venture Interests: |
|
|
|
|
|
|
|
|
|
|
Participating JVs |
|
2 |
|
939 |
|
|
|
|
|
|
Subordinated Interests |
|
9 |
|
2,655 |
|
|
|
|
|
|
Total Stabilized Operating Communities-included in Property Count: |
|
18 |
|
5,266 |
|
|
|
1,586 |
|
|
|
|
|
|
|
|
|
|
|
|
|
Communities in Lease-Up: |
|
|
|
|
|
|
|
|
|
|
Unconsolidated Joint Venture Interests: |
|
|
|
|
|
|
|
|
|
|
Participating JVs |
|
1 |
|
378 |
|
|
|
|
|
|
Total Properties in Lease-Up-Multi-Family-included in Property Count: |
|
1 |
|
378 |
|
|
|
|
|
|
|
|
|
|
|
|
|
|
|
|
|
Development Communities: |
|
|
|
|
|
|
|
|
|
|
Consolidated Properties |
|
7 |
|
1,789 |
|
|
|
|
|
|
Unconsolidated Joint Venture Interests: |
|
|
|
|
|
|
|
|
|
|
Participating JVs |
|
2 |
|
1,074 |
|
|
|
|
|
|
Subordinated Interests |
|
— |
|
— |
|
|
|
|
|
|
Total Development Communities-Multi-Family: |
|
9 |
|
2,863 |
|
|
|
|
|
|
|
|
|
|
|
|
|
|
|
|
|
Total Land Holdings/Pre-Development and Repurposing-Multi-Family: |
|
n/a |
|
10,849 |
|
|
|
|
|
|
|
|
|
|
|
|
|
|
|
|
|
OFFICE PORTFOLIO |
|
|
|
|
|
|
|
|
|
|
Stabilized Operating Properties: |
|
|
|
|
|
|
|
|
|
|
Consolidated Properties |
|
215 |
|
|
|
23,974,930 |
|
|
|
|
Unconsolidated Joint Venture Interests: |
|
|
|
|
|
|
|
|
|
|
Participating JVs (incl. 350-room hotel) |
|
8 |
|
|
|
1,645,306 |
|
|
|
|
Subordinated Joint Ventures |
|
31 |
|
|
|
4,033,049 |
|
|
|
|
Total Operating Properties-included in Property Count: |
|
254 |
|
|
|
29,653,285 |
|
|
|
|
|
|
|
|
|
|
|
|
|
|
|
Total Land Holdings/Pre-Development-Office |
|
— |
|
|
|
5,348,750 |
|
|
|
Mack-Cali Realty Corporation Supplemental Operating and Financial Data for the Quarter Ended March 31, 2016
Spotlight on Portfolio - Commercial Tenant Size
The Company’s commercial portfolio continues to benefit from a consistent balance in its range of tenant sizes.
|
|
|
|
|
|
|
|
|
|
|
Annualized |
|
Percentage of |
|
|
|
|
Number |
|
Percentage of |
|
|
|
Percentage of |
|
Base Rental |
|
Annualized |
|
|
|
|
of |
|
Total Number |
|
Rentable |
|
Rentable Area |
|
Revenue |
|
Base Rental |
|
|
Square Feet Leased |
|
Tenants (c) |
|
of Tenants (%) |
|
Area (b) (c) |
|
(%) |
|
($) (a) (b) (c) |
|
Revenue (%) |
|
|
2,500 or less |
|
323 |
|
21.8 |
|
477,471 |
|
2.3 |
|
11,865,407 |
|
2.4 |
|
|
2,501 - 10,000 |
|
672 |
|
45.3 |
|
3,538,467 |
|
17.3 |
|
78,792,735 |
|
15.9 |
|
|
10,001 - 20,000 |
|
259 |
|
17.4 |
|
3,686,214 |
|
18.0 |
|
78,447,039 |
|
15.8 |
|
|
20,001 - 40,000 |
|
121 |
|
8.1 |
|
3,367,778 |
|
16.4 |
|
77,255,073 |
|
15.5 |
|
|
40,001 - 100,000 |
|
88 |
|
5.9 |
|
5,548,766 |
|
27.0 |
|
138,762,439 |
|
27.9 |
|
|
Greater than 100,000 |
|
22 |
|
1.5 |
|
3,893,016 |
|
19.0 |
|
111,977,586 |
|
22.5 |
|
|
|
|
|
|
|
|
|
|
|
|
|
|
|
|
|
Totals |
|
1,485 |
|
100.0 |
|
20,511,712 |
|
100.0 |
|
497,100,279 |
|
100.0 |
|
|
(a) |
Annualized base rental revenue is based on actual March 2016 billings times 12. For leases whose rent commences after April 1, 2016, annualized base rental revenue is based on the first full month’s billing times 12. As annualized base rental revenue is not derived from historical GAAP results, historical results may differ from those set forth above. |
|
(b) |
Includes leases in effect as of the period end date, some of which have commencement dates in the future, and leases expiring March 31, 2016 aggregating 159,415 square feet and representing annualized base rent of $3,827,385 for which no new leases were signed. |
|
(c) |
Includes office, office/flex, industrial/warehouse and stand-alone retail tenants only. Excludes leases for amenity, retail, parking and month-to-month tenants. Some tenants have multiple leases. |
Mack-Cali Realty Corporation Supplemental Operating and Financial Data for the Quarter Ended March 31, 2016
Details on Leasing - Quarter Rollforward
(for the three months ended March 31, 2016)
Consolidated Commercial In-Service Portfolio
|
|
|
|
|
|
|
LEASING ACTIVITY |
|
|
|
|
|
Market |
|
Fav/ |
| ||||
|
Business Line |
|
Pct. Leased |
|
Leased Sq. Ft. |
|
Expiring/Adjustment |
|
Incoming |
|
Net Leasing |
|
Sq. Ft. Leased |
|
Pct. Leased |
|
Pct. Leased (e) |
|
(Unfav) |
|
|
Market/Submarket |
|
12/31/15 |
|
Acquired/Disposed (a) |
|
Sq. Ft. (b) |
|
Sq. Ft. |
|
Activity |
|
3/31/16 (c) |
|
3/31/16 (d) |
|
3/31/16 |
|
to Market |
|
|
CORE |
|
|
|
|
|
|
|
|
|
|
|
|
|
|
|
|
|
|
|
|
Northern NJ |
|
|
|
|
|
|
|
|
|
|
|
|
|
|
|
|
|
|
|
|
Bergen Route 4 East |
|
100.0 |
% |
— |
|
— |
|
— |
|
— |
|
239,680 |
|
100.0 |
% |
87.1 |
% |
12.9 |
% |
|
Bergen Route 17/GSP |
|
83.7 |
% |
— |
|
(5,965 |
) |
2,800 |
|
(3,165 |
) |
1,490,802 |
|
83.5 |
% |
78.4 |
% |
5.1 |
% |
|
Roseland/Short Hills |
|
96.0 |
% |
— |
|
— |
|
— |
|
— |
|
507,993 |
|
96.0 |
% |
83.7 |
% |
12.3 |
% |
|
GW Bridge |
|
93.7 |
% |
— |
|
(4,192 |
) |
— |
|
(4,192 |
) |
246,996 |
|
92.2 |
% |
87.0 |
% |
5.2 |
% |
|
Morris Route 10/24 |
|
91.5 |
% |
— |
|
(30,765 |
) |
30,765 |
|
— |
|
234,810 |
|
91.5 |
% |
71.0 |
% |
20.5 |
% |
|
Parsippany |
|
82.1 |
% |
— |
|
(93,371 |
) |
150,063 |
|
56,692 |
|
1,718,407 |
|
84.9 |
% |
77.1 |
% |
7.8 |
% |
|
Suburban Passaic |
|
86.4 |
% |
— |
|
(2,295 |
) |
4,358 |
|
2,063 |
|
50,505 |
|
90.1 |
% |
70.2 |
% |
19.9 |
% |
|
Central NJ |
|
|
|
|
|
|
|
|
|
|
|
|
|
|
|
|
|
|
|
|
Clark & Cranford |
|
83.9 |
% |
— |
|
(40,332 |
) |
45,942 |
|
5,610 |
|
672,939 |
|
84.6 |
% |
77.5 |
% |
7.1 |
% |
|
Mercer Southern |
|
94.6 |
% |
— |
|
— |
|
— |
|
— |
|
268,747 |
|
94.6 |
% |
88.8 |
% |
5.8 |
% |
|
Monmouth County |
|
97.1 |
% |
— |
|
— |
|
167 |
|
167 |
|
1,058,759 |
|
97.1 |
% |
87.9 |
% |
9.2 |
% |
|
Princeton |
|
90.4 |
% |
— |
|
(3,724 |
) |
5,215 |
|
1,491 |
|
312,684 |
|
90.9 |
% |
88.0 |
% |
2.9 |
% |
|
The Brunswicks |
|
100.0 |
% |
— |
|
— |
|
— |
|
— |
|
40,000 |
|
100.0 |
% |
82.7 |
% |
17.3 |
% |
|
Woodbridge/Edison |
|
98.3 |
% |
— |
|
(72,382 |
) |
72,382 |
|
— |
|
581,889 |
|
98.3 |
% |
84.6 |
% |
13.7 |
% |
|
Westchester Co., NY |
|
|
|
|
|
|
|
|
|
|
|
|
|
|
|
|
|
|
|
|
Elmsford |
|
91.7 |
% |
— |
|
(390 |
) |
390 |
|
— |
|
55,019 |
|
91.7 |
% |
85.4 |
% |
6.3 |
% |
|
Hawthorne |
|
93.6 |
% |
— |
|
(28,007 |
) |
28,007 |
|
— |
|
228,784 |
|
93.6 |
% |
94.6 |
% |
(1.0 |
)% |
|
White Plains CBD |
|
82.8 |
% |
— |
|
(8,413 |
) |
9,334 |
|
921 |
|
516,063 |
|
82.9 |
% |
81.1 |
% |
1.8 |
% |
|
Yonkers |
|
100.0 |
% |
— |
|
— |
|
— |
|
— |
|
170,000 |
|
100.0 |
% |
88.0 |
% |
12.0 |
% |
|
CORE Totals |
|
88.7 |
% |
— |
|
(289,836 |
) |
349,423 |
|
59,587 |
|
8,394,077 |
|
89.3 |
% |
82.0 |
% |
7.3 |
% |
|
|
|
|
|
|
|
|
|
|
|
|
|
|
|
|
|
|
|
|
|
|
WATERFRONT |
|
|
|
|
|
|
|
|
|
|
|
|
|
|
|
|
|
|
|
|
Hudson Waterfront |
|
86.7 |
% |
— |
|
(372,830 |
) |
551,674 |
|
178,844 |
|
3,923,074 |
|
90.9 |
% |
88.6 |
% |
2.3 |
% |
|
WATERFRONT Totals |
|
86.7 |
% |
— |
|
(372,830 |
) |
551,674 |
|
178,844 |
|
3,923,074 |
|
90.9 |
% |
88.6 |
% |
2.3 |
% |
|
|
|
|
|
|
|
|
|
|
|
|
|
|
|
|
|
|
|
|
|
|
FLEX |
|
|
|
|
|
|
|
|
|
|
|
|
|
|
|
|
|
|
|
|
Northern NJ |
|
|
|
|
|
|
|
|
|
|
|
|
|
|
|
|
|
|
|
|
Hudson Waterfront |
|
61.2 |
% |
— |
|
(8,736 |
) |
4,400 |
|
(4,336 |
) |
5,900 |
|
35.3 |
% |
n/a |
|
n/a |
|
|
Suburban Passaic |
|
91.0 |
% |
— |
|
(21,230 |
) |
13,630 |
|
(7,600 |
) |
395,689 |
|
89.3 |
% |
n/a |
|
n/a |
|
|
Central NJ |
|
|
|
|
|
|
|
|
|
|
|
|
|
n/a |
|
n/a |
|
|
|
|
Clark & Cranford |
|
68.7 |
% |
— |
|
(1,060 |
) |
— |
|
(1,060 |
) |
3,014 |
|
50.8 |
% |
n/a |
|
n/a |
|
|
Mercer Southern |
|
86.0 |
% |
— |
|
(5,002 |
) |
3,725 |
|
(1,277 |
) |
144,942 |
|
85.2 |
% |
n/a |
|
n/a |
|
|
Monmouth County |
|
88.1 |
% |
— |
|
(12,201 |
) |
12,241 |
|
40 |
|
259,413 |
|
88.1 |
% |
n/a |
|
n/a |
|
|
Westchester Co., NY |
|
|
|
|
|
|
|
|
|
|
|
|
|
n/a |
|
n/a |
|
|
|
|
Elmsford |
|
94.8 |
% |
— |
|
(58,391 |
) |
63,661 |
|
5,270 |
|
1,560,189 |
|
95.2 |
% |
n/a |
|
n/a |
|
|
Hawthorne |
|
91.1 |
% |
— |
|
(15,555 |
) |
4,575 |
|
(10,980 |
) |
459,649 |
|
89.0 |
% |
n/a |
|
n/a |
|
|
Yonkers |
|
93.2 |
% |
— |
|
(28,430 |
) |
28,430 |
|
— |
|
548,132 |
|
93.2 |
% |
n/a |
|
n/a |
|
|
Burlington Co., NJ |
|
89.3 |
% |
— |
|
(19,200 |
) |
25,000 |
|
5,800 |
|
1,131,222 |
|
89.8 |
% |
n/a |
|
n/a |
|
|
Stamford, CT Non-CBD |
|
96.3 |
% |
— |
|
— |
|
— |
|
— |
|
262,928 |
|
96.3 |
% |
n/a |
|
n/a |
|
|
FLEX Totals |
|
91.9 |
% |
— |
|
(169,805 |
) |
155,662 |
|
(14,143 |
) |
4,771,078 |
|
91.6 |
% |
|
|
|
|
Schedules continue on next page.
Mack-Cali Realty Corporation Supplemental Operating and Financial Data for the Quarter Ended March 31, 2016
Details on Leasing - Quarter Rollforward (continued)
(for the three months ended March 31, 2016)
Consolidated Commercial In-Service Portfolio (continued)
|
|
|
|
|
|
|
LEASING ACTIVITY |
|
|
|
|
|
Market |
|
Fav/ |
| ||||
|
Business Line |
|
Pct. Leased |
|
Leased Sq. Ft. |
|
Expiring/Adjustment |
|
Incoming |
|
Net Leasing |
|
Sq. Ft. Leased |
|
Pct. Leased |
|
Pct. Leased (e) |
|
(Unfav) |
|
|
Market/Submarket |
|
12/31/15 |
|
Acquired/Disposed (a) |
|
Sq. Ft. (b) |
|
Sq. Ft. |
|
Activity |
|
3/31/16 (c) |
|
3/31/16 (d) |
|
3/31/16 |
|
to Market |
|
|
NON-CORE |
|
|
|
|
|
|
|
|
|
|
|
|
|
|
|
|
|
|
|
|
Northern NJ |
|
|
|
|
|
|
|
|
|
|
|
|
|
|
|
|
|
|
|
|
Bergen Route 17S |
|
46.2 |
% |
— |
|
— |
|
— |
|
— |
|
24,009 |
|
46.2 |
% |
80.1 |
% |
(33.9 |
)% |
|
Bergen Route 17/GSP |
|
72.7 |
% |
— |
|
(12,612 |
) |
11,288 |
|
(1,324 |
) |
340,971 |
|
72.4 |
% |
78.4 |
% |
(6.0 |
)% |
|
Roseland/Short Hills |
|
68.5 |
% |
— |
|
(7,116 |
) |
— |
|
(7,116 |
) |
648,350 |
|
67.7 |
% |
83.7 |
% |
(16.0 |
)% |
|
Parsippany |
|
80.3 |
% |
— |
|
(5,685 |
) |
7,010 |
|
1,325 |
|
622,961 |
|
80.5 |
% |
77.1 |
% |
3.4 |
% |
|
Central NJ |
|
|
|
|
|
|
|
|
|
|
|
|
|
|
|
|
|
|
|
|
Middlesex South/8A |
|
59.2 |
% |
— |
|
— |
|
— |
|
— |
|
199,533 |
|
74.0 |
% |
87.9 |
% |
(13.9 |
)% |
|
Monmouth County |
|
76.1 |
% |
— |
|
(20,874 |
) |
20,874 |
|
— |
|
179,539 |
|
76.1 |
% |
87.9 |
% |
(11.8 |
)% |
|
Somerset Route 78 |
|
89.6 |
% |
— |
|
(18,278 |
) |
2,994 |
|
(15,284 |
) |
438,160 |
|
86.6 |
% |
85.1 |
% |
1.5 |
% |
|
Union Route 78 |
|
49.6 |
% |
— |
|
— |
|
— |
|
— |
|
39,657 |
|
49.6 |
% |
86.1 |
% |
(36.5 |
)% |
|
Westchester Co., NY |
|
|
|
|
|
|
|
|
|
|
|
|
|
|
|
|
|
|
|
|
Tarrytown |
|
100.0 |
% |
— |
|
— |
|
— |
|
— |
|
9,300 |
|
100.0 |
% |
79.7 |
% |
20.3 |
% |
|
White Plains CBD |
|
57.6 |
% |
— |
|
— |
|
— |
|
— |
|
26,343 |
|
57.6 |
% |
81.1 |
% |
(23.5 |
)% |
|
NYC - Downtown |
|
100.0 |
% |
— |
|
— |
|
— |
|
— |
|
524,476 |
|
100.0 |
% |
90.5 |
% |
9.5 |
% |
|
Washington DC/MD |
|
|
|
|
|
|
|
|
|
|
|
|
|
|
|
|
|
|
|
|
DC - CBD |
|
92.6 |
% |
(156,931 |
) |
— |
|
— |
|
— |
|
— |
|
N/A |
|
N/A |
|
N/A |
|
|
DC - East End |
|
100.0 |
% |
— |
|
— |
|
— |
|
— |
|
159,000 |
|
100.0 |
% |
88.5 |
% |
11.5 |
% |
|
MD-Greenbelt |
|
67.8 |
% |
— |
|
(19,825 |
) |
20,633 |
|
808 |
|
571,677 |
|
67.9 |
% |
64.8 |
% |
3.1 |
% |
|
MD-Lanham |
|
31.8 |
% |
— |
|
(4,582 |
) |
4,582 |
|
— |
|
38,794 |
|
31.8 |
% |
68.4 |
% |
(36.6 |
)% |
|
NON-CORE Totals |
|
75.7 |
% |
(156,931 |
) |
(88,972 |
) |
67,381 |
|
(21,591 |
) |
3,822,770 |
|
75.7 |
% |
86.8 |
% |
(11.1 |
)% |
|
|
|
|
|
|
|
|
|
|
|
|
|
|
|
|
|
|
|
|
|
|
COMPANY Totals |
|
86.2 |
% |
(156,931 |
) |
(921,443 |
) |
1,124,140 |
|
202,697 |
|
20,910,999 |
|
87.2 |
% |
|
|
|
|
|
(a) |
Net gain/loss of leased square footage through properties sold, acquired or placed in service during the period. |
|
(b) |
Represents the square footage of expiring leases and leases scheduled to expire in the future for which new leases or renewals were signed during the period, as well as internal administrative adjustments. |
|
(c) |
Includes leases expiring March 31, 2016 aggregating 159,415 square feet for which no new leases were signed. |
|
(d) |
Excludes 3 Sylvan Way, a vacant 147,241 square-foot office building acquired December 23, 2015 and being prepared for lease up. |
|
(e) |
Market percent leased derived by inverting the market direct vacancy rate for all office classes as published by Cushman & Wakefield. |
Mack-Cali Realty Corporation Supplemental Operating and Financial Data for the Quarter Ended March 31, 2016
Details on Leasing - Quarter Stats
(for the three months ended March 31, 2016)
Consolidated Commercial In-Service Portfolio
|
|
|
|
|
|
|
|
|
Sq. Ft. |
|
|
|
|
|
|
|
|
Business Line |
|
# of |
|
Total |
|
Sq. Ft. |
|
Renewed and |
|
Wtd. Avg. |
|
Wtd. Avg. |
|
Leasing Costs Per |
|
|
Market/Submarket |
|
Transactions |
|
Sq. Ft. |
|
New Leases |
|
Other Retained (a) |
|
Term (Yrs.) |
|
Base Rent (b) |
|
Sq. Ft. Per Year (c) |
|
|
CORE |
|
|
|
|
|
|
|
|
|
|
|
|
|
|
|
|
Northern NJ |
|
|
|
|
|
|
|
|
|
|
|
|
|
|
|
|
Bergen Route 17/GSP |
|
1 |
|
2,800 |
|
— |
|
2,800 |
|
1.0 |
|
26.08 |
|
1.50 |
|
|
Morris Route 10/24 |
|
3 |
|
30,765 |
|
— |
|
30,765 |
|
2.4 |
|
29.28 |
|
10.93 |
|
|
Parsippany |
|
11 |
|
150,063 |
|
68,297 |
|
81,766 |
|
7.3 |
|
27.12 |
|
5.35 |
|
|
Suburban Passaic |
|
2 |
|
4,358 |
|
— |
|
4,358 |
|
4.2 |
|
22.81 |
|
2.88 |
|
|
Central NJ |
|
|
|
|
|
|
|
|
|
|
|
|
|
|
|
|
Clark & Cranford |
|
6 |
|
45,942 |
|
32,806 |
|
13,136 |
|
7.8 |
|
22.99 |
|
5.35 |
|
|
Monmouth County |
|
1 |
|
167 |
|
— |
|
167 |
|
6.0 |
|
25.63 |
|
1.45 |
|
|
Princeton |
|
3 |
|
5,215 |
|
3,729 |
|
1,486 |
|
4.5 |
|
29.60 |
|
5.41 |
|
|
Woodbridge/Edison |
|
2 |
|
72,382 |
|
61,068 |
|
11,314 |
|
10.1 |
|
35.71 |
|
6.11 |
|
|
Westchester Co., NY |
|
|
|
|
|
|
|
|
|
|
|
|
|
|
|
|
Elmsford |
|
2 |
|
390 |
|
— |
|
390 |
|
1.0 |
|
25.77 |
|
0.20 |
|
|
Hawthorne |
|
1 |
|
28,007 |
|
— |
|
28,007 |
|
5.0 |
|
30.50 |
|
3.36 |
|
|
White Plains CBD |
|
5 |
|
9,334 |
|
921 |
|
8,413 |
|
1.4 |
|
30.68 |
|
1.62 |
|
|
CORE Totals/Weighted Avg. |
|
37 |
|
349,423 |
|
166,821 |
|
182,602 |
|
7.0 |
|
28.89 |
|
5.59 |
|
|
|
|
|
|
|
|
|
|
|
|
|
|
|
|
|
|
|
HUDSON WATERFRONT |
|
9 |
|
551,674 |
|
153,950 |
|
397,724 |
|
10.8 |
|
35.15 |
|
6.77 |
|
|
|
|
|
|
|
|
|
|
|
|
|
|
|
|
|
|
|
FLEX |
|
|
|
|
|
|
|
|
|
|
|
|
|
|
|
|
Northern NJ |
|
|
|
|
|
|
|
|
|
|
|
|
|
|
|
|
Hudson Waterfront |
|
2 |
|
4,400 |
|
4,400 |
|
— |
|
10.3 |
|
43.47 |
|
3.83 |
|
|
Suburban Passaic |
|
2 |
|
13,630 |
|
— |
|
13,630 |
|
2.7 |
|
16.29 |
|
0.74 |
|
|
Central NJ |
|
|
|
|
|
|
|
|
|
|
|
|
|
|
|
|
Mercer Southern |
|
1 |
|
3,725 |
|
3,725 |
|
— |
|
2.0 |
|
20.47 |
|
9.96 |
|
|
Monmouth County |
|
3 |
|
12,241 |
|
— |
|
12,241 |
|
2.7 |
|
18.65 |
|
4.10 |
|
|
Westchester Co., NY |
|
|
|
|
|
|
|
|
|
|
|
|
|
|
|
|
Elmsford |
|
6 |
|
63,661 |
|
28,413 |
|
35,248 |
|
5.6 |
|
17.77 |
|
2.44 |
|
|
Hawthorne |
|
2 |
|
4,575 |
|
— |
|
4,575 |
|
3.0 |
|
20.06 |
|
1.29 |
|
|
Yonkers |
|
1 |
|
28,430 |
|
— |
|
28,430 |
|
1.0 |
|
21.55 |
|
0.84 |
|
|
Burlington Co., NJ |
|
3 |
|
25,000 |
|
15,400 |
|
9,600 |
|
4.4 |
|
10.25 |
|
2.32 |
|
|
FLEX Totals/Weighted Avg. |
|
20 |
|
155,662 |
|
51,938 |
|
103,724 |
|
4.0 |
|
18.05 |
|
2.50 |
|
|
|
|
|
|
|
|
|
|
|
|
|
|
|
|
|
|
|
NON-CORE |
|
|
|
|
|
|
|
|
|
|
|
|
|
|
|
|
Northern NJ |
|
|
|
|
|
|
|
|
|
|
|
|
|
|
|
|
Bergen Rt 17/GSP |
|
4 |
|
11,288 |
|
3,000 |
|
8,288 |
|
4.6 |
|
23.88 |
|
2.25 |
|
|
Parsippany |
|
1 |
|
7,010 |
|
— |
|
7,010 |
|
2.5 |
|
21.00 |
|
3.25 |
|
|
Central NJ |
|
|
|
|
|
|
|
|
|
|
|
|
|
|
|
|
Monmouth County |
|
1 |
|
20,874 |
|
— |
|
20,874 |
|
1.0 |
|
24.62 |
|
1.43 |
|
|
Somerset Route 78 |
|
2 |
|
2,994 |
|
1,122 |
|
1,872 |
|
4.6 |
|
23.76 |
|
0.62 |
|
|
Washington DC/MD |
|
|
|
|
|
|
|
|
|
|
|
|
|
|
|
|
MD- Greenbelt |
|
7 |
|
20,633 |
|
8,827 |
|
11,806 |
|
3.4 |
|
22.80 |
|
3.64 |
|
|
MD- Lanham |
|
1 |
|
4,582 |
|
— |
|
4,582 |
|
2.2 |
|
19.09 |
|
0.20 |
|
|
NON-CORE Totals/Weighted Avg. |
|
16 |
|
67,381 |
|
12,949 |
|
54,432 |
|
2.7 |
|
23.15 |
|
2.55 |
|
|
|
|
|
|
|
|
|
|
|
|
|
|
|
|
|
|
|
COMPANY Totals/Weighted Avg. |
|
82 |
|
1,124,140 |
|
385,658 |
|
738,482 |
|
8.2 |
|
30.12 |
|
6.08 |
|
|
|
|
|
|
|
|
|
|
|
|
|
|
|
|
|
|
|
Tenant Retention |
|
Leases Retained |
|
62.0 |
% |
|
|
|
|
|
|
|
|
|
|
|
|
|
Sq. Ft. Retained |
|
80.1 |
% |
|
|
|
|
|
|
|
|
|
|
|
(a) |
“Other Retained” transactions include existing tenants’ expansions and relocations within the same building. |
|
(b) |
Equals triple net rent plus common area costs and real estate taxes, as applicable. |
|
(c) |
Represents estimated workletter costs of $36,309,048 and commissions of $19,671,209 committed, but not necessarily expended, during the period for second generation space aggregating 1,124,140 square feet. |
Mack-Cali Realty Corporation Supplemental Operating and Financial Data for the Quarter Ended March 31, 2016
Details on Leasing - Expirations by Region
The following table sets forth a schedule of lease expirations for the total of the Company’s office, office/flex, industrial/warehouse and stand-alone retail properties included in the Consolidated Commercial Properties beginning April 1, 2016, assuming that none of the tenants exercise renewal or termination options (with a breakdown by market for 2016 through 2018 only):
2017 expirations were reduced by approximately 326,000 square feet in the first quarter of 2016.
|
|
|
|
|
|
|
Percentage of Total |
|
|
|
Average Annualized Base |
|
|
|
|
|
|
|
|
Net Rentable Area |
|
Leased Square Feet |
|
Annualized Base |
|
Rent Per Net Rentable |
|
Percentage of Annual |
|
|
Year of |
|
Number of |
|
Subject to Expiring |
|
Represented by |
|
Rental Revenue Under |
|
Square Foot Represented |
|
Base Rent Under |
|
|
Expiration/Market |
|
Leases Expiring (a) |
|
Leases (Sq. Ft.) |
|
Expiring Leases (%) |
|
Expiring Leases ($) (b) |
|
by Expiring Leases ($) |
|
Expiring Leases (%) |
|
|
|
|
|
|
|
|
|
|
|
|
|
|
|
|
|
2nd Quarter, 2016 |
|
60 |
|
324,624 |
|
1.6 |
|
7,917,113 |
|
24.39 |
|
1.6 |
|
|
3rd Quarter, 2016 |
|
60 |
|
444,286 |
|
2.2 |
|
10,120,425 |
|
22.78 |
|
2.0 |
|
|
4th Quarter, 2016 |
|
77 |
|
415,752 |
|
2.0 |
|
9,132,728 |
|
21.97 |
|
1.9 |
|
|
TOTAL — 2016 |
|
197 |
|
1,184,662 |
|
5.8 |
|
27,170,266 |
|
22.94 |
|
5.5 |
|
|
|
|
|
|
|
|
|
|
|
|
|
|
|
|
|
2016 (c) |
|
|
|
|
|
|
|
|
|
|
|
|
|
|
Northern NJ |
|
77 |
|
455,915 |
|
2.2 |
|
11,632,991 |
|
25.52 |
|
2.3 |
|
|
Central NJ |
|
48 |
|
354,295 |
|
1.7 |
|
8,142,391 |
|
22.98 |
|
1.6 |
|
|
Westchester Co., NY |
|
39 |
|
191,011 |
|
0.9 |
|
3,824,002 |
|
20.02 |
|
0.8 |
|
|
Manhattan |
|
— |
|
— |
|
— |
|
— |
|
— |
|
— |
|
|
Southern NJ |
|
7 |
|
50,953 |
|
0.3 |
|
340,740 |
|
6.69 |
|
0.1 |
|
|
Fairfield, CT |
|
2 |
|
18,549 |
|
0.1 |
|
318,303 |
|
17.16 |
|
0.1 |
|
|
Washington, DC/MD |
|
24 |
|
113,939 |
|
0.6 |
|
2,911,839 |
|
25.56 |
|
0.6 |
|
|
TOTAL — 2016 |
|
197 |
|
1,184,662 |
|
5.8 |
|
27,170,266 |
|
22.94 |
|
5.5 |
|
|
|
|
|
|
|
|
|
|
|
|
|
|
|
|
|
2017 |
|
|
|
|
|
|
|
|
|
|
|
|
|
|
Northern NJ |
|
124 |
|
1,749,687 |
|
8.5 |
|
52,935,779 |
|
30.25 |
|
10.7 |
|
|
Central NJ |
|
81 |
|
765,219 |
|
3.7 |
|
17,414,873 |
|
22.76 |
|
3.5 |
|
|
Westchester Co., NY |
|
83 |
|
358,837 |
|
1.8 |
|
7,654,153 |
|
21.33 |
|
1.5 |
|
|
Manhattan |
|
1 |
|
14,863 |
|
0.1 |
|
505,342 |
|
34.00 |
|
0.1 |
|
|
Southern NJ |
|
17 |
|
181,606 |
|
0.9 |
|
1,456,836 |
|
8.02 |
|
0.3 |
|
|
Fairfield, CT |
|
3 |
|
121,028 |
|
0.6 |
|
1,684,088 |
|
13.91 |
|
0.3 |
|
|
Washington, DC/MD |
|
22 |
|
73,595 |
|
0.3 |
|
1,729,116 |
|
23.50 |
|
0.4 |
|
|
TOTAL — 2017 |
|
331 |
|
3,264,835 |
|
15.9 |
|
83,380,187 |
|
25.54 |
|
16.8 |
|
|
|
|
|
|
|
|
|
|
|
|
|
|
|
|
|
2018 |
|
|
|
|
|
|
|
|
|
|
|
|
|
|
Northern NJ |
|
99 |
|
1,098,171 |
|
5.4 |
|
30,953,300 |
|
28.19 |
|
6.2 |
|
|
Central NJ |
|
76 |
|
573,758 |
|
2.8 |
|
13,893,724 |
|
24.22 |
|
2.8 |
|
|
Westchester Co., NY |
|
77 |
|
597,060 |
|
2.9 |
|
10,145,995 |
|
16.99 |
|
2.1 |
|
|
Manhattan |
|
— |
|
— |
|
— |
|
— |
|
— |
|
— |
|
|
Southern NJ |
|
25 |
|
344,186 |
|
1.7 |
|
2,652,205 |
|
7.71 |
|
0.5 |
|
|
Fairfield, CT |
|
1 |
|
88,000 |
|
0.4 |
|
1,651,760 |
|
18.77 |
|
0.3 |
|
|
Washington, DC/MD |
|
24 |
|
213,927 |
|
1.0 |
|
7,269,176 |
|
33.98 |
|
1.5 |
|
|
TOTAL — 2018 |
|
302 |
|
2,915,102 |
|
14.2 |
|
66,566,160 |
|
22.83 |
|
13.4 |
|
Schedule continued, with footnotes, on subsequent page.
Mack-Cali Realty Corporation Supplemental Operating and Financial Data for the Quarter Ended March 31, 2016
Details on Leasing - Expirations by Region (continued)
|
|
|
|
|
|
|
Percentage of Total |
|
|
|
Average Annualized Base |
|
|
|
|
|
|
|
|
Net Rentable Area |
|
Leased Square Feet |
|
Annualized Base |
|
Rent Per Net Rentable |
|
Percentage of Annual |
|
|
Year of |
|
Number of |
|
Subject to Expiring |
|
Represented by |
|
Rental Revenue Under |
|
Square Foot Represented |
|
Base Rent Under |
|
|
Expiration/Market |
|
Leases Expiring (a) |
|
Leases (Sq. Ft.) |
|
Expiring Leases (%) |
|
Expiring Leases ($) (b) |
|
by Expiring Leases ($) |
|
Expiring Leases (%) |
|
|
|
|
|
|
|
|
|
|
|
|
|
|
|
|
|
2019 |
|
258 |
|
2,447,790 |
|
11.9 |
|
52,941,119 |
|
21.63 |
|
10.7 |
|
|
|
|
|
|
|
|
|
|
|
|
|
|
|
|
|
2020 |
|
216 |
|
1,746,584 |
|
8.5 |
|
38,729,150 |
|
22.17 |
|
7.8 |
|
|
|
|
|
|
|
|
|
|
|
|
|
|
|
|
|
2021 |
|
171 |
|
1,641,355 |
|
8.0 |
|
41,136,813 |
|
25.06 |
|
8.3 |
|
|
|
|
|
|
|
|
|
|
|
|
|
|
|
|
|
2022 |
|
107 |
|
1,110,585 |
|
5.4 |
|
27,471,161 |
|
24.74 |
|
5.5 |
|
|
|
|
|
|
|
|
|
|
|
|
|
|
|
|
|
2023 |
|
74 |
|
1,549,898 |
|
7.6 |
|
35,901,875 |
|
23.16 |
|
7.2 |
|
|
|
|
|
|
|
|
|
|
|
|
|
|
|
|
|
2024 |
|
63 |
|
1,110,854 |
|
5.4 |
|
26,861,461 |
|
24.18 |
|
5.4 |
|
|
|
|
|
|
|
|
|
|
|
|
|
|
|
|
|
2025 |
|
35 |
|
677,028 |
|
3.3 |
|
15,635,121 |
|
23.09 |
|
3.1 |
|
|
|
|
|
|
|
|
|
|
|
|
|
|
|
|
|
2026 |
|
47 |
|
883,490 |
|
4.3 |
|
25,701,496 |
|
29.09 |
|
5.2 |
|
|
|
|
|
|
|
|
|
|
|
|
|
|
|
|
|
2027 and thereafter |
|
40 |
|
1,979,529 |
|
9.7 |
|
55,605,470 |
|
28.09 |
|
11.1 |
|
|
Totals/Weighted |
|
|
|
|
|
|
|
|
|
|
|
|
|
|
Average |
|
1,841 |
|
20,511,712 |
(c) (d) |
100.0 |
|
497,100,279 |
|
24.23 |
|
100.0 |
|
|
(a) |
Includes office, office/flex, industrial/warehouse and stand-alone retail property tenants only. Excludes leases for amenity, retail, parking and month-to-month tenants. Some tenants have multiple leases. |
|
(b) |
Annualized base rental revenue is based on actual March 2016 billings times 12. For leases whose rent commences after April 1, 2016 annualized base rental revenue is based on the first full month’s billing times 12. As annualized base rental revenue is not derived from historical GAAP results, historical results may differ from those set forth above. |
|
(c) |
Includes leases expiring March 31, 2016 aggregating 159,415 square feet and representing annualized rent of $3,827,385 for which no new leases were signed. |
|
(d) |
Reconciliation to Company’s total net rentable square footage is as follows: |
|
|
|
Square Feet |
|
|
Square footage leased to commercial tenants |
|
20,511,712 |
|
|
Square footage used for corporate offices, management offices, |
|
|
|
|
building use, retail tenants, food services, other ancillary |
|
|
|
|
service tenants and occupancy adjustments |
|
399,287 |
|
|
Square footage unleased |
|
3,063,931 |
|
|
Total net rentable square footage (does not include land leases) |
|
23,974,930 |
|
Mack-Cali Realty Corporation Supplemental Operating and Financial Data for the Quarter Ended March 31, 2016
Details on Leasing - Expirations by Type
The following table sets forth a schedule of lease expirations for all consolidated properties beginning April 1, 2016, assuming that none of the tenants exercise renewal or termination options:
|
|
|
|
|
|
|
Percentage of Total |
|
|
|
Average Annualized Base |
|
|
|
|
|
|
|
|
Net Rentable Area |
|
Leased Square Feet |
|
Annualized Base |
|
Rent Per Net Rentable |
|
Percentage of Annual |
|
|
Year of |
|
Number of |
|
Subject to Expiring |
|
Represented by |
|
Rental Revenue Under |
|
Square Foot Represented |
|
Base Rent Under |
|
|
Expiration/Market |
|
Leases Expiring (a) |
|
Leases (Sq. Ft.) |
|
Expiring Leases (%) |
|
Expiring Leases ($) (b) |
|
by Expiring Leases ($) |
|
Expiring Leases (%) |
|
|
|
|
|
|
|
|
|
|
|
|
|
|
|
|
|
2016 |
|
|
|
|
|
|
|
|
|
|
|
|
|
|
Core |
|
91 |
|
538,033 |
|
2.6 |
|
14,045,847 |
|
26.11 |
|
2.8 |
|
|
Waterfront |
|
5 |
|
26,322 |
|
0.2 |
|
998,222 |
|
37.92 |
|
0.2 |
|
|
Flex |
|
45 |
|
315,024 |
|
1.5 |
|
4,445,465 |
|
14.11 |
|
0.9 |
|
|
Non-Core |
|
56 |
|
305,283 |
|
1.5 |
|
7,680,732 |
|
25.16 |
|
1.6 |
|
|
TOTAL — 2016 |
|
197 |
|
1,184,662 |
|
5.8 |
|
27,170,266 |
|
22.94 |
|
5.5 |
|
|
|
|
|
|
|
|
|
|
|
|
|
|
|
|
|
2017 |
|
|
|
|
|
|
|
|
|
|
|
|
|
|
Core |
|
138 |
|
1,053,029 |
|
5.1 |
|
26,786,095 |
|
25.44 |
|
5.4 |
|
|
Waterfront |
|
23 |
|
820,029 |
|
4.0 |
|
29,705,857 |
|
36.23 |
|
6.0 |
|
|
Flex |
|
85 |
|
657,647 |
|
3.2 |
|
8,816,154 |
|
13.41 |
|
1.8 |
|
|
Non-Core |
|
85 |
|
734,130 |
|
3.6 |
|
18,072,081 |
|
24.62 |
|
3.6 |
|
|
TOTAL — 2017 |
|
331 |
|
3,264,835 |
|
15.9 |
|
83,380,187 |
|
25.54 |
|
16.8 |
|
|
|
|
|
|
|
|
|
|
|
|
|
|
|
|
|
2018 |
|
|
|
|
|
|
|
|
|
|
|
|
|
|
Core |
|
122 |
|
796,729 |
|
3.9 |
|
21,136,934 |
|
26.53 |
|
4.3 |
|
|
Waterfront |
|
12 |
|
457,848 |
|
2.2 |
|
15,636,645 |
|
34.15 |
|
3.1 |
|
|
Flex |
|
99 |
|
1,125,327 |
|
5.5 |
|
14,494,000 |
|
12.88 |
|
2.9 |
|
|
Non-Core |
|
69 |
|
535,198 |
|
2.6 |
|
15,298,581 |
|
28.58 |
|
3.1 |
|
|
TOTAL — 2018 |
|
302 |
|
2,915,102 |
|
14.2 |
|
66,566,160 |
|
22.83 |
|
13.4 |
|
|
|
|
|
|
|
|
|
|
|
|
|
|
|
|
|
2019 |
|
|
|
|
|
|
|
|
|
|
|
|
|
|
Core |
|
113 |
|
1,061,276 |
|
5.1 |
|
28,356,538 |
|
26.72 |
|
5.7 |
|
|
Waterfront |
|
12 |
|
83,433 |
|
0.4 |
|
2,968,853 |
|
35.58 |
|
0.6 |
|
|
Flex |
|
67 |
|
880,556 |
|
4.3 |
|
12,169,469 |
|
13.82 |
|
2.5 |
|
|
Non-Core |
|
66 |
|
422,525 |
|
2.1 |
|
9,446,259 |
|
22.36 |
|
1.9 |
|
|
TOTAL — 2019 |
|
258 |
|
2,447,790 |
|
11.9 |
|
52,941,119 |
|
21.63 |
|
10.7 |
|
|
|
|
|
|
|
|
|
|
|
|
|
|
|
|
|
2020 |
|
|
|
|
|
|
|
|
|
|
|
|
|
|
Core |
|
110 |
|
960,149 |
|
4.6 |
|
23,470,442 |
|
24.44 |
|
4.7 |
|
|
Waterfront |
|
8 |
|
70,779 |
|
0.4 |
|
2,496,120 |
|
35.27 |
|
0.5 |
|
|
Flex |
|
49 |
|
422,476 |
|
2.1 |
|
5,627,791 |
|
13.32 |
|
1.1 |
|
|
Non-Core |
|
49 |
|
293,180 |
|
1.4 |
|
7,134,797 |
|
24.34 |
|
1.5 |
|
|
TOTAL — 2020 |
|
216 |
|
1,746,584 |
|
8.5 |
|
38,729,150 |
|
22.17 |
|
7.8 |
|
|
|
|
|
|
|
|
|
|
|
|
|
|
|
|
|
2021 |
|
|
|
|
|
|
|
|
|
|
|
|
|
|
Core |
|
70 |
|
619,580 |
|
3.0 |
|
16,950,535 |
|
27.36 |
|
3.4 |
|
|
Waterfront |
|
15 |
|
362,001 |
|
1.8 |
|
12,054,028 |
|
33.30 |
|
2.4 |
|
|
Flex |
|
41 |
|
360,284 |
|
1.8 |
|
4,894,682 |
|
13.59 |
|
1.0 |
|
|
Non-Core |
|
45 |
|
299,490 |
|
1.4 |
|
7,237,568 |
|
24.17 |
|
1.5 |
|
|
TOTAL — 2021 |
|
171 |
|
1,641,355 |
|
8.0 |
|
41,136,813 |
|
25.06 |
|
8.3 |
|
Mack-Cali Realty Corporation Supplemental Operating and Financial Data for the Quarter Ended March 31, 2016
Details on Leasing - Expirations by Type (continued)
|
|
|
|
|
|
|
Percentage of Total |
|
|
|
Average Annualized Base |
|
|
|
|
|
|
|
|
Net Rentable Area |
|
Leased Square Feet |
|
Annualized Base |
|
Rent Per Net Rentable |
|
Percentage of Annual |
|
|
Year of |
|
Number of |
|
Subject to Expiring |
|
Represented by |
|
Rental Revenue Under |
|
Square Foot Represented |
|
Base Rent Under |
|
|
Expiration/Market |
|
Leases Expiring (a) |
|
Leases (Sq. Ft.) |
|
Expiring Leases (%) |
|
Expiring Leases ($) (b) |
|
by Expiring Leases ($) |
|
Expiring Leases (%) |
|
|
|
|
|
|
|
|
|
|
|
|
|
|
|
|
|
2022 |
|
|
|
|
|
|
|
|
|
|
|
|
|
|
Core |
|
53 |
|
464,167 |
|
2.2 |
|
12,488,102 |
|
26.90 |
|
2.5 |
|
|
Waterfront |
|
11 |
|
252,201 |
|
1.2 |
|
7,339,789 |
|
29.10 |
|
1.5 |
|
|
Flex |
|
19 |
|
176,402 |
|
0.9 |
|
2,422,354 |
|
13.73 |
|
0.5 |
|
|
Non-Core |
|
24 |
|
217,815 |
|
1.1 |
|
5,220,916 |
|
23.97 |
|
1.0 |
|
|
TOTAL — 2022 |
|
107 |
|
1,110,585 |
|
5.4 |
|
27,471,161 |
|
24.74 |
|
5.5 |
|
|
|
|
|
|
|
|
|
|
|
|
|
|
|
|
|
2023 |
|
|
|
|
|
|
|
|
|
|
|
|
|
|
Core |
|
33 |
|
773,537 |
|
3.9 |
|
17,089,089 |
|
22.09 |
|
3.4 |
|
|
Waterfront |
|
9 |
|
329,554 |
|
1.6 |
|
10,347,972 |
|
31.40 |
|
2.1 |
|
|
Flex |
|
13 |
|
232,799 |
|
1.1 |
|
3,388,178 |
|
14.55 |
|
0.7 |
|
|
Non-Core |
|
19 |
|
214,008 |
|
1.0 |
|
5,076,636 |
|
23.72 |
|
1.0 |
|
|
TOTAL — 2023 |
|
74 |
|
1,549,898 |
|
7.6 |
|
35,901,875 |
|
23.16 |
|
7.2 |
|
|
|
|
|
|
|
|
|
|
|
|
|
|
|
|
|
2024 |
|
|
|
|
|
|
|
|
|
|
|
|
|
|
Core |
|
30 |
|
598,012 |
|
2.9 |
|
14,973,582 |
|
25.04 |
|
3.0 |
|
|
Waterfront |
|
6 |
|
166,111 |
|
0.8 |
|
5,852,227 |
|
35.23 |
|
1.2 |
|
|
Flex |
|
19 |
|
242,349 |
|
1.2 |
|
3,675,010 |
|
15.16 |
|
0.7 |
|
|
Non-Core |
|
8 |
|
104,382 |
|
0.5 |
|
2,360,642 |
|
22.62 |
|
0.5 |
|
|
TOTAL — 2024 |
|
63 |
|
1,110,854 |
|
5.4 |
|
26,861,461 |
|
24.18 |
|
5.4 |
|
|
|
|
|
|
|
|
|
|
|
|
|
|
|
|
|
2025 |
|
|
|
|
|
|
|
|
|
|
|
|
|
|
Core |
|
13 |
|
259,357 |
|
1.2 |
|
7,226,632 |
|
27.86 |
|
1.5 |
|
|
Waterfront |
|
4 |
|
95,077 |
|
0.5 |
|
3,111,798 |
|
32.73 |
|
0.6 |
|
|
Flex |
|
12 |
|
204,851 |
|
1.0 |
|
2,623,586 |
|
12.81 |
|
0.5 |
|
|
Non-Core |
|
6 |
|
117,743 |
|
0.6 |
|
2,673,105 |
|
22.70 |
|
0.5 |
|
|
TOTAL — 2025 |
|
35 |
|
677,028 |
|
3.3 |
|
15,635,121 |
|
23.09 |
|
3.1 |
|
|
|
|
|
|
|
|
|
|
|
|
|
|
|
|
|
2026 |
|
|
|
|
|
|
|
|
|
|
|
|
|
|
Core |
|
22 |
|
379,427 |
|
1.8 |
|
10,743,125 |
|
28.31 |
|
2.2 |
|
|
Waterfront |
|
11 |
|
299,111 |
|
1.5 |
|
10,119,674 |
|
33.83 |
|
2.0 |
|
|
Flex |
|
10 |
|
73,418 |
|
0.4 |
|
1,062,076 |
|
14.47 |
|
0.2 |
|
|
Non-Core |
|
4 |
|
131,534 |
|
0.6 |
|
3,776,621 |
|
28.71 |
|
0.8 |
|
|
TOTAL — 2026 |
|
47 |
|
883,490 |
|
4.3 |
|
25,701,496 |
|
29.09 |
|
5.2 |
|
|
|
|
|
|
|
|
|
|
|
|
|
|
|
|
|
2027 and thereafter |
|
|
|
|
|
|
|
|
|
|
|
|
|
|
Core |
|
12 |
|
660,704 |
|
3.3 |
|
15,608,894 |
|
23.62 |
|
3.1 |
|
|
Waterfront |
|
16 |
|
887,835 |
|
4.3 |
|
25,391,580 |
|
28.60 |
|
5.1 |
|
|
Flex |
|
2 |
|
23,085 |
|
0.1 |
|
459,220 |
|
19.89 |
|
0.1 |
|
|
Non-Core |
|
10 |
|
407,905 |
|
2.0 |
|
14,145,776 |
|
34.68 |
|
2.8 |
|
|
TOTAL — 2027 and thereafter |
|
40 |
|
1,979,529 |
|
9.7 |
|
55,605,470 |
|
28.09 |
|
11.1 |
|
|
|
|
|
|
|
|
|
|
|
|
|
|
|
|
|
Totals/Weighted Average |
|
1,841 |
|
20,511,712 |
|
100.0 |
|
497,100,279 |
|
24.23 |
|
100.0 |
|
Mack-Cali Realty Corporation Supplemental Operating and Financial Data for the Quarter Ended March 31, 2016
Details on Leasing - Expirations (Core)
The following table sets forth a schedule of lease expirations for the core properties beginning April 1, 2016, assuming that none of the tenants exercise renewal or termination options:
|
|
|
|
|
|
|
Percentage of Total |
|
|
|
Average Annualized Base |
|
|
|
|
|
|
|
|
Net Rentable Area |
|
Leased Square Feet |
|
Annualized Base |
|
Rent Per Net Rentable |
|
Percentage of Annual |
|
|
Year of |
|
Number of |
|
Subject to Expiring |
|
Represented by |
|
Rental Revenue Under |
|
Square Foot Represented |
|
Base Rent Under |
|
|
Expiration/Market |
|
Leases Expiring |
|
Leases (Sq. Ft.) |
|
Expiring Leases (%) |
|
Expiring Leases ($) |
|
by Expiring Leases ($) |
|
Expiring Leases (%) |
|
|
|
|
|
|
|
|
|
|
|
|
|
|
|
|
|
2016 |
|
91 |
|
538,033 |
|
6.5 |
|
14,045,847 |
|
26.11 |
|
6.7 |
|
|
|
|
|
|
|
|
|
|
|
|
|
|
|
|
|
2017 |
|
138 |
|
1,053,029 |
|
12.9 |
|
26,786,095 |
|
25.44 |
|
12.8 |
|
|
|
|
|
|
|
|
|
|
|
|
|
|
|
|
|
2018 |
|
122 |
|
796,729 |
|
9.8 |
|
21,136,934 |
|
26.53 |
|
10.1 |
|
|
|
|
|
|
|
|
|
|
|
|
|
|
|
|
|
2019 |
|
113 |
|
1,061,276 |
|
13.0 |
|
28,356,538 |
|
26.72 |
|
13.6 |
|
|
|
|
|
|
|
|
|
|
|
|
|
|
|
|
|
2020 |
|
110 |
|
960,149 |
|
11.8 |
|
23,470,442 |
|
24.44 |
|
11.2 |
|
|
|
|
|
|
|
|
|
|
|
|
|
|
|
|
|
2021 |
|
70 |
|
619,580 |
|
7.6 |
|
16,950,535 |
|
27.36 |
|
8.1 |
|
|
|
|
|
|
|
|
|
|
|
|
|
|
|
|
|
2022 |
|
53 |
|
464,167 |
|
5.7 |
|
12,488,102 |
|
26.90 |
|
6.0 |
|
|
|
|
|
|
|
|
|
|
|
|
|
|
|
|
|
2023 |
|
33 |
|
773,537 |
|
9.5 |
|
17,089,089 |
|
22.09 |
|
8.2 |
|
|
|
|
|
|
|
|
|
|
|
|
|
|
|
|
|
2024 |
|
30 |
|
598,012 |
|
7.3 |
|
14,973,582 |
|
25.04 |
|
7.2 |
|
|
|
|
|
|
|
|
|
|
|
|
|
|
|
|
|
2025 |
|
13 |
|
259,357 |
|
3.2 |
|
7,226,632 |
|
27.86 |
|
3.5 |
|
|
|
|
|
|
|
|
|
|
|
|
|
|
|
|
|
2026 |
|
22 |
|
379,427 |
|
4.6 |
|
10,743,125 |
|
28.31 |
|
5.1 |
|
|
|
|
|
|
|
|
|
|
|
|
|
|
|
|
|
2027 and thereafter |
|
12 |
|
660,704 |
|
8.1 |
|
15,608,894 |
|
23.62 |
|
7.5 |
|
|
Totals/Weighted Average |
|
807 |
|
8,164,000 |
|
100.0 |
|
208,875,815 |
|
25.58 |
|
100.0 |
|
|
Notes: | |
|
(1) |
Includes tenants of core properties only. Excludes leases for amenity, retail, parking and month-to-month tenants. Some tenants have multiple leases. |
|
(2) |
Annualized base rental revenue is based on actual March 2016 billings times 12. For leases whose rent commences after April 1, 2016, annualized base rental revenue is based on the first full month’s billing times 12. As annualized base rental revenue is not derived from historical GAAP results, historical results may differ from those set forth above. Includes office/flex tenants only. Excludes leases for amenity, retail, parking and month-to-month tenants. Some tenants have multiple leases. |
|
(3) |
Includes leases expiring March 31, 2016 aggregating 117,874 square feet and representing annualized rent of $2,470,261 for which no new leases were signed. |
Mack-Cali Realty Corporation Supplemental Operating and Financial Data for the Quarter Ended March 31, 2016
Details on Leasing - Expirations (Waterfront)
The following table sets forth a schedule of lease expirations for the waterfront properties beginning April 1, 2016, assuming that none of the tenants exercise renewal or termination options.
|
|
|
|
|
|
|
Percentage of Total |
|
|
|
Average Annualized Base |
|
|
|
|
|
|
|
|
Net Rentable Area |
|
Leased Square Feet |
|
Annualized Base |
|
Rent Per Net Rentable |
|
Percentage of Annual |
|
|
Year of |
|
Number of |
|
Subject to Expiring |
|
Represented by |
|
Rental Revenue Under |
|
Square Foot Represented |
|
Base Rent Under |
|
|
Expiration/Market |
|
Leases Expiring |
|
Leases (Sq. Ft.) |
|
Expiring Leases (%) |
|
Expiring Leases ($) |
|
by Expiring Leases ($) |
|
Expiring Leases (%) |
|
|
|
|
|
|
|
|
|
|
|
|
|
|
|
|
|
2016 |
|
5 |
|
26,322 |
|
0.7 |
|
998,222 |
|
37.92 |
|
0.8 |
|
|
|
|
|
|
|
|
|
|
|
|
|
|
|
|
|
2017 |
|
23 |
|
820,029 |
|
21.3 |
|
29,705,857 |
|
36.23 |
|
23.6 |
|
|
|
|
|
|
|
|
|
|
|
|
|
|
|
|
|
2018 |
|
12 |
|
457,848 |
|
11.9 |
|
15,636,645 |
|
34.15 |
|
12.4 |
|
|
|
|
|
|
|
|
|
|
|
|
|
|
|
|
|
2019 |
|
12 |
|
83,433 |
|
2.2 |
|
2,968,853 |
|
35.58 |
|
2.4 |
|
|
|
|
|
|
|
|
|
|
|
|
|
|
|
|
|
2020 |
|
8 |
|
70,779 |
|
1.8 |
|
2,496,120 |
|
35.27 |
|
2.0 |
|
|
|
|
|
|
|
|
|
|
|
|
|
|
|
|
|
2021 |
|
15 |
|
362,001 |
|
9.4 |
|
12,054,028 |
|
33.30 |
|
9.5 |
|
|
|
|
|
|
|
|
|
|
|
|
|
|
|
|
|
2022 |
|
11 |
|
252,201 |
|
6.5 |
|
7,339,789 |
|
29.10 |
|
5.8 |
|
|
|
|
|
|
|
|
|
|
|
|
|
|
|
|
|
2023 |
|
9 |
|
329,554 |
|
8.5 |
|
10,347,972 |
|
31.40 |
|
8.2 |
|
|
|
|
|
|
|
|
|
|
|
|
|
|
|
|
|
2024 |
|
6 |
|
166,111 |
|
4.3 |
|
5,852,227 |
|
35.23 |
|
4.6 |
|
|
|
|
|
|
|
|
|
|
|
|
|
|
|
|
|
2025 |
|
4 |
|
95,077 |
|
2.5 |
|
3,111,798 |
|
32.73 |
|
2.5 |
|
|
|
|
|
|
|
|
|
|
|
|
|
|
|
|
|
2026 |
|
11 |
|
299,111 |
|
7.8 |
|
10,119,674 |
|
33.83 |
|
8.0 |
|
|
|
|
|
|
|
|
|
|
|
|
|
|
|
|
|
2027 and thereafter |
|
16 |
|
887,835 |
|
23.1 |
|
25,391,580 |
|
28.60 |
|
20.2 |
|
|
Totals/Weighted Average |
|
132 |
|
3,850,301 |
|
100.0 |
|
126,022,765 |
|
32.73 |
|
100.0 |
|
|
Notes: |
| |
|
(1) |
|
Includes tenants of waterfront properties only. Excludes leases for amenity, retail, parking and month-to-month tenants. Some tenants have multiple leases. |
|
(2) |
|
Annualized base rental revenue is based on actual March 2016 billings times 12. For leases whose rent commences after April 1, 2016, annualized base rental revenue is based on the first full month’s billing times 12. As annualized base rental revenue is not derived from historical GAAP results, the historical results may differ from those set forth above. |
|
(3) |
|
Includes leases expiring March 31, 2016 aggregating 14,829 square feet and representing annualized rent of $526,429 for which no new leases were signed. |
Mack-Cali Realty Corporation Supplemental Operating and Financial Data for the Quarter Ended March 31, 2016
Details on Leasing - Expirations (Flex)
The following table sets forth a schedule of lease expirations for the flex properties beginning April 1, 2016, assuming that none of the tenants exercise renewal or termination options:
|
|
|
|
|
|
|
Percentage of Total |
|
|
|
Average Annualized Base |
|
|
|
|
|
|
|
|
Net Rentable Area |
|
Leased Square Feet |
|
Annualized Base |
|
Rent Per Net Rentable |
|
Percentage of Annual |
|
|
Year of |
|
Number of |
|
Subject to Expiring |
|
Represented by |
|
Rental Revenue Under |
|
Square Foot Represented |
|
Base Rent Under |
|
|
Expiration/Market |
|
Leases Expiring |
|
Leases (Sq. Ft.) |
|
Expiring Leases (%) |
|
Expiring Leases ($) |
|
by Expiring Leases ($) |
|
Expiring Leases (%) |
|
|
|
|
|
|
|
|
|
|
|
|
|
|
|
|
|
2016 |
|
45 |
|
315,024 |
|
6.7 |
|
4,445,465 |
|
14.11 |
|
6.9 |
|
|
|
|
|
|
|
|
|
|
|
|
|
|
|
|
|
2017 |
|
85 |
|
657,647 |
|
14.0 |
|
8,816,154 |
|
13.41 |
|
13.8 |
|
|
|
|
|
|
|
|
|
|
|
|
|
|
|
|
|
2018 |
|
99 |
|
1,125,327 |
|
23.8 |
|
14,494,000 |
|
12.88 |
|
22.6 |
|
|
|
|
|
|
|
|
|
|
|
|
|
|
|
|
|
2019 |
|
67 |
|
880,556 |
|
18.7 |
|
12,169,469 |
|
13.82 |
|
19.0 |
|
|
|
|
|
|
|
|
|
|
|
|
|
|
|
|
|
2020 |
|
49 |
|
422,476 |
|
9.0 |
|
5,627,791 |
|
13.32 |
|
8.8 |
|
|
|
|
|
|
|
|
|
|
|
|
|
|
|
|
|
2021 |
|
41 |
|
360,284 |
|
7.6 |
|
4,894,682 |
|
13.59 |
|
7.6 |
|
|
|
|
|
|
|
|
|
|
|
|
|
|
|
|
|
2022 |
|
19 |
|
176,402 |
|
3.7 |
|
2,422,354 |
|
13.73 |
|
3.8 |
|
|
|
|
|
|
|
|
|
|
|
|
|
|
|
|
|
2023 |
|
13 |
|
232,799 |
|
4.9 |
|
3,388,178 |
|
14.55 |
|
5.3 |
|
|
|
|
|
|
|
|
|
|
|
|
|
|
|
|
|
2024 |
|
19 |
|
242,349 |
|
5.1 |
|
3,675,010 |
|
15.16 |
|
5.7 |
|
|
|
|
|
|
|
|
|
|
|
|
|
|
|
|
|
2025 |
|
12 |
|
204,851 |
|
4.4 |
|
2,623,586 |
|
12.81 |
|
4.1 |
|
|
|
|
|
|
|
|
|
|
|
|
|
|
|
|
|
2026 |
|
10 |
|
73,418 |
|
1.6 |
|
1,062,076 |
|
14.47 |
|
1.7 |
|
|
|
|
|
|
|
|
|
|
|
|
|
|
|
|
|
2027 and thereafter |
|
2 |
|
23,085 |
|
0.5 |
|
459,220 |
|
19.89 |
|
0.7 |
|
|
Totals/Weighted Average |
|
461 |
|
4,714,218 |
|
100.0 |
|
64,077,985 |
|
13.59 |
|
100.0 |
|
|
Notes: | ||
|
(1) |
|
Includes tenants of flex properties only. Excludes leases for amenity, retail, parking and month-to-month tenants. Some tenants have multiple leases. |
|
(2) |
|
Annualized base rental revenue is based on actual March 2016 billings times 12. For leases whose rent commences after April 1, 2016 annualized base rental revenue is based on the first full month’s billing times 12. As annualized base rental revenue is not derived from historical GAAP results, historical results may differ from those set forth above. |
Mack-Cali Realty Corporation Supplemental Operating and Financial Data for the Quarter Ended March 31, 2016
Details on Leasing - Expirations (Non-Core)
The following table sets forth a schedule of lease expirations for the non-core properties beginning April 1, 2016, assuming that none of the tenants exercise renewal or termination options:
|
|
|
|
|
|
|
Percentage of Total |
|
|
|
Average Annualized Base |
|
|
|
|
|
|
|
|
Net Rentable Area |
|
Leased Square Feet |
|
Annualized Base |
|
Rent Per Net Rentable |
|
Percentage of Annual |
|
|
Year of |
|
Number of |
|
Subject to Expiring |
|
Represented by |
|
Rental Revenue Under |
|
Square Foot Represented |
|
Base Rent Under |
|
|
Expiration/Market |
|
Leases Expiring |
|
Leases (Sq. Ft.) |
|
Expiring Leases (%) |
|
Expiring Leases ($) |
|
by Expiring Leases ($) |
|
Expiring Leases (%) |
|
|
|
|
|
|
|
|
|
|
|
|
|
|
|
|
|
2016 |
|
56 |
|
305,283 |
|
8.1 |
|
7,680,732 |
|
25.16 |
|
7.8 |
|
|
|
|
|
|
|
|
|
|
|
|
|
|
|
|
|
2017 |
|
85 |
|
734,130 |
|
19.4 |
|
18,072,081 |
|
24.62 |
|
18.4 |
|
|
|
|
|
|
|
|
|
|
|
|
|
|
|
|
|
2018 |
|
69 |
|
535,198 |
|
14.1 |
|
15,298,581 |
|
28.58 |
|
15.6 |
|
|
|
|
|
|
|
|
|
|
|
|
|
|
|
|
|
2019 |
|
66 |
|
422,525 |
|
11.1 |
|
9,446,259 |
|
22.36 |
|
9.6 |
|
|
|
|
|
|
|
|
|
|
|
|
|
|
|
|
|
2020 |
|
49 |
|
293,180 |
|
7.8 |
|
7,134,797 |
|
24.34 |
|
7.3 |
|
|
|
|
|
|
|
|
|
|
|
|
|
|
|
|
|
2021 |
|
45 |
|
299,490 |
|
7.9 |
|
7,237,568 |
|
24.17 |
|
7.4 |
|
|
|
|
|
|
|
|
|
|
|
|
|
|
|
|
|
2022 |
|
24 |
|
217,815 |
|
5.8 |
|
5,220,916 |
|
23.97 |
|
5.3 |
|
|
|
|
|
|
|
|
|
|
|
|
|
|
|
|
|
2023 |
|
19 |
|
214,008 |
|
5.7 |
|
5,076,636 |
|
23.72 |
|
5.2 |
|
|
|
|
|
|
|
|
|
|
|
|
|
|
|
|
|
2024 |
|
8 |
|
104,382 |
|
2.8 |
|
2,360,642 |
|
22.62 |
|
2.4 |
|
|
|
|
|
|
|
|
|
|
|
|
|
|
|
|
|
2025 |
|
6 |
|
117,743 |
|
3.1 |
|
2,673,105 |
|
22.70 |
|
2.7 |
|
|
|
|
|
|
|
|
|
|
|
|
|
|
|
|
|
2026 |
|
4 |
|
131,534 |
|
3.5 |
|
3,776,621 |
|
28.71 |
|
3.9 |
|
|
|
|
|
|
|
|
|
|
|
|
|
|
|
|
|
2027 and thereafter |
|
10 |
|
407,905 |
|
10.7 |
|
14,145,776 |
|
34.68 |
|
14.4 |
|
|
|
|
|
|
|
|
|
|
|
|
|
|
|
|
|
Totals/Weighted Average |
|
441 |
|
3,783,193 |
|
100.0 |
|
98,123,714 |
|
25.94 |
|
100.0 |
|
Notes:
(1) Includes tenants of non-core properties only. Excludes leases for amenity, retail, parking and month-to-month tenants. Some tenants have multiple leases.
(2) Annualized base rental revenue is based on actual March 2016 billings times 12. For leases whose rent commences after April 1, 2016 annualized base rental revenue is based on the first full month’s billing times 12. As annualized base rental revenue is not derived from historical GAAP results, historical results may differ from those set forth above.
(3) Includes leases expiring March 31, 2016 aggregating 26,712 square feet and representing annualized rent of $830,694 for which no new leases were signed.
Mack-Cali Realty Corporation Supplemental Operating and Financial Data for the Quarter Ended March 31, 2016
Details on Earnings - FFO and Core FFO per Share
(amounts are per diluted share, except share count in thousands) (unaudited)
|
|
|
Three Months Ended |
| ||||
|
|
|
March 31, |
| ||||
|
|
|
2016 |
|
2015 |
| ||
|
Net income (loss) available to common shareholders |
|
$ |
0.69 |
|
$ |
(0.03 |
) |
|
Add: Real estate-related depreciation and amortization on continuing operations (a) |
|
0.47 |
|
0.46 |
| ||
|
Deduct: Gain on change of control of interests |
|
(0.10 |
) |
— |
| ||
|
Realized (gains) losses and unrealized losses on disposition of rental property, net |
|
(0.58 |
) |
— |
| ||
|
Funds from operations (b) |
|
$ |
0.48 |
|
$ |
0.43 |
|
|
|
|
|
|
|
| ||
|
Add: |
|
|
|
|
| ||
|
Mark-to-market interest rate swap |
|
$ |
0.01 |
|
— |
| |
|
Core FFO |
|
$ |
0.49 |
|
$ |
0.43 |
|
(a) Includes the Company’s share from unconsolidated joint ventures of $0.05 and $0.05 for the three months ended March 31, 2016 and 2015, respectively.
(b) Funds from operations is calculated in accordance with the definition of FFO of the National Association of Real Estate Investment Trusts (NAREIT). See “Information About FFO, Core FFO and AFFO” below.
Information About FFO, Core FFO and AFFO
Funds from operations (“FFO”) is defined as net income (loss) before noncontrolling interests of unitholders, computed in accordance with generally accepted accounting principles (“GAAP”), excluding gains or losses from depreciable rental property transactions, and impairments related to depreciable rental property, plus real estate-related depreciation and amortization. The Company believes that FFO per share is helpful to investors as one of several measures of the performance of an equity REIT. The Company further believes that as FFO per share excludes the effect of depreciation, gains (or losses) from sales of properties and impairments related to depreciable rental property (all of which are based on historical costs which may be of limited relevance in evaluating current performance), FFO per share can facilitate comparison of operating performance between equity REITs.
FFO per share should not be considered as an alternative to net income available to common shareholders per share as an indication of the Company’s performance or to cash flows as a measure of liquidity. FFO per share presented herein is not necessarily comparable to FFO per share presented by other real estate companies due to the fact that not all real estate companies use the same definition. However, the Company’s FFO per share is comparable to the FFO per share of real estate companies that use the current definition of the National Association of Real Estate Investment Trusts (“NAREIT”). A reconciliation of net income per share to FFO per share is included in the financial tables above.
Core FFO is defined as FFO, as adjusted for certain items to facilitate comparative measurement of the Company’s performance over time. Adjusted FFO (“AFFO”) is defined as Core FFO less (i) recurring tenant improvements, leasing commissions and capital expenditures, (ii) straight-line rents and amortization of acquired below-market leases, net, and (iii) other non-cash income, plus (iv) other non-cash charges. Core FFO and AFFO are presented solely as supplemental disclosure that the Company’s management believes provides useful information to investors and analysts of its results, after adjusting for certain items to facilitate comparability of its performance from period to period. Core FFO and AFFO are both non-GAAP financial measures that are not intended to represent cash flow and are not indicative of cash flows provided by operating activities as determined in accordance with GAAP. There are not generally accepted definitions established for Core FFO or AFFO. Therefore, the Company’s measures of Core FFO and AFFO may not be comparable to the Core FFO and AFFO reported by other REITs. A reconciliation of net income per share to Core FFO and AFFO in dollars and per share are included in the financial tables on page 15.
Mack-Cali Realty Corporation Supplemental Operating and Financial Data for the Quarter Ended March 31, 2016
Details on Financials - Debt Stats
(dollars in thousands)
|
|
|
|
|
Effective |
|
March 31, |
|
December 31, |
|
Date of |
| ||
|
|
|
Lender |
|
Interest Rate |
|
2016 |
|
2015 |
|
Maturity |
| ||
|
Senior Unsecured Notes: (a) |
|
|
|
|
|
|
|
|
|
|
| ||
|
5.800%, Senior Unsecured Notes |
|
public debt |
|
5.806 |
% |
— |
|
$ |
200,000 |
|
01/15/16 |
(b) | |
|
2.500%, Senior Unsecured Notes |
|
public debt |
|
2.803 |
% |
$ |
250,000 |
|
250,000 |
|
12/15/17 |
| |
|
7.750%, Senior Unsecured Notes |
|
public debt |
|
8.017 |
% |
250,000 |
|
250,000 |
|
08/15/19 |
| ||
|
4.500%, Senior Unsecured Notes |
|
public debt |
|
4.612 |
% |
300,000 |
|
300,000 |
|
04/18/22 |
| ||
|
3.150%, Senior Unsecured Notes |
|
public debt |
|
3.517 |
% |
275,000 |
|
275,000 |
|
05/15/23 |
| ||
|
Principal balance outstanding |
|
|
|
|
|
1,075,000 |
|
1,275,000 |
|
|
| ||
|
Adjustment for unamortized debt discount |
|
|
|
|
|
(5,872 |
) |
(6,156 |
) |
|
| ||
|
Unamortized deferred financing costs |
|
|
|
|
|
(4,765 |
) |
(5,062 |
) |
|
| ||
|
Total Senior Unsecured Notes, net: |
|
|
|
|
|
$ |
1,064,363 |
|
$ |
1,263,782 |
|
|
|
|
|
|
|
|
|
|
|
|
|
|
|
| ||
|
Unsecured Term Loans: |
|
|
|
|
|
|
|
|
|
|
| ||
|
Unsecured Term Loan |
|
7 Lenders |
|
3.13 |
% |
$ |
350,000 |
|
— |
|
01/07/19 |
| |
|
Unamortized Deferred Financing Costs |
|
|
|
|
|
(2,649 |
) |
— |
|
|
| ||
|
Total Unsecured Term Loans: |
|
|
|
|
|
$ |
347,351 |
|
— |
|
|
| |
|
|
|
|
|
|
|
|
|
|
|
|
| ||
|
Revolving Credit Facilities: |
|
|
|
|
|
|
|
|
|
|
| ||
|
Unsecured Facility (c) |
|
17 Lenders |
|
LIBOR +1.300% |
|
$ |
90,000 |
|
$ |
155,000 |
|
07/31/17 |
|
|
Total Revolving Credit Facilities: |
|
|
|
|
|
$ |
90,000 |
|
$ |
155,000 |
|
|
|
|
Property Mortgages: (d) |
|
|
|
|
|
|
|
|
|
|
| ||
|
Port Imperial South (e) |
|
Wells Fargo Bank N.A. |
|
LIBOR+1.75% |
|
— |
|
$ |
34,962 |
|
01/17/2016 |
| |
|
6 Becker, 85 Livingston, 75 Livingston & 20 Waterview |
|
Wells Fargo CMBS |
|
10.260 |
% |
$ |
63,279 |
|
63,279 |
|
08/11/2014 |
(f) | |
|
9200 Edmonston Road |
|
Principal Commercial Funding, L.L.C. |
|
9.780 |
% |
3,793 |
|
3,793 |
|
05/01/2015 |
(g) | ||
|
4 Becker |
|
Wells Fargo CMBS |
|
9.550 |
% |
40,478 |
|
40,631 |
|
05/11/2016 |
| ||
|
Curtis Center (h) |
|
CCRE & PREFG |
|
LIBOR+5.912 |
%(i) |
64,000 |
|
64,000 |
|
10/09/2016 |
| ||
|
Various (j) |
|
Prudential Insurance |
|
6.332 |
% |
142,983 |
|
143,513 |
|
01/15/2017 |
| ||
|
150 Main Street (k) |
|
Webster Bank |
|
LIBOR+2.35% |
|
16,103 |
|
10,937 |
|
03/30/2017 |
| ||
|
23 Main Street |
|
JPMorgan CMBS |
|
5.587 |
% |
28,367 |
|
28,541 |
|
09/01/2018 |
| ||
|
Harborside Plaza 5 |
|
The Northwestern Mutual Life Insurance Co. & New York Life Insurance Co. |
|
6.842 |
% |
216,738 |
|
217,736 |
|
11/01/2018 |
| ||
|
100 Walnut Avenue |
|
Guardian Life Ins. Co. |
|
7.311 |
% |
18,202 |
|
18,273 |
|
02/01/2019 |
| ||
|
One River Center (l) |
|
Guardian Life Ins. Co. |
|
7.311 |
% |
41,698 |
|
41,859 |
|
02/01/2019 |
| ||
|
Park Square |
|
Wells Fargo Bank N.A. |
|
LIBOR+1.872 |
%(m) |
27,500 |
|
27,500 |
|
04/10/2019 |
| ||
|
Port Imperial South 4/5 Retail |
|
American General Life & A/G PC |
|
4.559 |
% |
4,000 |
|
4,000 |
|
12/01/2021 |
| ||
|
The Chase at Overlook Ridge |
|
New York Community Bank |
|
3.740 |
% |
72,500 |
|
— |
|
02/01/2023 |
| ||
|
Port Imperial South 4/5 Garage |
|
American General Life & A/G PC |
|
4.853 |
% |
32,600 |
|
32,600 |
|
12/01/2029 |
| ||
|
Principal balance outstanding |
|
|
|
|
|
772,241 |
|
731,624 |
|
|
| ||
|
Adjustment for unamortized debt discount |
|
|
|
|
|
(222 |
) |
(548 |
) |
|
| ||
|
Unamortized deferred financing costs |
|
|
|
|
|
(4,446 |
) |
(4,465 |
) |
|
| ||
|
Total mortgages, loans payable and other obligations, net |
|
|
|
|
|
767,573 |
|
726,611 |
|
|
| ||
|
|
|
|
|
|
|
|
|
|
|
|
| ||
|
Total Debt: |
|
|
|
|
|
$ |
2,269,287 |
|
$ |
2,145,393 |
|
|
|
(a) Includes the cost of terminated treasury lock agreements (if any), offering and other transaction costs and the discount/premium on the notes, as applicable.
(b) On January 15, 2016, the Company repaid these notes at their maturity using proceeds from a new unsecured term loan and borrowings under the Company’s unsecured revolving credit facility.
(c) Total borrowing capacity under the facility is $600 million, is expandable to $1 billion and matures in July 2017. It has two six-month extension options each requiring the payment of a 7.5 basis point fee. The interest rate on outstanding borrowings (not electing the Company’s competitive bid feature) and the facility fee on the current borrowing capacity payable quarterly in arrears are based upon the Operating Partnership’s unsecured debt ratings.
(d) Reflects effective rate of debt, including deferred financing costs, comprised of the cost of terminated treasury lock agreements (if any), debt initiation costs, mark-to-market adjustment of acquired debt and other transaction costs, as applicable.
(e) The loan was repaid in full at maturity, using borrowings from the Company’s revolving credit facility.
(f) Mortgage is cross collateralized by the four properties. On April 22, 2016, the loan was repaid for $51.5 million.
(g) Excess cash flow, as defined, is being held by the lender for re-leasing costs. The deed for the property was placed in escrow and is available to the lender in the event of default or non-payment at maturity. The mortgage loan was not repaid at maturity on May 1, 2015. The Company is in discussions with the lender regarding a further extension of the loan.
(h) The Company owns a 50 percent tenants-in-common interest in the Curtis Center Property. The Company’s $64.0 million loan consists of its 50 percent interest in a $102 million senior loan with a current rate of 3.7311 percent at March 31, 2016 and its 50 percent interest in a $26 million mezzanine loan (with a maximum borrowing capacity of $48 million) with a current rate of 9.937 percent at March 31, 2016. The senior loan rate is based on a floating rate of one-month LIBOR plus 329 basis points and the mezzanine loan rate is based on a floating rate of one-month LIBOR plus 950 basis points. The Company has entered into LIBOR caps for the periods of the loans. The loans provide for three one-year extension options.
(i) The effective interest rate includes amortization of deferred financing costs of 1.362 percent.
(j) Mortgage is cross collateralized by seven properties. The Company has agreed, subject to certain conditions, to guarantee repayment of $61.1 million of the loan.
(k) This construction loan has a maximum borrowing capacity of $28.8 million.
(l) Mortgage is collateralized by the three properties comprising One River Center.
(m) The effective interest rate includes amortization of deferred financing costs of 0.122 percent.
Mack-Cali Realty Corporation Supplemental Operating and Financial Data for the Quarter Ended March 31, 2016
Details on Financials - Joint Ventures
The following is a summary of the financial position of the unconsolidated joint ventures in which the Company had investment interests as of March 31, 2016 and December 31, 2015, respectively: (dollars in thousands)
|
|
|
March 31, |
|
December 31, |
| ||
|
|
|
2016 |
|
2015 |
| ||
|
Assets: |
|
|
|
|
| ||
|
Rental property, net |
|
$ |
1,736,842 |
|
$ |
1,781,621 |
|
|
Other assets |
|
294,444 |
|
307,000 |
| ||
|
Total assets |
|
$ |
2,031,286 |
|
$ |
2,088,621 |
|
|
Liabilities and partners’/ members’ capital: |
|
|
|
|
| ||
|
Mortgages and loans payable |
|
$ |
1,279,688 |
|
$ |
1,298,293 |
|
|
Other liabilities |
|
215,552 |
|
215,951 |
| ||
|
Partners’/members’ capital |
|
536,046 |
|
574,377 |
| ||
|
Total liabilities and partners’/members’ capital |
|
$ |
2,031,286 |
|
$ |
2,088,621 |
|
The following is a summary of the Company’s investment in unconsolidated joint ventures as of March 31, 2016 and December 31, 2015, respectively: (dollars in thousands)
|
|
|
March 31, |
|
December 31, |
| ||
|
Entity/Property Name |
|
2016 |
|
2015 |
| ||
|
Multi-family |
|
|
|
|
| ||
|
Marbella RoseGarden, L.L.C./ Marbella (c) |
|
$ |
15,486 |
|
$ |
15,569 |
|
|
RoseGarden Monaco Holdings, L.L.C./ Monaco (c) |
|
646 |
|
937 |
| ||
|
PruRose Port Imperial South 15, LLC /RiversEdge at Port Imperial (c) |
|
— |
|
— |
| ||
|
Rosewood Morristown, L.L.C. / Metropolitan at 40 Park (c) |
|
5,741 |
|
5,723 |
| ||
|
PruRose Riverwalk G, L.L.C./ RiverTrace at Port Imperial (c) |
|
— |
|
— |
| ||
|
Elmajo Urban Renewal Associates, LLC / Lincoln Harbor (Bldg A&C) (c) |
|
— |
|
— |
| ||
|
Crystal House Apartments Investors LLC / Crystal House |
|
28,855 |
|
28,114 |
| ||
|
Portside Master Company, L.L.C./ Portside at Pier One - Bldg 7 (c) |
|
— |
|
— |
| ||
|
PruRose Port Imperial South 13, LLC / RiverParc at Port Imperial (c) |
|
— |
|
— |
| ||
|
Roseland/Port Imperial Partners, L.P./ Riverwalk C (c) |
|
1,678 |
|
1,678 |
| ||
|
RoseGarden Marbella South, L.L.C./ Marbella II |
|
17,155 |
|
16,728 |
| ||
|
Estuary Urban Renewal Unit B, LLC / Lincoln Harbor (Bldg B) (c) |
|
— |
|
— |
| ||
|
Riverpark at Harrison I, L.L.C./ Riverpark at Harrison |
|
2,426 |
|
2,544 |
| ||
|
Capitol Place Mezz LLC / Station Townhouses |
|
45,500 |
|
46,267 |
| ||
|
Harborside Unit A Urban Renewal, L.L.C. / URL Harborside |
|
97,615 |
|
96,799 |
| ||
|
RoseGarden Monaco, L.L.C./ San Remo Land |
|
1,356 |
|
1,339 |
| ||
|
Grand Jersey Waterfront URA, L.L.C./ Liberty Landing |
|
337 |
|
337 |
| ||
|
Hillsborough 206 Holdings, L.L.C. /Hillsborough 206 |
|
1,962 |
|
1,962 |
| ||
|
Plaza VIII & IX Associates, L.L.C./Vacant land (parking operations) |
|
4,132 |
|
4,055 |
| ||
|
Office |
|
|
|
|
| ||
|
Red Bank Corporate Plaza, L.L.C./ Red Bank |
|
4,250 |
|
4,140 |
| ||
|
12 Vreeland Associates, L.L.C./ 12 Vreeland Road |
|
5,974 |
|
5,890 |
| ||
|
BNES Associates III / Offices at Crystal Lake |
|
2,101 |
|
2,295 |
| ||
|
KPG-P 100 IMW JV, LLC / 100 Independence Mall West |
|
— |
|
— |
| ||
|
Keystone-Penn (c) |
|
— |
|
— |
| ||
|
Keystone-TriState (c) (d) |
|
3,480 |
|
3,958 |
| ||
|
KPG-MCG Curtis JV, L.L.C./ Curtis Center (a) |
|
62,247 |
|
59,858 |
| ||
|
Other |
|
|
|
|
| ||
|
Roseland/North Retail, L.L.C./ Riverwalk at Port Imperial (c) |
|
1,742 |
|
1,758 |
| ||
|
South Pier at Harborside / Hyatt Regency Jersey City on the Hudson (b) |
|
— |
|
— |
| ||
|
Other |
|
964 |
|
3,506 |
| ||
|
Company’s investment in unconsolidated joint ventures |
|
$ |
303,647 |
|
$ |
303,457 |
|
(a) Includes undivided interests in the same manner as investments in noncontrolled partnerships, pursuant to ASC 810.
(b) The negative investment balance for this joint venture of $4,235 and $3,317 as of March 31, 2016 and December 31, 2015, respectively, were included in accounts payable, accrued expenses and other liabilities.
(c) The Company’s ownership interests in this venture are subordinate to its partner’s preferred capital balance and the Company is not expected to meaningfully participate in the venture’s cash flows in the near term.
(d) Includes Company’s pari-passu interests in five properties.
(e) Company’s interests in the unconsolidated joint ventures were sold during the quarter ended March 31, 2016.
Mack-Cali Realty Corporation Supplemental Operating and Financial Data for the Quarter Ended March 31, 2016
Details on Financials - Joint Ventures
The following is a summary of the results of operations of the unconsolidated joint ventures for the period in which the Company had investment interests for the three months ended March 31, 2016 and 2015, respectively: (dollars in thousands)
|
|
|
Three Months Ended |
| ||||
|
|
|
March 31, |
| ||||
|
|
|
2016 |
|
2015 |
| ||
|
Total revenues |
|
$ |
70,122 |
|
$ |
74,477 |
|
|
Operating and other expenses |
|
(45,561 |
) |
(57,356 |
) | ||
|
Depreciation and amortization |
|
(18,842 |
) |
(16,993 |
) | ||
|
Interest expense |
|
(14,049 |
) |
(11,334 |
) | ||
|
Net loss |
|
$ |
(8,330 |
) |
$ |
(11,206 |
) |
The following is a summary of the Company’s equity in earnings (loss) of unconsolidated joint ventures for the three months March 31, 2016 and 2015, respectively: (dollars in thousands)
|
|
|
Three Months Ended |
| ||||
|
|
|
March 31, |
| ||||
|
Entity/Property Name |
|
2016 |
|
2015 |
| ||
|
Multi-family |
|
|
|
|
| ||
|
Marbella RoseGarden, L.L.C./ Marbella (a) |
|
$ |
84 |
|
$ |
61 |
|
|
RoseGarden Monaco Holdings, L.L.C./ Monaco (a) |
|
(291 |
) |
(317 |
) | ||
|
Rosewood Lafayette Holdings, L.L.C./ Highlands at Morristown Station (a) |
|
— |
|
— |
| ||
|
PruRose Port Imperial South 15, LLC /RiversEdge at Port Imperial (a) |
|
— |
|
— |
| ||
|
Rosewood Morristown, L.L.C. / Metropolitan at 40 Park (a) |
|
(81 |
) |
(94 |
) | ||
|
PruRose Riverwalk G, L.L.C./ RiverTrace at Port Imperial (a) |
|
— |
|
(254 |
) | ||
|
Elmajo Urban Renewal Associates, LLC / Lincoln Harbor (Bldg A&C) (a) |
|
— |
|
— |
| ||
|
Crystal House Apartments Investors LLC / Crystal House |
|
(112 |
) |
(10 |
) | ||
|
Portside Master Company, L.L.C./ Portside at Pier One - Bldg 7 (a) |
|
— |
|
(719 |
) | ||
|
PruRose Port Imperial South 13, LLC / RiverParc Port Imperial (a) |
|
— |
|
(225 |
) | ||
|
Roseland/Port Imperial Partners, L.P./ Riverwalk C (a) |
|
— |
|
(184 |
) | ||
|
RoseGarden Marbella South, L.L.C./ Marbella II |
|
— |
|
— |
| ||
|
Estuary Urban Renewal Unit B, LLC / Lincoln Harbor (Bldg B) (a) |
|
— |
|
— |
| ||
|
Riverpark at Harrison I, L.L.C./ Riverpark at Harrison |
|
(28 |
) |
(173 |
) | ||
|
Capitol Place Mezz LLC / Station Townhouses |
|
(767 |
) |
75 |
| ||
|
Harborside Unit A Urban Renewal, L.L.C. / URL Harborside |
|
(17 |
) |
— |
| ||
|
RoseGarden Monaco, L.L.C./ San Remo Land |
|
— |
|
— |
| ||
|
Grand Jersey Waterfront URA, L.L.C./ Liberty Landing |
|
(60 |
) |
(19 |
) | ||
|
Hillsborough 206 Holdings, L.L.C./ Hillsborough 206 |
|
(19 |
) |
— |
| ||
|
Plaza VIII & IX Associates, L.L.C./ Vacant land (parking operations) |
|
77 |
|
86 |
| ||
|
Office |
|
|
|
|
| ||
|
Red Bank Corporate Plaza, L.L.C./ Red Bank |
|
101 |
|
110 |
| ||
|
12 Vreeland Associates, L.L.C./ 12 Vreeland Road |
|
84 |
|
(14 |
) | ||
|
BNES Associates III / Offices at Crystal Lake |
|
(194 |
) |
68 |
| ||
|
KPG-P 100 IMW JV, LLC / 100 Independence Mall West |
|
— |
|
(384 |
) | ||
|
Keystone-Penn (a) |
|
— |
|
— |
| ||
|
Keystone-TriState (a) |
|
(477 |
) |
(1,348 |
) | ||
|
KPG-MCG Curtis JV, L.L.C./ Curtis Center |
|
179 |
|
196 |
| ||
|
Other |
|
|
|
|
| ||
|
Roseland/North Retail, L.L.C./ Riverwalk at Port Imperial (a) |
|
(16 |
) |
(18 |
) | ||
|
South Pier at Harborside / Hyatt Regency Jersey City on the Hudson |
|
(167 |
) |
(84 |
) | ||
|
Other |
|
150 |
|
(282 |
) | ||
|
Company’s equity in earnings (loss) of unconsolidated joint ventures |
|
$ |
(1,554 |
) |
$ |
(3,529 |
) |
(a) The Company’s ownership interests in this venture are subordinate to its partner’s preferred capital balance and the Company is not expected to meaningfully participate in the venture’s cash flows in the near term.
Mack-Cali Realty Corporation Supplemental Operating and Financial Data for the Quarter Ended March 31, 2016
Details on Financials - Joint Ventures
The following is a summary of the Company’s funds from operations of unconsolidated joint ventures for the three months ended March 31, 2016 and 2015, respectively: (dollars in thousands)
|
|
|
Three Months Ended |
| ||||
|
|
|
March 31, |
| ||||
|
Entity/Property Name |
|
2016 |
|
2015 |
| ||
|
Multi-family |
|
|
|
|
| ||
|
Marbella RoseGarden, L.L.C./ Marbella (a) |
|
$ |
350 |
|
$ |
317 |
|
|
RoseGarden Monaco Holdings, L.L.C./ Monaco (a) |
|
27 |
|
(4 |
) | ||
|
PruRose Port Imperial South 15, LLC /RiversEdge at Port Imperial (a) |
|
— |
|
— |
| ||
|
Rosewood Morristown, L.L.C. / Metropolitan at 40 Park (a) |
|
13 |
|
1 |
| ||
|
PruRose Riverwalk G, L.L.C./ RiverTrace at Port Imperial (a) |
|
— |
|
(26 |
) | ||
|
Elmajo Urban Renewal Associates, LLC / Lincoln Harbor (Bldg A&C) (a) |
|
119 |
|
— |
| ||
|
Crystal House Apartments Investors LLC / Crystal House |
|
181 |
|
282 |
| ||
|
Portside Master Company, L.L.C./ Portside at Pier One - Bldg 7 (a) |
|
225 |
|
(463 |
) | ||
|
PruRose Port Imperial South 13, LLC / RiverParc Port Imperial (a) |
|
— |
|
(225 |
) | ||
|
Roseland/Port Imperial Partners, L.P./ Riverwalk C (a) |
|
— |
|
(185 |
) | ||
|
RoseGarden Marbella South, L.L.C./ Marbella II |
|
— |
|
— |
| ||
|
Estuary Urban Renewal Unit B, LLC / Lincoln Harbor (Bldg B) (a) |
|
— |
|
— |
| ||
|
Riverpark at Harrison I, L.L.C./ Riverpark at Harrison |
|
74 |
|
(88 |
) | ||
|
Capitol Place Mezz LLC / Station Townhouses |
|
37 |
|
75 |
| ||
|
Harborside Unit A Urban Renewal, L.L.C. / URL Harborside |
|
(17 |
) |
— |
| ||
|
RoseGarden Monaco, L.L.C./ San Remo Land |
|
— |
|
— |
| ||
|
Grand Jersey Waterfront URA, L.L.C./ Liberty Landing |
|
(60 |
) |
(20 |
) | ||
|
Hillsborough 206 Holdings, L.L.C./ Hillsborough 206 |
|
(19 |
) |
— |
| ||
|
Plaza VIII & IX Associates, L.L.C./ Vacant land (parking operations) |
|
83 |
|
92 |
| ||
|
Office |
|
|
|
|
| ||
|
Red Bank Corporate Plaza, L.L.C./ Red Bank |
|
218 |
|
227 |
| ||
|
12 Vreeland Associates, L.L.C./ 12 Vreeland Road |
|
168 |
|
71 |
| ||
|
BNES Associates III / Offices at Crystal Lake |
|
(166 |
) |
92 |
| ||
|
KPG-P 100 IMW JV, LLC / 100 Independence Mall West |
|
— |
|
(202 |
) | ||
|
Keystone-Penn (a) |
|
— |
|
— |
| ||
|
Keystone-TriState (a) |
|
15 |
|
(31 |
) | ||
|
KPG-MCG Curtis JV, L.L.C./ Curtis Center |
|
1,085 |
|
1,159 |
| ||
|
Other |
|
|
|
|
| ||
|
Roseland/North Retail, L.L.C./ Riverwalk at Port Imperial (a) |
|
5 |
|
3 |
| ||
|
South Pier at Harborside / Hyatt Regency Jersey City on the Hudson |
|
579 |
|
724 |
| ||
|
Other |
|
150 |
|
142 |
| ||
|
Company’s funds from operations of unconsolidated joint ventures |
|
$ |
3,067 |
|
$ |
1,941 |
|
(a) The Company’s ownership interests in this venture are subordinate to its partner’s preferred capital balance and the Company is not expected to meaningfully participate in the venture’s cash flows in the near term.
Mack-Cali Realty Corporation Supplemental Operating and Financial Data for the Quarter Ended March 31, 2016
Details on Portfolio - Stats
(as of March 31, 2016)
Breakdown by Number of Properties
|
|
|
|
|
|
|
|
|
|
|
|
|
|
|
Stand- |
|
|
|
|
|
|
|
|
|
|
|
|
|
|
|
|
|
|
|
|
% of |
|
|
|
% of |
|
Industrial/ |
|
% of |
|
Alone |
|
% of |
|
Land |
|
% of |
|
Multi- |
|
% of |
|
Totals |
|
% of |
|
|
STATE |
|
Office |
|
Total |
|
Office/Flex |
|
Total |
|
Warehouse |
|
Total |
|
Retail |
|
Total |
|
Leases |
|
Total |
|
Family |
|
Total |
|
By State |
|
Total |
|
|
New Jersey |
|
87 |
|
39.2 |
% |
48 |
|
21.6 |
% |
— |
|
— |
|
1 |
|
0.5 |
% |
— |
|
— |
|
3 |
|
1.4 |
% |
139 |
|
62.7 |
% |
|
New York |
|
13 |
|
5.8 |
% |
41 |
|
18.4 |
% |
6 |
|
2.7 |
% |
2 |
|
0.9 |
% |
2 |
|
0.9 |
% |
— |
|
— |
|
64 |
|
28.7 |
% |
|
Connecticut |
|
— |
|
— |
|
5 |
|
2.3 |
% |
— |
|
— |
|
— |
|
— |
|
— |
|
— |
|
— |
|
— |
|
5 |
|
2.3 |
% |
|
Wash., D.C./Maryland |
|
9 |
|
4.1 |
% |
— |
|
— |
|
— |
|
— |
|
— |
|
— |
|
1 |
|
0.5 |
% |
— |
|
— |
|
10 |
|
4.6 |
% |
|
Massachusetts |
|
— |
|
— |
|
— |
|
— |
|
— |
|
— |
|
— |
|
— |
|
— |
|
— |
|
4 |
|
1.7 |
% |
4 |
|
1.7 |
% |
|
TOTALS |
|
|
|
|
|
|
|
|
|
|
|
|
|
|
|
|
|
|
|
|
|
|
|
|
|
|
|
|
|
|
By Type: |
|
109 |
|
49.1 |
% |
94 |
|
42.3 |
% |
6 |
|
2.7 |
% |
3 |
|
1.4 |
% |
3 |
|
1.4 |
% |
7 |
|
3.1 |
% |
222 |
|
100.0 |
% |
(a) Excludes 51 operating properties, aggregating approximately 5.7 million of commercial square feet and 3,972 apartment homes, which are not consolidated by the Company.
Breakdown by Square Footage for Consolidated Commercial Properties
|
|
|
|
|
|
|
|
|
|
|
|
|
|
|
Stand- |
|
|
|
|
|
|
|
|
|
|
|
|
% of |
|
|
|
% of |
|
Industrial/ |
|
% of |
|
Alone |
|
% of |
|
Totals |
|
% of |
|
|
STATE |
|
Office |
|
Total |
|
Office/Flex |
|
Total |
|
Warehouse |
|
Total |
|
Retail |
|
Total |
|
By State |
|
Total |
|
|
New Jersey |
|
15,967,683 |
|
66.6 |
% |
2,167,931 |
|
9.0 |
% |
— |
|
— |
|
16,736 |
|
0.1 |
% |
18,152,350 |
|
75.7 |
% |
|
New York |
|
1,666,876 |
|
7.0 |
% |
2,348,812 |
|
9.8 |
% |
387,400 |
|
1.6 |
% |
17,300 |
|
0.1 |
% |
4,420,388 |
|
18.5 |
% |
|
Connecticut |
|
— |
|
— |
|
273,000 |
|
1.1 |
% |
— |
|
— |
|
— |
|
— |
|
273,000 |
|
1.1 |
% |
|
Wash., D.C./Maryland |
|
1,123,258 |
|
4.7 |
% |
— |
|
— |
|
— |
|
— |
|
— |
|
— |
|
1,123,258 |
|
4.7 |
% |
|
TOTALS |
|
|
|
|
|
|
|
|
|
|
|
|
|
|
|
|
|
|
|
|
|
|
By Type: |
|
18,757,817 |
|
78.3 |
% |
4,789,743 |
|
19.9 |
% |
387,400 |
|
1.6 |
% |
34,036 |
|
0.2 |
% |
23,968,996 |
|
100.0 |
% |
(a) Excludes seven consolidated operating multi-family properties, aggregating 1,672 apartment homes; as well as 51 operating properties, aggregating approximately 5.7 million commercial square feet and 3,972 apartment homes, which are not consolidated by the Company.
Mack-Cali Realty Corporation Supplemental Operating and Financial Data for the Quarter Ended March 31, 2016
Details on Portfolio - Stats
(12 months ended March 31, 2016)
Breakdown by Base Rental Revenue (a)
(dollars in thousands)
|
|
|
|
|
|
|
|
|
|
|
|
|
|
|
Stand- |
|
|
|
|
|
|
|
|
|
|
|
|
|
|
| |||||||
|
|
|
|
|
% of |
|
Office/ |
|
% of |
|
Indust./ |
|
% of |
|
Alone |
|
% of |
|
Land |
|
% of |
|
Multi- |
|
% of |
|
Totals |
|
% of |
| |||||||
|
STATE |
|
Office |
|
Total |
|
Flex |
|
Total |
|
Warehouse |
|
Total |
|
Retail |
|
Total |
|
Leases |
|
Total |
|
Family |
|
Total |
|
By State |
|
Total |
| |||||||
|
|
|
|
|
|
|
|
|
|
|
|
|
|
|
|
|
|
|
|
|
|
|
|
|
|
|
|
|
|
| |||||||
|
New Jersey |
|
$ |
328,479 |
|
68.4 |
% |
$ |
18,058 |
|
3.8 |
% |
— |
|
— |
|
— |
|
— |
|
— |
|
— |
|
$ |
7,135 |
|
1.5 |
% |
$ |
353,672 |
|
73.7 |
% | |||
|
New York |
|
43,518 |
|
9.1 |
% |
34,339 |
|
7.1 |
% |
$ |
4,402 |
|
0.9 |
% |
$ |
444 |
|
0.1 |
% |
$ |
362 |
|
0.1 |
% |
— |
|
— |
|
83,065 |
|
17.3 |
% | ||||
|
Connecticut |
|
— |
|
— |
|
4,092 |
|
0.9 |
% |
— |
|
— |
|
— |
|
— |
|
— |
|
— |
|
— |
|
— |
|
4,092 |
|
0.9 |
% | |||||||
|
Wash., D.C./Maryland |
|
20,386 |
|
4.2 |
% |
— |
|
— |
|
— |
|
— |
|
— |
|
— |
|
153 |
|
— |
|
— |
|
— |
|
20,539 |
|
4.2 |
% | |||||||
|
Massachusetts |
|
— |
|
— |
|
— |
|
— |
|
— |
|
— |
|
— |
|
— |
|
— |
|
— |
|
18,904 |
|
3.9 |
% |
18,904 |
|
3.9 |
% | |||||||
|
TOTALS |
|
|
|
|
|
|
|
|
|
|
|
|
|
|
|
|
|
|
|
|
|
|
|
|
|
|
|
|
| |||||||
|
By Type: |
|
$ |
392,383 |
|
81.7 |
% |
$ |
56,489 |
|
11.8 |
% |
$ |
4,402 |
|
0.9 |
% |
$ |
444 |
|
0.1 |
% |
$ |
515 |
|
0.1 |
% |
$ |
26,039 |
|
5.4 |
% |
$ |
480,272 |
(c) |
100.0 |
% |
(a) Excludes 51 operating properties, aggregating approximately 5.7 million commercial square feet and 3,972 apartment homes, which are not consolidated by the Company.
Total base rent for the year ended March 31, 2016, determined in accordance with GAAP. Substantially all of the commercial leases provide for annual base rents plus recoveries and escalation charges based upon the tenants’ proportionate share of and/or increases in real estate taxes and certain costs, as defined, and the pass through of charges for electrical usage.
(b) Excludes $9.4 million from properties which were sold during the 12 months ended March 31, 2016.
Breakdown by Percentage Leased for Commercial Properties
|
|
|
|
|
|
|
|
|
|
|
Weighted Avg. |
|
|
STATE |
|
Office |
|
Office/Flex |
|
Industrial/Warehouse |
|
Stand-Alone Retail |
|
By State |
|
|
New Jersey |
|
86.7 |
% |
89.1 |
% |
— |
|
35.3 |
% |
86.9 |
% |
|
New York |
|
91.2 |
% |
92.8 |
% |
97.9 |
% |
100.0 |
% |
92.7 |
% |
|
Connecticut |
|
— |
|
96.3 |
% |
— |
|
— |
|
96.3 |
% |
|
Washington, D.C./ Maryland |
|
68.5 |
% |
— |
|
— |
|
— |
|
68.5 |
% |
|
|
|
|
|
|
|
|
|
|
|
|
|
|
WEIGHTED AVG. By Type: |
|
86.0 |
% |
91.3 |
% |
97.9 |
% |
68.2 |
% |
87.2 |
% |
(a) Excludes seven consolidated operating multi-family properties, aggregating 1,672 apartment homes; as well as 51 operating properties, aggregating approximately 5.7 million commercial square feet and 3,972 apartment homes, which are not consolidated by the Company, and parcels of land leased to others.
Percentage leased includes all commercial leases in effect as of the period end date, some of which have commencement dates in the future as well as leases expiring March 31, 2016, aggregating 159,415 square feet for which no new leases were signed.
Mack-Cali Realty Corporation Supplemental Operating and Financial Data for the Quarter Ended March 31, 2016
Details on Portfolio - Land for Commercial Development
(as of March 31, 2016)
|
|
|
|
|
|
|
Potential |
|
|
|
|
|
|
|
|
|
|
Commercial |
|
|
|
|
Property |
|
Location |
|
Type of space |
|
Square Feet (a) |
|
Comments |
|
|
Office: |
|
|
|
|
|
|
|
|
|
|
Harborside |
|
Jersey City, NJ |
|
Office |
|
1,067,000 |
|
Adjacent to URL J.V. development. Fully entitled. |
|
|
Plaza VIII & IX Associates, LLC (b) |
|
Jersey City, NJ |
|
Office |
|
1,225,000 |
|
Adjacent to URL J.V. development. Zoning approved. |
|
|
Princeton Metro |
|
West Windsor, NJ |
|
Office |
|
97,000 |
|
Land adjacent to Princeton train station. Fully entitled. |
|
|
Princeton Overlook II |
|
West Windsor, NJ |
|
Office |
|
149,500 |
|
Land adjacent to existing same-size building. Fully entitled. |
|
|
Mack-Cali Princeton Executive Park |
|
West Windsor, NJ |
|
Office/Hotel |
|
760,000 |
|
Large development parcel with mixed-use potential. Fully entitled. |
|
|
Mack-Cali Business Campus |
|
Parsippany & Hanover, NJ |
|
Office/Retail |
|
274,000 |
|
Adjacent to existing office park. Partially Entitled. |
|
|
AAA Drive and South Gold Drive (c ) |
|
Hamilton Township, NJ |
|
Office |
|
219,000 |
|
Land part of existing office park. Zoning in place. Concept plans done. |
|
|
Hillsborough 206 (b) |
|
Hillsborough, NJ |
|
Office |
|
160,000 |
|
Concept plans done. |
|
|
Capital Office Park/Eastpoint II |
|
Greenbelt & Lanham, MD |
|
Office/Hotel |
|
717,000 |
|
Various parcels, offer flexibility of building size/type. Fully entitled. |
|
|
Total Office: |
|
|
|
|
|
4,668,500 |
|
|
|
|
|
|
|
|
|
|
|
|
|
|
|
Flex: |
|
|
|
|
|
|
|
|
|
|
Horizon Center |
|
Hamilton Township, NJ |
|
Flex |
|
68,000 |
|
Land part of existing office park. Zoning in place. Concept plans done. |
|
|
Mack-Cali Commercenter |
|
Totowa, NJ |
|
Flex |
|
30,000 |
|
Land part of existing office park. Fully entitled. |
|
|
Mid-Westchester Executive Park and South Westchester Executive Park (d) |
|
Hawthorne & Yonkers, NY |
|
Flex |
|
482,250 |
|
Land part of existing office park. Partially entitled. Concept plans done. |
|
|
Total Flex: |
|
|
|
|
|
580,250 |
|
|
|
|
|
|
|
|
|
|
|
|
|
|
|
Industrial/Warehouse: |
|
|
|
|
|
|
|
|
|
|
Elmsford Distribution Center (d) |
|
Elmsford, NY |
|
Industrial/Warehouse |
|
100,000 |
|
Land part of existing office park. Concept plans done. |
|
|
Total Industrial/Warehouse: |
|
|
|
|
|
100,000 |
|
|
|
|
|
|
|
|
|
|
|
|
|
|
|
Total: |
|
|
|
|
|
5,348,750 |
|
|
|
(a) Amount of square feet is subject to change.
(b) Land owned or controlled by joint venture in which Mack-Cali is an equity partner.
(c) These land parcels also includes existing office buildings totaling 35,270 and 33,962 square feet.
(d) Mack-Cali holds an option to purchase this land.
Mack-Cali Realty Corporation Supplemental Operating and Financial Data for the Quarter Ended March 31, 2016
Details on Portfolio - Significant Tenants
The following table sets forth a schedule of the Company’s 50 largest tenants for the Consolidated Commercial Properties as of March 31, 2016, based upon annualized base rental revenue:
|
|
|
|
|
|
|
Percentage of |
|
|
|
|
|
|
|
|
|
|
|
|
Annualized |
|
Company |
|
Square |
|
Percentage |
|
Year of |
|
|
|
|
Number of |
|
Base Rental |
|
Annualized Base |
|
Feet |
|
Total Company |
|
Lease |
|
|
|
|
Properties |
|
Revenue ($) (a) |
|
Rental Revenue (%) |
|
Leased |
|
Leased Sq. Ft. (%) |
|
Expiration |
|
|
|
|
|
|
|
|
|
|
|
|
|
|
|
|
|
DB Services New Jersey, Inc. |
|
2 |
|
12,335,217 |
|
2.6 |
|
409,166 |
|
2.1 |
|
2017 |
|
|
National Union Fire Insurance Company of Pittsburgh, PA |
|
2 |
|
11,191,058 |
|
2.4 |
|
388,651 |
|
2.0 |
|
(b) |
|
|
Bank Of Tokyo-Mitsubishi FUJI, Ltd. |
|
1 |
|
10,540,716 |
|
2.1 |
|
282,606 |
|
1.5 |
|
(c) |
|
|
United States of America-GSA |
|
12 |
|
9,357,707 |
|
1.9 |
|
287,169 |
|
1.5 |
|
(d) |
|
|
Forest Research Institute, Inc. |
|
1 |
|
9,070,892 |
|
1.8 |
|
215,659 |
|
1.2 |
|
2017 |
|
|
ICAP Securities USA, LLC |
|
2 |
|
7,608,702 |
|
1.5 |
|
180,946 |
|
0.9 |
|
(e) |
|
|
Montefiore Medical Center |
|
7 |
|
7,441,926 |
|
1.5 |
|
314,049 |
|
1.5 |
|
(f) |
|
|
Merrill Lynch Pierce Fenner |
|
2 |
|
7,361,877 |
|
1.5 |
|
397,563 |
|
1.9 |
|
(g) |
|
|
KPMG, LLP |
|
3 |
|
6,483,411 |
|
1.3 |
|
224,364 |
|
1.1 |
|
(h) |
|
|
Daiichi Sankyo, Inc. |
|
1 |
|
6,381,982 |
|
1.3 |
|
171,900 |
|
0.8 |
|
2022 |
|
|
TD Ameritrade Online Holdings |
|
1 |
|
6,381,330 |
|
1.3 |
|
193,873 |
|
0.9 |
|
2020 |
|
|
HQ Global Workplaces, LLC |
|
15 |
|
5,020,722 |
|
1.0 |
|
244,120 |
|
1.2 |
|
(i) |
|
|
CohnReznick, LLP |
|
3 |
|
4,983,681 |
|
1.0 |
|
170,141 |
|
0.8 |
|
(j) |
|
|
New Cingular Wireless PCS, LLC |
|
2 |
|
4,841,564 |
|
1.0 |
|
212,816 |
|
1.0 |
|
(k) |
|
|
Vonage America, Inc. |
|
1 |
|
4,515,000 |
|
0.9 |
|
350,000 |
|
1.7 |
|
2023 |
|
|
Arch Insurance Company |
|
1 |
|
4,005,563 |
|
0.8 |
|
106,815 |
|
0.5 |
|
2024 |
|
|
AECOM Technology Corporation |
|
1 |
|
3,707,752 |
|
0.7 |
|
91,414 |
|
0.4 |
|
2029 |
|
|
Brown Brothers Harriman & Co. |
|
1 |
|
3,673,536 |
|
0.7 |
|
114,798 |
|
0.6 |
|
2026 |
|
|
Morgan Stanley Smith Barney |
|
3 |
|
3,665,965 |
|
0.7 |
|
129,896 |
|
0.6 |
|
(l) |
|
|
UBS Financial Services, Inc. |
|
3 |
|
3,606,759 |
|
0.7 |
|
127,429 |
|
0.6 |
|
(m) |
|
|
Allstate Insurance Company |
|
5 |
|
3,250,962 |
|
0.7 |
|
135,816 |
|
0.7 |
|
(n) |
|
|
SunAmerica Asset Management, LLC |
|
1 |
|
3,167,756 |
|
0.6 |
|
69,621 |
|
0.3 |
|
2018 |
|
|
Alpharma, LLC |
|
1 |
|
3,142,580 |
|
0.6 |
|
112,235 |
|
0.5 |
|
2018 |
|
|
Tullett Prebon Holdings Corp. |
|
1 |
|
3,127,970 |
|
0.6 |
|
100,759 |
|
0.5 |
|
2023 |
|
|
TierPoint New York, LLC |
|
2 |
|
3,014,150 |
|
0.6 |
|
131,078 |
|
0.6 |
|
2024 |
|
|
E*Trade Financial Corporation |
|
1 |
|
2,930,757 |
|
0.6 |
|
106,573 |
|
0.5 |
|
2022 |
|
|
Natixis North America, Inc. |
|
1 |
|
2,823,569 |
|
0.6 |
|
89,907 |
|
0.4 |
|
2021 |
|
|
AAA Mid-Atlantic, Inc. |
|
2 |
|
2,779,829 |
|
0.6 |
|
129,784 |
|
0.6 |
|
(o) |
|
|
SUEZ Water Management & Services, Inc. |
|
1 |
|
2,727,383 |
|
0.5 |
|
121,217 |
|
0.6 |
|
(p) |
|
|
Plymouth Rock Management Company of New Jersey |
|
2 |
|
2,725,811 |
|
0.5 |
|
106,618 |
|
0.5 |
|
2020 |
|
|
Tradeweb Markets, LLC |
|
1 |
|
2,721,070 |
|
0.5 |
|
65,242 |
|
0.3 |
|
2027 |
|
|
New Jersey Turnpike Authority |
|
1 |
|
2,605,798 |
|
0.5 |
|
100,223 |
|
0.5 |
|
2017 |
|
|
Continental Casualty Company |
|
2 |
|
2,596,584 |
|
0.5 |
|
94,224 |
|
0.5 |
|
(q) |
|
|
Lowenstein Sandler LLP |
|
1 |
|
2,565,602 |
|
0.5 |
|
98,677 |
|
0.5 |
|
2017 |
|
|
Connell Foley, LLP |
|
2 |
|
2,520,674 |
|
0.5 |
|
95,130 |
|
0.5 |
|
(r) |
|
|
AMTrust Financial Services, Inc. |
|
1 |
|
2,460,544 |
|
0.5 |
|
76,892 |
|
0.4 |
|
2023 |
|
|
Bunge Management Services, Inc. |
|
1 |
|
2,372,387 |
|
0.5 |
|
91,509 |
|
0.4 |
|
(s) |
|
|
Movado Group, Inc. |
|
1 |
|
2,359,824 |
|
0.5 |
|
98,326 |
|
0.5 |
|
2018 |
|
|
Bozzuto & Associates, Inc. |
|
1 |
|
2,359,542 |
|
0.5 |
|
104,636 |
|
0.5 |
|
2025 |
|
|
Herzfeld & Rubin, P.C. |
|
1 |
|
2,337,363 |
|
0.5 |
|
56,322 |
|
0.3 |
|
2030 |
|
|
Savvis Communications Corporation |
|
1 |
|
2,287,168 |
|
0.5 |
|
71,474 |
|
0.3 |
|
2025 |
|
|
Norris, McLaughlin & Marcus, PA |
|
1 |
|
2,259,738 |
|
0.5 |
|
86,913 |
|
0.4 |
|
2017 |
|
|
Barr Laboratories, Inc. |
|
1 |
|
2,209,107 |
|
0.4 |
|
89,510 |
|
0.4 |
|
2016 |
|
|
Sumitomo Mitsui Banking Corp. |
|
2 |
|
2,170,167 |
|
0.4 |
|
71,153 |
|
0.3 |
|
2021 |
|
|
Hackensack University Health Network Inc. and Meridian Health System, Inc. |
|
1 |
|
2,137,380 |
|
0.4 |
|
61,068 |
|
0.3 |
|
2027 |
|
|
New Jersey City University |
|
1 |
|
2,084,614 |
|
0.4 |
|
68,348 |
|
0.3 |
|
2035 |
|
|
Sun Chemical Management, LLC |
|
1 |
|
2,034,798 |
|
0.4 |
|
66,065 |
|
0.3 |
|
2019 |
|
|
Syncsort, Inc. |
|
1 |
|
1,991,439 |
|
0.4 |
|
73,757 |
|
0.4 |
|
2018 |
|
|
Jeffries, LLC |
|
1 |
|
1,945,653 |
|
0.4 |
|
62,763 |
|
0.3 |
|
2023 |
|
|
GBT US, LLC |
|
1 |
|
1,920,566 |
|
0.4 |
|
49,563 |
|
0.2 |
|
2026 |
|
|
Totals |
|
|
|
207,806,145 |
|
41.8 |
|
7,298,778 |
|
35.6 |
|
|
|
See footnotes on subsequent page.
Mack-Cali Realty Corporation Supplemental Operating and Financial Data for the Quarter Ended March 31, 2016
Details on Portfolio - Significant Tenants
Footnotes for prior page:
(a) Annualized base rental revenue is based on actual March 2016 billings times 12. For leases whose rent commences after April 1, 2016, annualized base rental revenue is based on the first full month’s billing times 12. As annualized base rental revenue is not derived from historical GAAP results, historical results may differ from those set forth above.
(b) 271,533 square feet expire in 2018; 117,118 square feet expire in 2019.
(c) 20,649 square feet expire in 2018; 24,607 square feet expire in 2019; 237,350 square feet expire in 2029.
(d) 70,163 square feet expire in 2016; 147,606 square feet expire in 2018; 28,102 square feet expire in 2020; 21,596 square feet expire in 2022; 19,702 square feet expire in 2023.
(e) 159,834 square feet expire in 2017; 21,112 square feet expire in 2025.
(f) 26,535 square feet expire in 2016; 47,384 square feet expire in 2017; 64,815 square feet expire in 2018; 133,763 square feet expire in 2019; 8,600 square feet expire in 2020; 14,842 square feet expire in 2021; 9,610 square feet expire in 2022; 8,500 square feet expire in 2023.
(g) 9,356 square feet expire in 2019; 388,207 square feet expire in 2027.
(h) 88,652 square feet expire in 2017; 81,371 square feet expire in 2019; 54,341 square feet expire in 2026.
(i) 12,407 square feet expire in 2017; 41,549 square feet expire in 2019; 21,008 square feet expire in 2020; 32,579 square feet expire in 2021; 15,523 square feet expire in 2023; 105,646 square feet expire in 2024; 15,408 square feet expire in 2027.
(j) 15,085 square feet expire in 2017; 1,021 square feet expire in 2018; 154,035 square feet expire in 2020.
(k) 65,751 square feet expire in 2016; 147,065 square feet expire in 2018.
(l) 26,262 square feet expire in 2018; 61,239 square feet expire in 2025; 42,395 square feet expire in 2026.
(m) 42,360 square feet expire in 2016; 13,340 square feet expire in 2022; 26,713 square feet expire in 2024; 45,016 square feet expire in 2026.
(n) 4,014 square feet expire in 2016; 75,740 square feet expire in 2017; 51,606 square feet expire in 2018; 4,456 square feet in 2019.
(o) 9,784 square feet expire in 2017; 120,000 square feet expire in 2027.
(p) 4,857 square feet expire in 2016; 116,360 square feet expire in 2035.
(q) 19,416 square feet expire in 2016; 74,808 square feet expire in 2031.
(r) 77,719 square feet expire in 2016; 17,411 square feet expire in 2026.
(s) 25,206 square feet expire in 2016; 66,303 square feet expire in 2025.
Mack-Cali Realty Corporation Supplemental Operating and Financial Data for the Quarter Ended March 31, 2016
Details on Portfolio - Markets
As noted below, the Company’s top four markets currently account for over 74 percent of its annualized base rental revenue.
The following table lists the Company’s markets based on annualized commercial contractual base rent of the Consolidated Commercial In-Service Properties:
|
|
|
|
|
Percentage of |
|
|
|
|
|
|
|
|
|
|
Company |
|
|
|
|
|
|
|
|
|
|
Annualized |
|
Total Property |
|
|
|
|
|
|
Annualized Base |
|
Base Rental |
|
Size Rentable |
|
Percentage of |
|
|
Market |
|
Rental Revenue ($) |
|
Revenue (%) |
|
Area |
|
Rentable Area (%) |
|
|
Jersey City, NJ |
|
126,191,766 |
|
25.3 |
|
4,334,714 |
|
18.1 |
|
|
Newark, NJ (Essex-Morris-Union Counties) |
|
111,259,342 |
|
22.4 |
|
5,420,940 |
|
22.6 |
|
|
Westchester-Rockland, NY |
|
68,597,365 |
|
13.8 |
|
3,895,912 |
|
16.2 |
|
|
Bergen-Passaic, NJ |
|
62,913,770 |
|
12.7 |
|
3,315,518 |
|
13.8 |
|
|
Middlesex-Somerset-Hunterdon, NJ |
|
30,727,423 |
|
6.2 |
|
1,249,254 |
|
5.2 |
|
|
Monmouth-Ocean, NJ |
|
28,570,303 |
|
5.7 |
|
1,620,863 |
|
6.8 |
|
|
Washington, DC-MD-VA-WV |
|
20,378,554 |
|
4.1 |
|
1,123,258 |
|
4.7 |
|
|
Trenton, NJ |
|
18,446,336 |
|
3.7 |
|
956,597 |
|
4.0 |
|
|
New York (Manhattan) |
|
17,966,697 |
|
3.6 |
|
524,476 |
|
2.2 |
|
|
Philadelphia, PA-NJ |
|
7,806,570 |
|
1.6 |
|
1,260,398 |
|
5.3 |
|
|
Stamford-Norwalk, CT |
|
4,242,153 |
|
0.9 |
|
273,000 |
|
1.1 |
|
|
|
|
|
|
|
|
|
|
|
|
|
Totals |
|
497,100,279 |
|
100.0 |
|
23,974,930 |
|
100.0 |
|
|
Notes: | |
|
(1) |
Annualized base rental revenue is based on actual March 2016 billings times 12. For leases whose rent commences after April 1, 2016, annualized base rental revenue is based on the first full month’s billing times 12. As annualized base rental revenue is not derived from historical GAAP results, historical results may differ from those set forth above. |
|
(2) |
Includes leases in effect as of the period end date, some of which have commencement dates in the future, and leases expiring March 31, 2016 aggregating 159,415 square feet and representing annualized base rent of $3,827,385 for which no new leases were signed. |
|
(3) |
Includes office, office/flex, industrial/warehouse and stand-alone retail tenants only. Excludes leases for amenity, retail, parking and month-to-month tenants. Some tenants have multiple leases. |
Mack-Cali Realty Corporation Supplemental Operating and Financial Data for the Quarter Ended March 31, 2016
Details on Portfolio - Industries
The 10 largest of the Company’s commercial tenant industries currently account for almost 68 percent of the Company’s annualized base rental revenue. The financial and insurance industries remain the two largest industries for the Company’s tenants.
The following table lists the Company’s 30 largest industry classifications based on annualized commercial contractual base rent of the Consolidated Commercial Properties:
|
|
|
|
|
Percentage of |
|
|
|
Percentage of |
|
|
|
|
Annualized |
|
Company |
|
|
|
Total Company |
|
|
|
|
Base Rental |
|
Annualized Base |
|
Square |
|
Leased |
|
|
Industry Classification (a) |
|
Revenue ($) |
|
Rental Revenue (%) |
|
Feet Leased |
|
Sq. Ft. (%) |
|
|
Securities, Commodity Contracts & Other Financial |
|
71,488,012 |
|
14.4 |
|
2,402,139 |
|
11.7 |
|
|
Insurance Carriers & Related Activities |
|
54,322,381 |
|
10.9 |
|
1,937,669 |
|
9.4 |
|
|
Manufacturing |
|
38,474,188 |
|
7.7 |
|
1,775,075 |
|
8.7 |
|
|
Credit Intermediation & Related Activities |
|
37,597,826 |
|
7.6 |
|
1,220,011 |
|
5.9 |
|
|
Legal Services |
|
33,858,701 |
|
6.8 |
|
1,253,457 |
|
6.1 |
|
|
Health Care & Social Assistance |
|
24,547,988 |
|
4.9 |
|
1,228,584 |
|
6.0 |
|
|
Computer System Design Services |
|
23,298,907 |
|
4.7 |
|
991,005 |
|
4.8 |
|
|
Accounting/Tax Prep. |
|
21,737,627 |
|
4.4 |
|
780,045 |
|
3.8 |
|
|
Wholesale Trade |
|
17,027,815 |
|
3.4 |
|
1,144,194 |
|
5.6 |
|
|
Scientific Research/Development |
|
15,347,899 |
|
3.1 |
|
506,622 |
|
2.5 |
|
|
Telecommunications |
|
15,305,549 |
|
3.1 |
|
860,911 |
|
4.2 |
|
|
Public Administration |
|
15,001,287 |
|
3.0 |
|
532,084 |
|
2.6 |
|
|
Admin & Support, Waste Mgt. & Remediation Services |
|
13,824,372 |
|
2.8 |
|
671,077 |
|
3.3 |
|
|
Architectural/Engineering |
|
12,461,866 |
|
2.5 |
|
507,540 |
|
2.5 |
|
|
Management/Scientific |
|
11,116,260 |
|
2.2 |
|
425,231 |
|
2.1 |
|
|
Other Professional |
|
10,258,794 |
|
2.1 |
|
481,548 |
|
2.3 |
|
|
Other Services (except Public Administration) |
|
9,963,092 |
|
2.0 |
|
420,937 |
|
2.1 |
|
|
Real Estate & Rental & Leasing |
|
8,900,658 |
|
1.8 |
|
449,593 |
|
2.2 |
|
|
Advertising/Related Services |
|
8,141,435 |
|
1.6 |
|
309,809 |
|
1.5 |
|
|
Retail Trade |
|
7,604,996 |
|
1.5 |
|
455,092 |
|
2.2 |
|
|
Utilities |
|
7,396,101 |
|
1.5 |
|
326,664 |
|
1.6 |
|
|
Transportation |
|
6,613,908 |
|
1.3 |
|
324,046 |
|
1.6 |
|
|
Construction |
|
4,954,301 |
|
1.0 |
|
275,047 |
|
1.3 |
|
|
Educational Services |
|
4,650,560 |
|
0.9 |
|
191,776 |
|
0.9 |
|
|
Data Processing Services |
|
3,963,335 |
|
0.8 |
|
144,947 |
|
0.7 |
|
|
Publishing Industries |
|
3,791,415 |
|
0.8 |
|
185,577 |
|
0.9 |
|
|
Arts, Entertainment & Recreation |
|
2,949,184 |
|
0.6 |
|
235,100 |
|
1.1 |
|
|
Agriculture, Forestry, Fishing & Hunting |
|
2,372,387 |
|
0.5 |
|
91,509 |
|
0.4 |
|
|
Specialized Design Services |
|
2,100,894 |
|
0.4 |
|
83,540 |
|
0.4 |
|
|
Accommodation & Food Services |
|
2,088,976 |
|
0.4 |
|
92,333 |
|
0.5 |
|
|
Other |
|
5,939,565 |
|
1.3 |
|
208,550 |
|
1.1 |
|
|
|
|
|
|
|
|
|
|
|
|
|
Totals |
|
497,100,279 |
|
100.0 |
|
20,511,712 |
|
100.0 |
|
|
(1) |
The Company’s tenants are classified according to the U.S. Government’s North American Industrial Classification System (NAICS). |
|
(2) |
Annualized base rental revenue is based on actual March 2016 billings times 12. For leases whose rent commences after April 1, 2016, annualized base rental revenue is based on the first full month’s billing times 12. As annualized base rental revenue is not derived from historical GAAP results, historical results may differ from those set forth above. |
|
(3) |
Includes leases in effect as of the period end date, some of which have commencement dates in the future, and leases expiring March 31, 2016 aggregating 159,415 square feet and representing annualized base rent of $3,827,385 for which no new leases were signed. |
|
(4) |
Includes office, office/flex, industrial/warehouse and stand-alone retail tenants only. Excludes leases for amenity, retail, parking and month-to-month tenants. Some tenants have multiple leases. |
Mack-Cali Realty Corporation Supplemental Operating and Financial Data for the Quarter Ended March 31, 2016
Analysts, Company Information and Executive Officers
Equity Research Coverage
|
Barclays Capital |
Deutsche Bank North America |
JP Morgan |
|
Ross L. Smotrich / Peter Siciliano |
Vincent Chao |
Anthony Paolone |
|
(212) 526-2306 / (212) 526-3098 |
(212) 250-6799 |
(212) 622-6682 |
|
|
|
|
|
BofA Merrill Lynch |
Evercore ISI |
Stifel Nicolaus & Company, Inc. |
|
James C. Feldman / Scott Freitag |
Steve Sakwa / Gabe Hilmoe |
John Guinee / Erin Aslakson |
|
(646) 855-5808 / (646) 855-3197 |
(212) 446-9462 / (212) 446-9459 |
(443) 224-1307 / (443) 224-1350 |
|
|
|
|
|
Citigroup |
Green Street Advisors |
SunTrust Robinson Humphrey, Inc. |
|
Michael Bilerman / Emmanuel Korchman |
Jed Reagan |
Michael R. Lewis |
|
(212) 816-1383 / (212) 816-1382 |
(949) 640-8780 |
(212) 319-5659 |
Any opinions, estimates, forecasts or predictions regarding Mack-Cali Realty Corporation’s performance made by these analysts are theirs alone and do not represent opinions, estimates, forecasts or predictions of Mack-Cali Realty Corporation or its management. Mack-Cali does not by its reference above or distribution imply its endorsement of or concurrence with such opinions, estimates, forecasts or predictions.
Company Information
|
Corporate Headquarters |
Stock Exchange Listing |
Contact Information |
|
343 Thornall Street |
New York Stock Exchange |
Mack-Cali Realty Corporation |
|
Edison, New Jersey 08837-2206 |
|
Investor Relations Department |
|
(732) 590-1000 |
Trading Symbol |
343 Thornall Street |
|
|
Common Shares: CLI |
Edison, New Jersey 08837-2206 |
|
|
|
Deidre Crockett, Director of Investor Relations |
|
|
|
Phone: (732) 590-1025 |
|
|
|
Fax: (732) 205-4951 |
|
|
|
E-Mail: dcrockett@mack-cali.com |
|
|
|
Web: www.mack-cali.com |
Executive Officers
|
Mitchell E. Rudin |
Michael J. DeMarco |
Marshall Tycher |
Andrew Marshall |
|
Chief Executive Officer |
President and Chief Operating Officer |
Chairman, Roseland Residential Trust |
President and Chief Operating Officer, Roseland Residential Trust |
|
|
|
|
|
|
Anthony Krug |
Gary Wagner |
Ricardo Cardoso |
Christopher DeLorenzo |
|
Chief Financial Officer |
Chief Legal Officer and Secretary |
EVP and Chief Investment Officer |
Executive Vice President, Leasing |
Mack-Cali Realty Corporation Supplemental Operating and Financial Data for the Quarter Ended March 31, 2016
DISCLOSURE REGARDING FORWARD-LOOKING STATEMENTS
The Company considers portions of this information to be forward-looking statements within the meaning of Section 21E of the Securities Exchange Act of 1934, as amended. The Company intends such forward-looking statements to be covered by the safe harbor provisions for forward-looking statements contained in Section 21E of such act. Such forward-looking statements relate to, without limitation, the Company’s future economic performance, plans and objectives for future operations and projections of revenue and other financial items. Forward-looking statements can be identified by the use of words such as “may,” “will,” “plan,” “potential,” “projected,” “should,” “expect,” “anticipate,” “estimate,” “target,” “continue” or comparable terminology. Forward-looking statements are inherently subject to risks and uncertainties, many of which the Company cannot predict with accuracy and some of which the Company might not even anticipate. Although the Company believes that the expectations reflected in such forward-looking statements are based upon reasonable assumptions at the time made, the Company can give no assurance that such expectations will be achieved. Future events and actual results, financial and otherwise, may differ materially from the results discussed in the forward-looking statements. Readers are cautioned not to place undue reliance on these forward-looking statements.
Among the factors about which the Company has made assumptions are:
|
· |
risks and uncertainties affecting the general economic climate and conditions, which in turn may have a negative effect on the fundamentals of the Company’s business and the financial condition of the Company’s tenants and residents; |
|
|
|
|
· |
the value of the Company’s real estate assets, which may limit the Company’s ability to dispose of assets at attractive prices or obtain or maintain debt financing secured by the Company’s properties or on an unsecured basis; |
|
|
|
|
· |
the extent of any tenant bankruptcies or of any early lease terminations; |
|
|
|
|
· |
the Company’s ability to lease or re-lease space at current or anticipated rents; |
|
|
|
|
· |
changes in the supply of and demand for the Company’s properties; |
|
|
|
|
· |
changes in interest rate levels and volatility in the securities markets; |
|
|
|
|
· |
the Company’s ability to complete construction and development activities on time and within budget, including without limitation obtaining regulatory permits and the availability and cost of materials, labor and equipment; |
|
|
|
|
· |
forward-looking financial and operational information, including information relating to future development projects, potential acquisitions or dispositions, and projected revenue and income; |
|
|
|
|
· |
changes in operating costs; |
|
|
|
|
· |
the Company’s ability to obtain adequate insurance, including coverage for terrorist acts; |
|
|
|
|
· |
the Company’s credit worthiness and the availability of financing on attractive terms or at all, which may adversely impact the Company’s ability to pursue acquisition and development opportunities and refinance existing debt and the Company’s future interest expense; |
|
|
|
|
· |
changes in governmental regulation, tax rates and similar matters; and |
|
|
|
|
· |
other risks associated with the development and acquisition of properties, including risks that the development may not be completed on schedule, that the tenants or residents will not take occupancy or pay rent, or that development or operating costs may be greater than anticipated. |
For further information on factors which could impact the Company and the statements contained herein, see Item 1A: Risk Factors in the Company’s Annual Report on Form 10-K for the three months ended December 31, 2015. The Company assumes no obligation to update and supplement forward-looking statements that become untrue because of subsequent events, new information or otherwise.
This Supplemental Operating and Financial Data is not an offer to sell or solicitation to buy any securities of the Company. Any offers to sell or solicitations of the Company shall be made by means of a prospectus. The information in this Supplemental Package must be read in conjunction with, and is modified in its entirety by, the Quarterly Report on Form 10-Q (the “10-Q”) filed by the Company for the same period with the Securities and Exchange Commission (the “SEC”) and all of the Company’s other public filings with the SEC (the “Public Filings”). In particular, the financial information contained herein is subject to and qualified by reference to the financial statements contained in the 10-Q, the footnotes thereto and the limitations set forth therein. Investors may not rely on the Supplemental Package without reference to the 10-Q and the Public Filings. Any investors’ receipt of, or access to, the information contained herein is subject to this qualification.
MARKET DATA
Certain market data and forecasts were obtained from independent industry sources as well as from research reports prepared for other purposes. Neither the Company nor its affiliates have independently verified the data obtained from these sources and they cannot give any assurance of the accuracy or completeness of the data. Forecasts and other forward-looking information obtained from these sources are subject to the same qualifications and the additional uncertainties regarding the other forward-looking statements described above.
Mack-Cali Realty Corporation Supplemental Operating and Financial Data for the Quarter Ended March 31, 2016