Forward-Looking Statements
The Company considers portions of this information, including the documents incorporated by reference, to be forward-looking statements within the meaning of Section 21E of the Securities Exchange Act of 1934, as amended. The Company intends such forward-looking statements to be covered by the safe harbor provisions for forward-looking statements contained in Section 21E of such act. Such forward-looking statements relate to, without limitation, our future economic performance, plans and objectives for future operations and projections of revenue and other financial items. Forward-looking statements can be identified by the use of words such as “may,” “will,” “plan,” “potential,” “projected,” “should,” “expect,” “anticipate,” “estimate,” “target”, “continue” or comparable terminology. Forward-looking statements are inherently subject to certain risks, trends and uncertainties, many of which we cannot predict with accuracy and some of which we might not even anticipate. Although the Company believes that the expectations reflected in such forward-looking statements are based upon reasonable assumptions at the time made, the Company can give no assurance that such expectations will be achieved. Future events and actual results, financial and otherwise, may differ materially from the results discussed in the forward-looking statements. Readers are cautioned not to place undue reliance on these forward-looking statements.
In addition, the extent to which the ongoing COVID-19 pandemic impacts us and our tenants and residents will depend on future developments, which are highly uncertain and cannot be predicted with confidence, including the scope, severity and duration of the pandemic, the actions taken to contain the pandemic or mitigate its impact, and the direct and indirect economic effects of the pandemic and containment measures, among others.
Among the factors about which the Company has made assumptions are:
|
-
| |
risks and uncertainties affecting the general economic climate and conditions, which in turn may have a negative effect on the fundamentals of the Company’s business and the financial condition of the Company’s tenants and residents; |
|
-
| |
the value of the Company’s real estate assets, which may limit the Company’s ability to dispose of assets at attractive prices or obtain or maintain debt financing secured by our properties or on an unsecured basis; |
|
-
| |
the extent of any tenant bankruptcies or of any early lease terminations; |
|
-
| |
the Company’s ability to lease or re-lease space at current or anticipated rents; |
|
-
| |
changes in the supply of and demand for the Company’s properties; |
|
-
| |
changes in interest rate levels and volatility in the securities markets; |
|
-
| |
the Company’s ability to complete construction and development activities on time and within budget, including without limitation obtaining regulatory permits and the availability and cost of materials, labor and equipment; |
|
-
| |
the Company’s ability to attract, hire and retain qualified personnel; |
|
-
| |
forward-looking financial and operational information, including information relating to future development projects, potential acquisitions or dispositions, leasing activities, capitalization rates and projected revenue and income; |
|
-
| |
changes in operating costs; |
|
-
| |
the Company’s ability to obtain adequate insurance, including coverage for natural disasters and terrorist acts; |
|
-
| |
the Company’s credit worthiness and the availability of financing on attractive terms or at all, which may adversely impact our ability to pursue acquisition and development opportunities and refinance existing debt and the Company’s future interest expense; |
|
-
| |
changes in governmental regulation, tax rates and similar matters; and |
|
-
| |
other risks associated with the development and acquisition of properties, including risks that the development may not be completed on schedule, that the tenants or residents will not take occupancy or pay rent, or that development or operating costs may be greater than anticipated. |
For further information on factors which could impact us and the statements contained herein, see Item 1A: Risk Factors in Veris Residential, Inc.’s (“VRE”) Annual Report on Form 10-K for the year ended December 31, 2021. We assume no obligation to update and supplement forward-looking statements that become untrue because of subsequent events, new information or otherwise.
This Supplemental Operating and Financial Data is not an offer to sell or solicitation to buy any securities of VRE. Any offers to sell or solicitations of VRE shall be made by means of a prospectus. The information in this Supplemental Package must be read in conjunction with, and is modified in its entirety by, the Quarterly Report on Form 10-Q (the “10-Q”) filed by VRE for the same period with the Securities and Exchange Commission (the “SEC”) and all of the VRE’s other public filings with the SEC (the “Public Filings”). In particular, the financial information contained herein is subject to and qualified by reference to the financial statements contained in the 10-Q, the footnotes thereto and the limitations set forth therein. Investors may not rely on the Supplemental Package without reference to the 10-Q and the Public Filings. Any investors’ receipt of, or access to, the information contained herein is subject to this qualification.
This Supplemental Operating and Financial Data should be read in connection with the Company’s first quarter 2022 earnings press release (included as Exhibit 99.2 of the Company’s Current Report on Form 8-K, filed on May 4, 2022), as certain disclosures, definitions and reconciliations in such announcement have not been included in this Supplemental Operating and Financial Data.
Information About FFO, Core FFO, AFFO, NOI, Adjusted EBITDA & EBITDAre
Funds from operations (“FFO”) is defined as net income (loss) before noncontrolling interests of unitholders, computed in accordance with generally accepted accounting principles (“GAAP”), excluding gains or losses from depreciable rental property transactions (including both acquisitions and dispositions), and impairments related to depreciable rental property, plus real estate-related depreciation and amortization. The Company believes that FFO per share is helpful to investors as one of several measures of the performance of an equity REIT. The Company further believes that as FFO per share excludes the effect of depreciation, gains (or losses) from property transactions and impairments related to depreciable rental property (all of which are based on historical costs which may be of limited relevance in evaluating current performance), FFO per share can facilitate comparison of operating performance between equity REITs.
FFO per share should not be considered as an alternative to net income available to common shareholders per share as an indication of the Company’s performance or to cash flows as a measure of liquidity. FFO per share presented herein is not necessarily comparable to FFO per share presented by other real estate companies due to the fact that not all real estate companies use the same definition. However, the Company’s FFO per share is comparable to the FFO per share of real estate companies that use the current definition of the National Association of Real Estate Investment Trusts (“NAREIT”). A reconciliation of net income per share to FFO per share is included in the financial tables above.
Core FFO is defined as FFO, as adjusted for items that may distort the comparative measurement of the Company’s performance over time. Adjusted FFO ("AFFO") is defined as Core FFO less (i) recurring tenant improvements, leasing commissions and capital expenditures, (ii) straight-line rents and amortization of acquired above/below-market leases, net, and (iii) other non-cash income, plus (iv) other non-cash charges. Core FFO and AFFO are both non-GAAP financial measures that are not intended to represent cash flow and are not indicative of cash flows provided by operating activities as determined in accordance with GAAP. Core FFO and AFFO are presented solely as supplemental disclosures that the Company’s management believes provides useful information regarding the Company's operating performance and its ability to fund its dividends. There are not generally accepted definitions established for Core FFO or AFFO. Therefore, the Company's measures of Core FFO and AFFO may not be comparable to the Core FFO and AFFO reported by other REITs. A reconciliation of net income to Core FFO and AFFO are included in the financial tables above.
Net operating income (“NOI”) represents total revenues less total operating expenses, as reconciled to net income above. Same Store GAAP NOI and Same Store Cash NOI are reconciled to Total Property Revenues. The Company considers NOI, Same Store GAAP NOI, and Same Store Cash NOI to be meaningful non-GAAP financial measures for making decisions and assessing unlevered performance of its property types and markets, as it relates to total return on assets, as opposed to levered return on equity. As properties are considered for sale and acquisition based on NOI estimates and projections, the Company utilizes this measure to make investment decisions, as well as compare the performance of its assets to those of its peers. NOI should not be considered a substitute for net income, and the Company’s use of NOI, Same Store GAAP NOI, Same Store Cash NOI may not be comparable to similarly titled measures used by other companies. The Company calculates NOI before any allocations to noncontrolling interests, as those interests do not affect the overall performance of the individual assets being measured and assessed.
Same Store includes specific properties, which represent all in-service properties owned by the Company during the reported period, excluding properties sold, disposed of, held for sale, removed from service, or for any reason considered not stabilized, or being redeveloped or repositioned in the reporting period.
Adjusted EBITDA is a non-GAAP financial measure. The Company computes Adjusted EBITDA in accordance with what it believes are industry standards for this type of measure, which may not be comparable to Adjusted EBITDA reported by other REITs. The Company defines Adjusted EBITDA as Core FFO , plus interest expense, plus income tax expense, plus income (loss) in noncontrolling interest in consolidated joint ventures, and plus adjustments to reflect the entity's share of Adjusted EBITDA of unconsolidated joint ventures. The Company presents Adjusted EBITDA because the Company believes that Adjusted EBITDA, along with cash flow from operating activities, investing activities and financing activities, provides investors with an additional indicator of the Company’s ability to incur and service debt. Adjusted EBITDA should not be considered as an alternative to net income (determined in accordance with GAAP), as an indication of the Company’s financial performance, as an alternative to net cash flows from operating activities (determined in accordance with GAAP), or as a measure of the Company’s liquidity.
EBITDAre is a non-GAAP financial measure. The Company computes EBITDAre in accordance with standards established by the National Association of Real Estate Investment Trusts, or NAREIT, which may not be comparable to EBITDAre reported by other REITs that do not compute EBITDAre in accordance with the NAREIT definition, or that interpret the NAREIT definition differently than the Company does. The White Paper on EBITDAre approved by the Board of Governors of NAREIT in September 2017 defines EBITDAre as net income (loss) (computed in accordance with Generally Accepted Accounting Principles, or GAAP), plus interest expense, plus income tax expense, plus depreciation and amortization, plus (minus) losses and gains on the disposition of depreciated property, plus impairment write-downs of depreciated property and investments in unconsolidated joint ventures, plus adjustments to reflect the entity's share of EBITDAre of unconsolidated joint ventures. The Company presents EBITDAre, because the Company believes that EBITDAre, along with cash flow from operating activities, investing activities and financing activities, provides investors with an additional indicator of the Company’s ability to incur and service debt. EBITDAre should not be considered as an alternative to net income (determined in accordance with GAAP), as an indication of the Company’s financial performance, as an alternative to net cash flows from operating activities (determined in accordance with GAAP), or as a measure of the Company’s liquidity.

Company Highlights
Q1 2022 Highlights
|
·
| |
The 6,691-unit operating multifamily portfolio and the Same Store 5,825-unit operating multifamily portfolio were 97.5% and 97.2% occupied, respectively, as of March 31, 2022 |
|
·
| |
First quarter 2022, year-over-year and quarter-over-quarter Same Store NOI for the operating multifamily portfolio increased by 20.0% and 6.8%, respectively, reflecting higher occupancy, lower concessions and increasing market rents during the quarter |
|
·
| |
Multifamily Blended Net Rental Growth Rate1 was 16% during the first quarter 2022 |
|
·
| |
Haus25, a 750-unit property located in Jersey City, NJ commenced leasing on April 6, 2022 and was 29% leased as of May 1, 2022 with 216 new leases signed |
|
·
| |
On March 16, 2022, the Company entered into an off-market transaction to acquire The James, a Class-A 240-unit property located in Park Ridge, NJ for $130 million, or a 4.0% cap rate |
|
·
| |
Completed the disposal of four land parcels located in West Windsor, Weehawken and Jersey City, NJ for $129.5 million |
|
·
| |
Strengthened executive leadership with the appointments of Jeff Turkanis and Taryn Fielder as Chief Investment Officer and General Counsel, respectively |
|
1.
| |
Excludes Urby, Station House and RiverPark at Harrison; Blended Net Rental Growth Rate – weighted average of the net effective change in rent (inclusive of concessions) for a lease with a new resident or for a renewed lease on an apartment unit compared to the rent for the prior lease of the identical apartment unit. |
Q1 2022 Key Financial Metrics
|
|
|
|
|
|
|
|
|
|
|
|
Three Months Ended
|
|
|
Three Months Ended
|
|
|
March 31, 2022
|
|
December 31, 2021
|
|
|
March 31, 2022
|
|
December 31, 2021
|
|
Net Income / (Loss) per Diluted Share
|
($0.13)
|
|
($0.32)
|
|
Key Portfolio Statistics
|
|
|
|
|
Core FFO per Diluted Share(1)
|
$0.09
|
|
$0.17
|
|
Multifamily Portfolio
|
|
|
|
|
Weighted Average - Diluted Shares(2)
|
99,934,499
|
|
99,962,745
|
|
Operating Units
|
6,691
|
|
6,691
|
|
Total Equity
|
$2.2 billion
|
|
$2.4 billion
|
|
% Physical Occupancy
|
97.5%
|
|
96.6%
|
|
Total Debt
|
$2.2 billion
|
|
$2.4 billion
|
|
Average Rent per Home(3)
|
$3,103
|
|
$2,974
|
|
Total Capitalization
|
$4.5 billion
|
|
$4.8 billion
|
|
In-Construction Units
|
750
|
|
750
|
|
Debt-to-Undepreciated Assets
|
44.9%
|
|
46.8%
|
|
Land Bank Units
|
7,257
|
|
7,257
|
|
Net Debt
|
$2.1 billion
|
|
$2.3 billion
|
|
Office Portfolio
|
|
|
|
|
Annualized Adjusted EBITDA(1)
|
$113,692
|
|
$152,732
|
|
Square Feet of Office Space
|
4.3 million
|
|
4.9 million
|
|
Net Debt-to-Adjusted EBITDA
|
18.8x
|
|
15.3x
|
|
Consolidated In-Service Properties
|
6
|
|
7
|
|
Interest Coverage Ratio(1)
|
1.9x
|
|
2.4x
|
|
% Leased Office
|
73.3%
|
|
74.0%
|
|
|
|
|
|
|
% Commenced Occupancy
|
66.7%
|
|
71.8%
|
|
|
|
|
|
|
Cash Rental Rate Roll-Up/(Down)(4)
|
(11.7%)
|
|
2.5%
|
|
|
|
|
|
|
GAAP Rental Rate Roll-Up/(Down)(4)
|
(4.9%)
|
|
14.9%
|
|
|
|
|
|
|
Average In-Place Rent per Square Foot
|
$42.43
|
|
$41.40
|
|
1.
| |
See “Information About FFO, Core FFO, AFFO, NOI, Adjusted EBITDA & EBITDAre”. FFO is calculated in accordance with the definition of the National Association of Real Estate Investment Trusts (NAREIT). Interest Coverage Ratio is calculated as Adjusted EBITDA divided by interest expense. |
|
2.
| |
Includes any outstanding preferred units presented on a converted basis into common units, noncontrolling interests in consolidated joint ventures and redeemable noncontrolling interests. |
|
3.
| |
Q1 2022 is based on 6,691 units including three recently stabilized properties. Q4 2021 is based on 5,825 units, which exclude three lease-up properties stabilized during the quarter. |
|
4.
| |
Cash Rental Rate Roll-Up is the change in starting rent for applicable signed lease transactions in the period compared to the last month’s rent for the prior space leased. GAAP Rental Rate Roll-Up is the change in average monthly rent for applicable signed lease transactions in the period compared to the average monthly rent for the prior space leased.
|
Components of Net Asset Value – Multifamily
$ in thousands
|
|
|
|
|
|
|
|
Real Estate Portfolio - Multifamily
|
|
|
|
Other Assets
|
|
|
|
|
|
|
|
|
|
Operating Multifamily NOI (Q1 Annualized)(1)
|
Total
|
At Share
|
|
Cash and Cash Equivalents
|
$8,630
|
|
New Jersey Waterfront
|
$85,576
|
$73,037
|
|
Restricted Cash
|
19,808
|
|
Massachusetts
|
21,452
|
21,452
|
|
Other Assets
|
43,579
|
|
Other
|
16,648
|
10,717
|
|
Subtotal Other Assets
|
$72,017
|
|
Lease-up Properties stabilized in Q4 2021(2)
|
19,384
|
14,834
|
|
|
|
|
Haus25(3) (Stabilized NOI)
|
28,098
|
28,098
|
|
Liabilities
|
|
|
Total Multifamily NOI
|
$171,158
|
$148,138
|
|
|
|
|
Commercial (Q1 Annualized)
|
4,003
|
2,500
|
|
Operating - Consolidated Debt at Share
|
$1,436,978
|
|
Hotels (Q1 Annualized)
|
(4,076)
|
(4,076)
|
|
Operating - Unconsolidated Debt at Share
|
314,118
|
|
Total NOI
|
$171,085
|
$146,562
|
|
In-Construction - Wholly Owned Debt
|
269,083
|
|
|
|
|
|
In-Construction - Unfunded Wholly Owned Debt
|
30,917
|
|
Multifamily Land Value
|
|
|
|
Hotels Debt
|
89,000
|
|
|
|
|
|
Other Liabilities
|
51,937
|
|
Gross Estimated Proceeds from Land Sales(4)
|
|
$125,500
|
|
Subtotal Liabilities
|
$2,192,033
|
|
Estimated Value of Land(5)
|
|
$272,642
|
|
|
|
|
|
|
|
|
Other Considerations
|
|
|
|
|
|
|
|
|
|
|
|
|
|
Rockpoint Interest
|
$472,210
|
|
|
|
|
|
|
|
|
|
|
|
|
Outstanding Shares
|
|
|
|
|
|
|
|
|
|
|
|
|
|
Common Shares (Outstanding as of March 31, 2022)
|
99,918,144
|
|
|
|
|
|
Fully Diluted Shares for Q1 2022
|
99,934,499
|
|
|
|
|
|
|
|
Notes: See “Information About FFO, Core FFO, AFFO, NOI, Adjusted EBITDA & EBITDAre”. Net Asset Value (“NAV”) is the metric represents the net projected value of the Company’s interest after accounting for all priority debt and equity payments. The metric includes capital invested by the Company. Excludes other unconsolidated JV.
|
1.
| |
Please see Operating Portfolio – Multifamily details for breakdown. |
|
2.
| |
Includes RiverHouse 9, Capstone at Port Imperial and The Upton. |
|
3.
| |
See In-Construction Portfolio details for costs. |
|
4.
| |
Includes 4 land parcel sold post March 31, 2022 and under contract. |
|
5.
| |
Based on 5,009 potential units. |
Components of Net Asset Value – Other
$ in thousands
|
|
|
|
|
|
|
|
Real Estate Portfolio - Office
|
|
|
|
Other Assets
|
|
|
|
|
|
|
|
|
|
Office NOI (Q1 Annualized)
|
Total
|
At Share
|
|
Cash and Cash Equivalents
|
$17,508
|
|
Waterfront(1)
|
$27,948
|
$27,948
|
|
Restricted Cash
|
1,345
|
|
Suburban
|
4,564
|
4,564
|
|
Other Assets
|
144,156
|
|
Hotel
|
(3,252)
|
(1,628)
|
|
Subtotal Other Assets
|
$163,009
|
|
Total GAAP NOI(2)
|
$29,260
|
$30,884
|
|
|
|
|
Less: straight-lining of rents adj. and ASC 805
|
224
|
222
|
|
Liabilities
|
|
|
Total Cash NOI(3)
|
$29,036
|
$30,662
|
|
|
|
|
|
|
|
|
Revolving Credit Facility
|
$78,000
|
|
Office Sales / Land Value
|
|
|
|
Consolidated Property Debt
|
250,000
|
|
|
|
|
|
Unconsolidated Property Debt at Share
|
50,000
|
|
Gross Proceeds from Office Sale(4)
|
|
$380,000
|
|
Other Liabilities
|
57,928
|
|
Estimated Value of Land(5)
|
|
94,008
|
|
Subtotal Liabilities
|
$435,928
|
|
|
|
|
|
|
|
|
|
|
|
|
Other Considerations
|
|
|
|
|
|
|
|
|
|
|
|
|
|
Preferred Equity / LP Interest
|
40,302
|
|
|
|
|
|
|
|
|
|
|
|
|
Outstanding Shares
|
|
|
|
|
|
|
|
|
|
|
|
|
|
Common Shares (Outstanding as of March 31, 2022)
|
99,918,144
|
|
|
|
|
|
Fully Diluted Shares for Q1 2022
|
99,934,499
|
Notes: See “Information About FFO, Core FFO, AFFO, NOI, Adjusted EBITDA & EBITDAre”. Net Asset Value (“NAV”) is the metric represents the net projected value of the Company’s interest after accounting for all priority debt and equity payments. The metric includes capital invested by the Company. Excludes other unconsolidated JV.
|
1.
| |
Excludes annualized Q1 Cash NOI from 111 River Street sold during the quarter and a property in Jersey City, NJ under contract as of March 31, 2022. |
|
2.
| |
The aggregate sum of: property-level revenue, straight-line and ASC 805 adjustments over the given time period; less: operating expense, real estate taxes and utilities over the same store portfolio. |
|
3.
| |
The aggregate sum of: property-level revenue, excluding straight-line and ASC 805 adjustments over the given time period; less: operating expense, real estate taxes and utilities over the same store portfolio. |
|
4.
| |
Excludes prepayment costs of up to $15 million. |
|
5.
| |
Estimated Land is based on the estimated buildable SF and marketable units at estimated market pricing. Includes Harborside Plaza 4, 3 Campus, Route 34 and Columbia. |
|
|
|
|
|
|
|
|
|
|
Disposition Activity
|
|
|
|
|
|
|
|
|
|
|
Office
|
|
|
|
|
|
|
|
|
$ in thousands (incl. per unit values) except per SF
|
|
|
|
Transaction
|
Number of
|
|
Percentage
|
Gross Asset
|
Price per
|
|
|
Location
|
Date
|
Buildings
|
SF
|
Leased
|
Value(1)
|
SF
|
|
Q1 2022 Dispositions
|
|
|
|
|
|
|
|
|
111 River Street
|
Hoboken, NJ
|
01/21/22
|
1
|
566,215
|
81.3%
|
$210,000
|
$371
|
|
Total Q1 2022 Dispositions
|
|
|
1
|
566,215
|
81.3%
|
$210,000
|
$371
|
|
|
|
|
|
|
|
|
|
|
|
|
|
|
|
Land
|
|
|
|
|
|
|
Transaction
|
Gross Asset
|
|
|
Location
|
Date
|
Value(1)
|
|
Q1 2022 Dispositions
|
|
|
|
|
Palladium Residential Land
|
West Windsor, NJ
|
03/22/22
|
$24,250
|
|
Palladium Commercial Land
|
West Windsor, NJ
|
03/22/22
|
5,250
|
|
Total Q1 2022 Dispositions
|
|
|
$29,500
|
|
|
|
|
|
|
Q2 2022 Dispositions to Date
|
|
|
|
|
PI Park
|
Weehawken, NJ
|
04/15/22
|
$30,000
|
|
Urby II / III
|
Jersey City, NJ
|
04/21/22
|
70,000
|
|
Total Q2 2022 Dispositions to Date
|
|
|
$100,000
|
|
1.
| |
Dispositions list gross sales proceeds at 100% ownership level. |
|
|
|
|
|
|
|
|
|
|
|
|
|
Same Store Performance
|
|
$ in thousands (unaudited)
|
|
|
|
|
|
|
|
|
|
|
|
|
|
|
|
|
|
|
|
Multifamily Same Store(1)
|
|
|
|
|
|
|
|
|
|
Three Months Ended March 31,
|
|
Sequential
|
|
|
|
2022
|
2021
|
Change
|
%
|
|
Q1 2022
|
Q4 2021
|
Change
|
%
|
|
Total Property Revenues (GAAP)
|
$44,414
|
$38,891
|
$5,523
|
14.2%
|
|
$44,414
|
$42,679
|
$1,735
|
4.1%
|
|
Real Estate Taxes
|
6,483
|
5,912
|
571
|
9.7%
|
|
6,483
|
5,813
|
670
|
11.5%
|
|
Payroll
|
3,148
|
2,808
|
340
|
12.1%
|
|
3,148
|
3,316
|
(168)
|
(5.1%)
|
|
Repairs & Maintenance
|
3,146
|
2,834
|
312
|
11.0%
|
|
3,146
|
3,456
|
(310)
|
(9.0%)
|
|
Utilities
|
1,511
|
1,687
|
(176)
|
(10.4%)
|
|
1,511
|
1,248
|
263
|
21.1%
|
|
Insurance
|
1,085
|
880
|
205
|
23.3%
|
|
1,085
|
890
|
195
|
21.9%
|
|
Marketing
|
802
|
1,182
|
(380)
|
(32.1%)
|
|
802
|
1,176
|
(374)
|
(31.8%)
|
|
Management Fees & Other
|
1,854
|
1,605
|
249
|
15.5%
|
|
1,854
|
2,072
|
(218)
|
(10.5%)
|
|
Total Property Expenses
|
18,029
|
16,908
|
1,121
|
6.6%
|
|
18,029
|
17,971
|
58
|
0.3%
|
|
Same Store GAAP NOI(2)
|
$26,385
|
$21,983
|
$4,402
|
20.0%
|
|
$26,385
|
$24,708
|
$1,677
|
6.8%
|
|
Total Units
|
5,825
|
5,825
|
-
|
-
|
|
5,825
|
5,825
|
-
|
-
|
|
% Ownership
|
83.9%
|
83.9%
|
-
|
-
|
|
83.9%
|
83.9%
|
-
|
-
|
|
% Occupied - Quarter End
|
97.2%
|
89.8%
|
7.4%
|
-
|
|
97.2%
|
96.5%
|
0.7%
|
-
|
Notes: See “Information About FFO, Core FFO, AFFO, NOI, Adjusted EBITDA & EBITDAre”.
|
1.
| |
Values represent the Company’s pro rata ownership of operating portfolio. |
|
2.
| |
Aggregate property-level revenue over the given period; less: operating expense, real estate taxes and utilities over the same period for the same store portfolio. |
|
Balance Sheet
|
|
|
|
|
|
|
|
$ in thousands (unaudited)
|
|
|
|
|
|
|
March 31, 2022
|
December 31, 2021
|
|
ASSETS
|
Multifamily
|
Office
|
Elim. / Other
|
Total
|
|
|
|
Rental property
|
|
|
|
|
|
|
|
Land and leasehold interests
|
$327,483
|
$21,023
|
–
|
$348,506
|
|
$348,505
|
|
Buildings and improvements
|
2,060,674
|
620,730
|
–
|
2,681,404
|
|
2,682,223
|
|
Tenant improvements
|
7,168
|
101,005
|
–
|
108,173
|
|
106,654
|
|
Furniture, fixtures and equipment
|
94,755
|
6,935
|
–
|
101,690
|
|
100,011
|
|
Land and improvements held for development
|
136,103
|
6,775
|
–
|
142,878
|
|
144,705
|
|
Development and construction in progress
|
535,787
|
190,812
|
–
|
726,599
|
|
694,768
|
|
|
3,161,970
|
947,280
|
–
|
4,109,250
|
|
4,076,866
|
|
Less – accumulated depreciation and amortization
|
(218,851)
|
(387,774)
|
–
|
(606,625)
|
|
(583,416)
|
|
|
2,943,119
|
559,506
|
–
|
3,502,625
|
|
3,493,450
|
|
Rental property held for sale, net
|
146,881
|
265,177
|
–
|
412,058
|
|
618,646
|
|
Net Investment in Rental Property
|
3,090,000
|
824,683
|
–
|
3,914,683
|
|
4,112,096
|
|
Cash and cash equivalents
|
8,630
|
17,508
|
–
|
26,138
|
|
31,754
|
|
Restricted cash
|
19,808
|
1,345
|
–
|
21,153
|
|
19,701
|
|
Investments in unconsolidated joint ventures
|
135,116
|
–
|
–
|
135,116
|
|
137,772
|
|
Unbilled rents receivable, net
|
4,290
|
48,871
|
–
|
53,161
|
|
72,285
|
|
Deferred charges, goodwill and other assets, net(1)(2)
|
37,277
|
95,064
|
(25,000)
|
107,341
|
|
151,347
|
|
Accounts receivable
|
2,012
|
221
|
–
|
2,233
|
|
2,363
|
|
Total Assets
|
$3,297,133
|
$987,692
|
($25,000)
|
$4,259,825
|
|
$4,527,318
|
|
LIABILITIES & EQUITY
|
|
|
|
|
|
|
|
Revolving credit facility
|
–
|
78,000
|
–
|
78,000
|
|
148,000
|
|
Mortgages, loans payable and other obligations, net
|
1,859,837
|
249,106
|
–
|
2,108,943
|
|
2,241,070
|
|
Note payable to affiliate
|
25,000
|
–
|
(25,000)
|
–
|
|
–
|
|
Dividends and distributions payable
|
–
|
132
|
–
|
132
|
|
384
|
|
Accounts payable, accrued expenses and other liabilities
|
47,226
|
42,754
|
–
|
89,980
|
|
134,977
|
|
Rents received in advance and security deposits
|
9,242
|
15,033
|
–
|
24,275
|
|
26,396
|
|
Accrued interest payable
|
4,279
|
903
|
–
|
5,182
|
|
5,760
|
|
Total Liabilities
|
1,945,584
|
385,928
|
(25,000)
|
2,306,512
|
|
2,556,587
|
|
Commitments and contingencies
|
|
|
|
|
|
|
|
Redeemable noncontrolling interests
|
472,210
|
40,302
|
–
|
512,512
|
|
521,313
|
|
Total Stockholders’/Members Equity
|
839,668
|
436,013
|
–
|
1,275,681
|
|
1,281,982
|
|
Noncontrolling interests in subsidiaries:
|
|
|
|
|
|
|
|
Operating Partnership
|
–
|
125,700
|
–
|
125,700
|
|
127,053
|
|
Consolidated joint ventures
|
39,671
|
(251)
|
–
|
39,420
|
|
40,383
|
|
Total Noncontrolling Interests in Subsidiaries
|
$39,671
|
$125,449
|
–
|
$165,120
|
|
$167,436
|
|
Total Equity
|
$879,339
|
$561,462
|
–
|
$1,440,801
|
|
$1,449,418
|
|
Total Liabilities and Equity
|
$3,297,133
|
$987,692
|
($25,000)
|
$4,259,825
|
|
$4,527,318
|
|
1.
| |
Includes mark-to-market lease intangible net assets of $10,865 and mark-to-market lease intangible net liabilities of $357 as of Q1 2022. |
|
2.
| |
Includes Prepaid Expenses and Other Assets attributable to Multifamily of $24,091 as follows: (i) deposits of $11,551, (ii) other receivables of $3,393, (iii) other prepaids/assets of $7,253, and (iv) prepaid taxes of $1,894. |
|
|
|
|
|
|
|
|
|
Income Statement - Quarterly Comparison
|
|
|
|
$ in thousands, except per share amounts (unaudited)
|
|
|
Q1 2022
|
Q1 2021
|
|
REVENUES
|
Multifamily
|
Office
|
Less: Disc. Ops
|
Total
|
|
|
|
Revenue from leases:
|
|
|
|
|
|
|
|
Base rents
|
$39,440
|
$21,887
|
–
|
$61,327
|
$61,620
|
|
|
Escalations and recoveries from tenants
|
1,000
|
3,481
|
–
|
4,481
|
4,151
|
|
|
Real estate services
|
910
|
–
|
–
|
910
|
2,527
|
|
|
Parking income
|
2,983
|
1,194
|
–
|
4,177
|
3,086
|
|
|
Hotel income
|
1,417
|
–
|
–
|
1,417
|
1,053
|
|
|
Other income
|
767
|
26,020
|
–
|
26,787
|
3,656
|
|
|
Total revenues
|
$46,517
|
$52,582
|
–
|
$99,099
|
$76,093
|
|
EXPENSES
|
|
|
|
|
|
|
|
Real estate taxes
|
7,907
|
4,787
|
–
|
12,694
|
11,831
|
|
|
Utilities
|
1,979
|
1,954
|
–
|
3,933
|
4,092
|
|
|
Operating services
|
11,156
|
7,375
|
–
|
18,531
|
15,450
|
|
|
Real estate services expenses
|
2,328
|
35
|
–
|
2,363
|
3,318
|
|
|
General and administrative(1)
|
1,416
|
18,059
|
–
|
19,475
|
13,989
|
|
|
Depreciation and amortization
|
17,404
|
9,110
|
–
|
26,514
|
28,173
|
|
|
Land and other impairments
|
2,932
|
–
|
–
|
2,932
|
413
|
|
|
Total expenses
|
45,122
|
41,320
|
–
|
86,442
|
77,266
|
|
Operating Income (expense)
|
1,395
|
11,262
|
–
|
12,657
|
(1,173)
|
|
OTHER (EXPENSE) INCOME
|
|
|
|
|
|
|
|
Interest expense
|
(12,263)
|
(2,762)
|
–
|
(15,025)
|
(17,610)
|
|
|
Interest and other investment income (loss)
|
1
|
157
|
–
|
158
|
17
|
|
|
Equity in earnings (loss) of unconsolidated joint ventures
|
(487)
|
–
|
–
|
(487)
|
(1,456)
|
|
|
Realized and unrealized gains (losses) on disposition
|
–
|
1,836
|
–
|
1,836
|
–
|
|
|
Gain on disposition of developable land
|
–
|
2,623
|
–
|
2,623
|
–
|
|
|
Gain (loss) from extinguishment of debt, net
|
–
|
(6,289)
|
–
|
(6,289)
|
–
|
|
|
Total other income (expense)
|
(12,749)
|
(4,435)
|
–
|
(17,184)
|
(19,049)
|
|
Income from continuing operations
|
(11,354)
|
6,827
|
–
|
(4,527)
|
(20,222)
|
|
|
Income from discontinued operations
|
–
|
–
|
–
|
–
|
10,962
|
|
|
Realized gains (losses) on disposition
|
–
|
–
|
–
|
–
|
22,781
|
|
|
Total discontinued operations
|
–
|
–
|
–
|
–
|
33,743
|
|
Net Income
|
(11,354)
|
6,827
|
–
|
(4,527)
|
13,521
|
|
|
Noncontrolling interest in consolidated joint ventures
|
974
|
–
|
–
|
974
|
1,335
|
|
|
Noncontrolling interests in Operating Partnership from continuing operations
|
–
|
898
|
–
|
898
|
2,305
|
|
|
Noncontrolling interests in Operating Partnership in discontinued operations
|
–
|
–
|
–
|
–
|
(3,067)
|
|
|
Redeemable noncontrolling interest
|
(6,016)
|
(421)
|
–
|
(6,437)
|
(6,471)
|
|
Net income (loss) available to common shareholders
|
($16,396)
|
$7,304
|
–
|
($9,092)
|
$7,623
|
|
Basic earnings per common share:
|
|
|
|
|
|
|
Net income (loss) available to common shareholders
|
|
|
|
($0.13)
|
$0.06
|
|
Diluted earnings per common share:
|
|
|
|
|
|
|
Net income (loss) available to common shareholders
|
|
|
|
($0.13)
|
$0.06
|
|
Basic weighted average shares outstanding
|
|
|
|
90,951,000
|
90,692,000
|
|
Diluted weighted average shares outstanding
|
|
|
|
99,934,000
|
99,760,000
|
|
1.
| |
General and administrative includes $688k of General and administrative – property level which is also included in multifamily NOI. |
|
|
|
|
|
FFO & Core FFO
|
|
$ in thousands except per share and ratios (unaudited)
|
|
|
Three Months Ended March 31,
|
|
|
2022
|
2021
|
|
Net income (loss) available to common shareholders
|
($9,092)
|
$7,623
|
|
Add (deduct): Noncontrolling interest in Operating Partnership
|
(898)
|
(2,305)
|
|
Noncontrolling interests in discontinued operations
|
–
|
3,067
|
|
Real estate-related depreciation and amortization on continuing operations(1)
|
28,859
|
30,122
|
|
Real estate-related depreciation and amortization on discontinued operations
|
–
|
659
|
|
Continuing operations: Realized and unrealized (gains) losses on disposition of rental property, net
|
(1,836)
|
–
|
|
Discontinued operations: Realized and unrealized (gains) losses on disposition of rental property, net
|
–
|
(22,781)
|
|
Funds from operations(2)
|
$17,033
|
$16,385
|
|
|
|
|
|
Add/(Deduct):
|
|
|
|
(Gain)/Loss from extinguishment of debt, net
|
6,289
|
–
|
|
Dead deal and other post-sale items in other income/expense
|
–
|
(1,717)
|
|
Land and other impairments
|
2,932
|
413
|
|
(Gain) on disposition of developable land
|
(2,623)
|
–
|
|
CEO and related management changes costs
|
–
|
2,089
|
|
Severance/Rebranding costs
|
7,642
|
1,045
|
|
Lease breakage fee, net
|
(22,664)
|
–
|
|
Core FFO
|
$8,609
|
$18,215
|
|
|
|
|
|
Diluted weighted average shares/units outstanding(6)
|
99,934,000
|
99,760,000
|
|
|
|
|
|
Funds from operations per share-diluted
|
$0.17
|
$0.16
|
|
Core Funds from Operations per share/unit-diluted
|
$0.09
|
$0.18
|
|
Dividends declared per common share
|
$0.00
|
$0.00
|
Notes: See endnotes and “Information About FFO, Core FFO, AFFO, NOI, Adjusted EBITDA & EBITDAre”.
|
|
|
|
|
AFFO & Adjusted EBITDA
|
|
$ in thousands, except per share amounts and ratios (unaudited)
|
|
|
Three Months Ended March 31,
|
|
|
2022
|
2021
|
|
Core FFO (calculated on previous page)
|
$8,609
|
$18,215
|
|
Add (Deduct) Non-Cash Items:
|
|
|
|
Straight-line rent adjustments(3)
|
2,109
|
(1,279)
|
|
Amortization of market lease intangibles, net
|
(110)
|
(1,032)
|
|
Amortization of lease inducements
|
38
|
(13)
|
|
Amortization of stock compensation
|
2,619
|
2,601
|
|
Non-real estate depreciation and amortization
|
325
|
325
|
|
Amortization of debt discount/(premium) and mark-to-market, net
|
–
|
167
|
|
Amortization of deferred financing costs
|
1,177
|
907
|
|
Deduct:
|
|
|
|
Non-incremental revenue generating capital expenditures:
|
|
|
|
Building improvements
|
(3,249)
|
(2,693)
|
|
Tenant improvements and leasing commissions(4)
|
(5,971)
|
(770)
|
|
Tenant improvements and leasing commissions on space vacant for more than one year
|
(6,292)
|
(2,802)
|
|
Core AFFO(2)
|
($745)
|
$13,626
|
|
|
|
|
|
Core FFO (calculated on previous page)
|
$8,609
|
$18,215
|
|
|
|
|
|
Deduct:
|
|
|
|
Equity in earnings (loss) of unconsolidated joint ventures, net
|
487
|
1,456
|
|
Equity in earnings share of depreciation and amortization
|
(2,671)
|
(2,275)
|
|
Add-back:
|
|
|
|
Interest expense
|
15,025
|
18,904
|
|
Recurring JV distributions
|
1,395
|
1,221
|
|
Income (loss) in noncontrolling interest in consolidated joint ventures
|
(974)
|
(1,334)
|
|
Redeemable noncontrolling interest
|
6,437
|
6,471
|
|
Income tax expense
|
115
|
115
|
|
Adjusted EBITDA
|
$28,423
|
$42,773
|
|
|
|
|
|
Net debt at period end(5)
|
$2,139,652
|
$2,541,445
|
|
Net debt to Adjusted EBITDA
|
18.8x
|
14.9x
|
Notes: See endnotes and “Information About FFO, Core FFO, AFFO, NOI, Adjusted EBITDA & EBITDAre”.
|
|
|
|
|
EBITDAre - Quarterly Comparison
|
|
$ in thousands (unaudited)
|
|
|
Three Months Ended March 31,
|
|
|
2022
|
2021
|
|
Net Income (loss) available to common shareholders
|
($9,092)
|
$7,623
|
|
Add/(Deduct):
|
|
|
|
Noncontrolling interest in operating partnership
|
(898)
|
(2,305)
|
|
Noncontrolling interest in discontinued operations
|
–
|
3,067
|
|
Noncontrolling interest in consolidated joint ventures(a)
|
(974)
|
(1,335)
|
|
Redeemable noncontrolling interest
|
6,437
|
6,471
|
|
Interest expense
|
15,025
|
18,904
|
|
Income tax expense
|
115
|
115
|
|
Depreciation and amortization
|
26,513
|
28,832
|
|
Deduct:
|
|
|
|
Continuing operations: Realized and unrealized (gains) losses on disposition of rental property, net
|
(1,836)
|
–
|
|
Discontinued operations: Realized and unrealized (gains) losses on disposition of rental property, net
|
–
|
(22,781)
|
|
Equity in (earnings) loss of unconsolidated joint ventures
|
487
|
1,456
|
|
Add:
|
|
|
|
Property Impairments
|
–
|
–
|
|
Company's share of property NOI's in unconsolidated joint ventures(1)
|
6,027
|
4,233
|
|
EBITDAre
|
$41,804
|
$44,280
|
|
Add:
|
|
|
|
Loss from extinguishment of debt, net
|
6,289
|
–
|
|
Severance/Rebranding costs
|
7,642
|
1,045
|
|
Dead deal and other post-sale items in Other income
|
–
|
(1,717)
|
|
Land and other impairments
|
2,932
|
413
|
|
Gain on disposition of developable land
|
(2,623)
|
–
|
|
CEO and related management changes
|
–
|
2,089
|
|
Lease breakage fee, net
|
(22,701)
|
–
|
|
Adjusted EBITDAre
|
$33,343
|
$46,110
|
|
(a) Noncontrolling interests in consolidated joint ventures:
|
|
|
|
BLVD 425
|
(157)
|
(313)
|
|
BLVD 401
|
(730)
|
(767)
|
|
Port Imperial Garage South
|
(89)
|
(185)
|
|
Port Imperial Retail South
|
12
|
(9)
|
|
Other consolidated joint ventures
|
–
|
(61)
|
|
Net losses in noncontrolling interests
|
($964)
|
($1,335)
|
|
Depreciation in noncontrolling interest in consolidated JV's
|
700
|
697
|
|
Funds from operations - noncontrolling interest in consolidated JV's
|
($264)
|
($638)
|
|
Interest expense in noncontrolling interest in consolidated JV's
|
793
|
807
|
|
Net operating income before debt service in consolidated JV's
|
$529
|
$169
|
Notes: See unconsolidated joint venture NOI details and “Information About FFO, Core FFO, AFFO, NOI, Adjusted EBITDA & EBITDAre”.
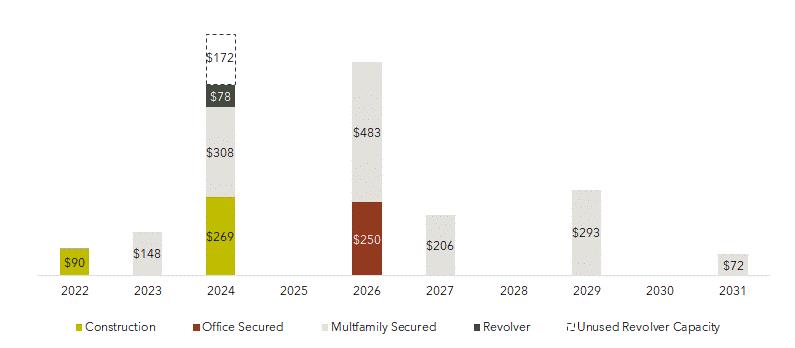
Debt Summary & Maturity Schedule
|
·
| |
Over 70% of the Company’s total debt portfolio (consolidated and unconsolidated) is hedged or fixed at a weighted average interest rate of 3.78% with a maturity of 5.2 years |
|
|
|
|
|
|
|
|
|
|
|
$ in thousands
|
|
|
|
|
|
|
|
|
|
|
|
|
%
|
|
Weighted Average
|
|
Weighted Average
|
|
|
|
Balance
|
|
of Total
|
|
Interest Rate(1)
|
|
Maturity in Years
|
|
|
Fixed Rate Debt
|
|
|
|
|
|
|
|
|
|
Fixed Rate Secured Debt
|
$1,532,540
|
|
69.8%
|
|
3.70%
|
|
4.76
|
|
|
|
|
|
|
|
|
|
|
|
|
Variable Rate Debt
|
|
|
|
|
|
|
|
|
|
Variable Rate Secured Debt
|
664,107
|
|
30.2%
|
|
3.51%
|
|
2.52
|
|
|
Totals / Weighted Average
|
$2,196,647
|
|
100.0%
|
|
3.64%
|
|
4.09
|
|
|
Unamortized Deferred Financing Costs
|
(9,704)
|
|
|
|
|
|
|
|
|
Total Consolidated Debt, net
|
$2,186,943
|
|
|
|
|
|
|
|
|
Partners’ Share
|
(73,585)
|
|
|
|
|
|
|
|
|
VRE Share of Total Consolidated Debt, net(2)
|
$2,113,358
|
|
|
|
|
|
|
|
|
|
|
|
|
|
|
|
|
|
|
Unconsolidated Secured Debt
|
|
|
|
|
|
|
|
|
|
VRE Share
|
364,118
|
|
52.7%
|
|
3.63%
|
|
5.95
|
|
|
Partners’ Share
|
327,184
|
|
47.3%
|
|
3.63%
|
|
5.95
|
|
|
Total Unconsolidated Secured Debt
|
$691,302
|
|
100.0%
|
|
3.63%
|
|
5.95
|
|
Debt Maturity Schedule
|
1.
| |
The actual weighted average LIBOR rate for the Company’s outstanding variable rate debt was 0.31 percent as of March 31, 2022, plus the applicable spread. |
|
2.
| |
Minority interest share of consolidated debt is comprised of $33.7 million at BLVD 425, $30.1 million at BLVD 401 and $9.8 million at Port Imperial South Garage. |
|
|
|
|
|
|
|
|
|
Multifamily Debt Profile
|
|
|
|
|
|
$ in thousands
|
|
|
|
|
|
|
|
Effective
|
|
March 31,
|
|
Date of
|
|
|
Lender
|
Interest Rate(1)
|
|
2022
|
|
Maturity
|
|
Secured Construction Loans
|
|
|
|
|
|
|
|
RiverHouse 9(2)
|
Bank of New York Mellon
|
LIBOR+ 2.13%
|
|
90,024
|
|
12/19/22
|
|
Haus25(3)
|
QuadReal Finance
|
LIBOR+ 2.70%
|
|
269,083
|
|
12/01/24
|
|
Total Secured Construction Debt
|
|
|
|
359,107
|
|
|
|
Secured Permanent Loans
|
|
|
|
|
|
|
|
Marriott Hotels at Port Imperial
|
Fifth Third Bank
|
LIBOR+ 3.40%
|
|
89,000
|
|
04/01/23
|
|
Portside at East Pier
|
CBRE Capital Markets/FreddieMac
|
3.57%
|
|
58,998
|
|
08/01/23
|
|
Signature Place
|
Nationwide Life Insurance Company
|
3.74%
|
|
43,000
|
|
08/01/24
|
|
Liberty Towers
|
American General Life Insurance Company
|
3.37%
|
|
265,000
|
|
10/01/24
|
|
Portside II at East Pier
|
New York Life Insurance Co.
|
4.56%
|
|
97,000
|
|
03/10/26
|
|
BLVD 425
|
New York Life Insurance Co.
|
4.17%
|
|
131,000
|
|
08/10/26
|
|
BLVD 401
|
New York Life Insurance Co.
|
4.29%
|
|
117,000
|
|
08/10/26
|
|
The Upton(4)
|
Bank of New York Mellon
|
LIBOR+ 1.58%
|
|
75,000
|
|
10/27/26
|
|
145 Front at City Square
|
MUFG Union Bank
|
LIBOR+ 1.84%
|
|
63,000
|
|
12/10/26
|
|
Quarry Place at Tuckahoe
|
Natixis Real Estate Capital LLC
|
4.48%
|
|
41,000
|
|
08/05/27
|
|
BLVD 475
|
Northwestern Mutual Life
|
2.91%
|
|
165,000
|
|
11/10/27
|
|
RiverHouse 11
|
Northwestern Mutual Life
|
4.52%
|
|
100,000
|
|
01/10/29
|
|
Soho Lofts
|
New York Community Bank
|
3.77%
|
|
160,000
|
|
07/01/29
|
|
Port Imperial Garage South
|
American General Life & A/G PC
|
4.85%
|
|
32,542
|
|
12/01/29
|
|
The Emery
|
New York Community Bank
|
3.21%
|
|
72,000
|
|
01/01/31
|
|
Principal Balance Outstanding
|
|
|
|
1,509,540
|
|
|
|
Unamortized Deferred Financing Costs
|
|
|
|
(8,810)
|
|
|
|
Total Secured Permanent Debt
|
|
|
|
1,500,730
|
|
|
|
Total Debt - Multifamily Portfolio - A
|
|
|
|
1,859,837
|
|
|
|
1.
| |
Effective rate of debt, including deferred financing costs, comprised of the cost of terminated treasury lock agreements (if any), debt initiation costs, mark-to-market adjustment of acquired debt and other transaction costs, as applicable. |
|
2.
| |
RiverHouse 9 construction loan can be extended to December 19, 2023. |
|
3.
| |
Haus25 construction loan can be extended to December 1, 2025. |
|
4.
| |
Includes a 3-year LIBOR cap at a strike rate of 1.0%. |
|
Office Debt Profile
|
|
|
$ in thousands
|
|
|
|
|
|
|
|
|
|
Effective
|
|
March 31,
|
|
Date of
|
|
|
Lender
|
Interest Rate(1)
|
|
2022
|
|
Maturity
|
|
Secured Permanent Loans
|
|
|
|
|
|
|
|
101 Hudson
|
Wells Fargo CMBS
|
3.20%
|
|
250,000
|
|
10/11/26
|
|
Principal Balance Outstanding
|
|
|
|
250,000
|
|
|
|
Unamortized Deferred Financing Costs
|
|
|
|
(894)
|
|
|
|
Total Secured Debt - Office Portfolio
|
|
|
|
249,106
|
|
|
|
|
|
|
|
|
|
|
|
Secured Revolving Credit Facilities & Term Loans:
|
|
|
|
|
|
|
|
Secured Revolving Credit Facility
|
8 Lenders
|
LIBOR + 2.75%
|
|
78,000
|
|
05/06/24
|
|
|
|
|
|
|
|
|
|
Total Debt - Office Portfolio - B
|
|
|
|
327,106
|
|
|
|
|
|
|
|
|
|
|
|
Total Debt - Multifamily Portfolio - A
|
|
|
|
1,859,837
|
|
|
|
|
|
|
|
|
|
|
|
Total Consolidated Debt: A + B = C
|
|
|
|
2,186,943
|
|
|
|
Unconsolidated Joint Ventures
|
|
$ in thousands
|
|
|
|
|
|
|
|
|
|
|
|
|
Physical
|
VRE's Nominal
|
Q1 2022
|
Total
|
VRE Share
|
VRE Share
|
|
Property
|
|
Units
|
Occupancy
|
Ownership(1)
|
NOI(2)
|
Debt
|
of Q1 NOI
|
of Debt
|
|
|
|
|
|
|
|
|
|
|
|
Multifamily
|
|
|
|
|
|
|
|
|
|
Urby Harborside
|
|
762
|
98.3%
|
85.0%
|
$4,710
|
$190,480
|
$4,004
|
$161,908
|
|
RiverTrace at Port Imperial
|
|
316
|
98.1%
|
22.5%
|
1,830
|
82,000
|
412
|
18,450
|
|
Capstone at Port Imperial
|
|
360
|
100.0%
|
40.0%
|
1,896
|
135,000
|
758
|
54,000
|
|
Riverpark at Harrison
|
|
141
|
97.2%
|
45.0%
|
453
|
30,192
|
204
|
13,586
|
|
Metropolitan at 40 Park
|
|
130
|
96.2%
|
25.0%
|
879
|
42,567
|
220
|
10,642
|
|
Metropolitan Lofts
|
|
59
|
93.2%
|
50.0%
|
236
|
18,200
|
118
|
9,100
|
|
Station House
|
|
378
|
94.2%
|
50.0%
|
1,424
|
92,863
|
712
|
46,432
|
|
Subtotal - Multifamily
|
|
2,146
|
97.5%
|
54.9%
|
$11,428
|
$591,302
|
$6,428
|
$314,118
|
|
|
|
|
|
|
|
|
|
|
|
Retail/Hotel
|
|
|
|
|
|
|
|
|
|
Hyatt Regency Jersey City
|
|
351
|
49.8%
|
50.0%
|
($813)
|
$100,000
|
($407)
|
$50,000
|
|
Total Operating
|
|
|
|
|
$10,615
|
$691,302
|
$6,021
|
$364,118
|
|
|
|
|
|
|
|
|
|
|
|
Other Unconsolidated JVs
|
|
|
|
|
$13
|
–
|
$6
|
–
|
|
Total Unconsolidated JVs
|
|
|
|
|
$10,628
|
$691,302
|
$6,027
|
$364,118
|
Notes: See “Information About FFO, Core FFO, AFFO, NOI, Adjusted EBITDA & EBITDAre”.
|
1.
| |
Amounts represent the Company’s share based on ownership percentage. |
|
2.
| |
The sum of property-level revenue, straight-line and ASC 805 adjustments; less: operating expense, real estate taxes and utilities.
|
Multifamily Portfolio
|
|
|
|
|
|
|
|
|
|
|
|
|
|
|
|
Operating Portfolio - Multifamily
|
|
|
|
|
|
|
|
$ in thousands, except per home
|
|
|
|
|
|
|
|
|
|
|
|
|
|
|
|
Operating Highlights
|
|
|
|
|
|
|
|
|
|
|
|
|
|
|
|
|
|
|
|
|
|
|
Percentage
|
Average Revenue
|
|
|
|
|
|
|
|
|
Rentable
|
Avg.
|
Year
|
Occupied
|
per Home
|
NOI
|
Debt
|
|
|
Location
|
Ownership
|
Apartments
|
SF
|
Size
|
Complete
|
Q1 2022
|
Q4 2021
|
Q1 2022
|
Q4 2021
|
Q1 2022
|
Q4 2021
|
Balance
|
|
New Jersey Waterfront
|
|
|
|
|
|
|
|
|
|
|
|
|
|
|
Liberty Towers
|
Jersey City, NJ
|
100.0%
|
648
|
602,210
|
929
|
2003
|
97.7%
|
95.7%
|
$3,302
|
$3,211
|
$3,882
|
$3,422
|
$265,000
|
|
BLVD 425
|
Jersey City, NJ
|
74.3%
|
412
|
369,515
|
897
|
2003
|
96.8%
|
95.6%
|
3,101
|
3,015
|
2,121
|
2,082
|
131,000
|
|
BLVD 475
|
Jersey City, NJ
|
100.0%
|
523
|
475,459
|
909
|
2011
|
97.7%
|
96.6%
|
3,218
|
3,108
|
2,735
|
2,871
|
165,000
|
|
BLVD 401
|
Jersey City, NJ
|
74.3%
|
311
|
273,132
|
878
|
2016
|
97.7%
|
96.5%
|
3,311
|
3,123
|
1,804
|
1,713
|
117,000
|
|
Soho Lofts
|
Jersey City, NJ
|
100.0%
|
377
|
449,067
|
1,191
|
2017
|
95.5%
|
97.3%
|
3,791
|
3,684
|
2,309
|
2,111
|
160,000
|
|
Urby Harborside
|
Jersey City, NJ
|
85.0%
|
762
|
474,476
|
623
|
2017
|
98.3%
|
97.0%
|
3,044
|
3,044
|
4,710
|
4,226
|
190,480
|
|
RiverHouse 9
|
Weehawken, NJ
|
100.0%
|
313
|
245,127
|
783
|
2021
|
100.0%
|
94.9%
|
3,187
|
N/A
|
1,852
|
947
|
90,024
|
|
RiverHouse 11
|
Weehawken, NJ
|
100.0%
|
295
|
250,591
|
849
|
2018
|
98.0%
|
98.0%
|
3,461
|
3,446
|
2,003
|
1,868
|
100,000
|
|
RiverTrace at Port Imperial
|
West New York, NJ
|
22.5%
|
316
|
295,767
|
936
|
2014
|
98.1%
|
95.6%
|
3,150
|
3,150
|
1,830
|
2,001
|
82,000
|
|
Capstone at Port Imperial
|
West New York, NJ
|
40.0%
|
360
|
337,991
|
939
|
2021
|
100.0%
|
99.2%
|
3,731
|
N/A
|
1,896
|
1,595
|
135,000
|
|
New Jersey Waterfront Subtotal
|
82.4%
|
4,317
|
3,773,335
|
874
|
|
97.9%
|
96.6%
|
$3,297
|
$3,194
|
$25,142
|
$22,836
|
$1,435,504
|
|
|
|
|
|
|
|
|
|
|
|
|
|
|
|
|
Massachusetts
|
|
|
|
|
|
|
|
|
|
|
|
|
|
|
Portside at East Pier
|
East Boston, MA
|
100.0%
|
181
|
156,091
|
862
|
2015
|
97.7%
|
96.6%
|
$2,832
|
$2,720
|
$1,016
|
$957
|
$58,998
|
|
Portside II at East Pier
|
East Boston, MA
|
100.0%
|
296
|
230,614
|
779
|
2018
|
95.5%
|
97.6%
|
2,905
|
2,758
|
1,645
|
1,481
|
97,000
|
|
145 Front at City Square
|
Worcester, MA
|
100.0%
|
365
|
304,936
|
835
|
2018
|
97.8%
|
98.9%
|
2,246
|
2,182
|
1,326
|
1,481
|
63,000
|
|
The Emery
|
Revere, MA
|
100.0%
|
326
|
273,140
|
838
|
2020
|
97.5%
|
96.0%
|
2,427
|
2,298
|
1,376
|
1,246
|
72,000
|
|
Massachusetts Subtotal
|
100.0%
|
1,168
|
964,781
|
826
|
|
97.1%
|
97.4%
|
$2,554
|
$2,444
|
$5,363
|
$5,165
|
$290,998
|
|
|
|
|
|
|
|
|
|
|
|
|
|
|
|
|
Other
|
|
|
|
|
|
|
|
|
|
|
|
|
|
|
The Upton
|
Short Hills, NJ
|
100.0%
|
193
|
217,030
|
1,125
|
2021
|
98.4%
|
99.5%
|
$3,655
|
N/A
|
$1,098
|
$1,164
|
$75,000
|
|
Signature Place
|
Morris Plains, NJ
|
100.0%
|
197
|
203,716
|
1,034
|
2018
|
98.5%
|
98.5%
|
2,757
|
2,723
|
800
|
789
|
43,000
|
|
Quarry Place at Tuckahoe
|
Eastchester, NY
|
100.0%
|
108
|
105,551
|
977
|
2016
|
98.1%
|
98.1%
|
3,648
|
3,659
|
711
|
615
|
41,000
|
|
RiverPark at Harrison
|
Harrison, NJ
|
45.0%
|
141
|
124,774
|
885
|
2014
|
97.2%
|
98.6%
|
2,337
|
2,337
|
453
|
500
|
30,192
|
|
Metropolitan at 40 Park(1)
|
Morristown, NJ
|
25.0%
|
130
|
124,237
|
956
|
2010
|
96.2%
|
94.6%
|
3,081
|
3,081
|
538
|
500
|
36,500
|
|
Metropolitan Lofts
|
Morristown, NJ
|
50.0%
|
59
|
54,683
|
927
|
2018
|
93.2%
|
89.8%
|
3,069
|
3,069
|
236
|
238
|
18,200
|
|
Station House
|
Washington, DC
|
50.0%
|
378
|
290,348
|
768
|
2015
|
94.2%
|
91.5%
|
2,615
|
2,615
|
1,424
|
1,070
|
92,863
|
|
Other Subtotal
|
67.4%
|
1,206
|
1,120,339
|
929
|
|
96.4%
|
95.6%
|
$2,937
|
$2,795
|
$5,260
|
$4,876
|
$336,755
|
|
|
|
|
|
|
|
|
|
|
|
|
|
|
|
|
Operating Portfolio(2)
|
82.7%
|
6,691
|
5,858,455
|
876
|
|
97.5%
|
96.6%
|
$3,103
|
$2,974
|
$35,765
|
$32,877
|
$2,063,257
|
Notes: See “Information About FFO, Core FFO, AFFO, NOI, Adjusted EBITDA & EBITDAre”. Unconsolidated joint venture income represented at 100% venture NOI. Average Revenue per Home is calculated as total apartment revenue for the quarter divided by the average percent occupied for the quarter, divided by the number of apartments and divided by three.
|
1.
| |
As of March 31, 2022, Priority Capital included Metropolitan at $20,914,422 (Prudential). |
|
2.
| |
Operating Portfolio is properties that have achieved over 95% leased for six consecutive weeks. Excludes approximately 150,000 sqft of ground floor retail.
|
|
|
|
|
|
|
|
|
|
|
|
|
|
Operating Portfolio - Commercial
|
|
|
|
|
$ in thousands
|
|
|
|
|
|
|
|
|
|
|
|
|
|
|
|
|
|
Percentage
|
Percentage
|
|
|
|
|
|
|
|
|
Rentable
|
Year
|
Leased
|
Leased
|
NOI
|
NOI
|
Debt
|
|
Commercial
|
Location
|
Ownership
|
Spaces
|
SF
|
Complete
|
Q1 2022
|
Q4 2021
|
Q1 2022
|
Q4 2021
|
Balance
|
|
Port Imperial Garage South
|
Weehawken, NJ
|
70.0%
|
800
|
320,426
|
2013
|
N/A
|
N/A
|
$272
|
$382
|
$32,542
|
|
Port Imperial Garage North
|
Weehawken, NJ
|
100.0%
|
786
|
304,617
|
2016
|
N/A
|
N/A
|
(85)
|
(51)
|
–
|
|
Port Imperial Retail South
|
Weehawken, NJ
|
70.0%
|
|
18,064
|
2013
|
88.1%
|
88.1%
|
128
|
187
|
–
|
|
Port Imperial Retail North
|
Weehawken, NJ
|
100.0%
|
|
8,400
|
2016
|
100.0%
|
100.0%
|
161
|
78
|
–
|
|
Riverwalk at Port Imperial
|
West New York, NJ
|
100.0%
|
|
30,423
|
2008
|
65.0%
|
65.0%
|
184
|
177
|
–
|
|
Shops at 40 Park
|
Morristown, NJ
|
25.0%
|
|
50,973
|
2010
|
69.0%
|
69.0%
|
341
|
360
|
6,067
|
|
|
|
|
|
|
|
|
|
|
|
|
|
Commercial Total
|
|
80.9%
|
|
732,903
|
|
73.5%
|
73.5%
|
$1,001
|
$1,133
|
$38,609
|
|
|
|
|
|
|
|
|
|
|
|
|
|
|
|
|
|
|
|
Average
|
Average
|
|
|
|
|
|
|
|
|
|
|
Year
|
Occupancy
|
Occupancy
|
ADR
|
ADR
|
NOI
|
NOI
|
Debt
|
|
Hotels
|
Location
|
Ownership
|
Keys
|
Complete
|
Q1 2022
|
Q4 2021
|
Q1 2022
|
Q4 2021
|
Q1 2022
|
Q4 2021
|
Balance
|
|
Envue, Autograph Collection
|
Weehawken, NJ
|
100.0%
|
208
|
2019
|
38.8%
|
61.5%
|
$196
|
$203
|
($1,137)
|
$509
|
|
|
Residence Inn at Port Imperial
|
Weehawken, NJ
|
100.0%
|
164
|
2018
|
72.3%
|
83.2%
|
156
|
181
|
118
|
719
|
|
|
Marriott Hotels at Port Imperial
|
|
100.0%
|
372
|
|
53.6%
|
71.1%
|
$156
|
$181
|
($1,019)
|
$1,228
|
$89,000
|
Notes: See “Information About FFO, Core FFO, AFFO, NOI, Adjusted EBITDA & EBITDAre”.
In-Construction Portfolio & Land Bank
|
·
| |
There is no remaining equity to be funded |
|
|
|
|
|
|
|
|
|
|
|
|
|
|
|
|
|
|
|
$ in thousands
|
|
|
|
|
|
|
|
|
|
|
|
|
|
|
|
|
|
|
|
|
|
Project Capitalization - Total
|
|
Capital as of Q1 2022
|
|
Development Schedule
|
|
|
|
|
|
|
Apartment
|
|
|
|
Third
|
|
|
|
|
|
|
|
Projected
|
Projected
|
|
|
|
|
Homes/
|
|
|
VRE
|
Party
|
|
Dev
|
Debt
|
|
|
Initial
|
Project
|
Stabilized
|
Stabilized
|
|
|
Location
|
Ownership
|
Keys
|
Costs
|
Debt(1)
|
Capital
|
Capital
|
|
Costs(2)
|
Balance
|
|
Start
|
Occupancy
|
Stabilization
|
Yield on Cost
|
NOI
|
|
Consolidated
|
|
|
|
|
|
|
|
|
|
|
|
|
|
|
|
|
|
Haus25
|
Jersey City, NJ
|
100.0%
|
750
|
$469,510
|
$300,000
|
$169,510
|
–
|
|
$438,593
|
$269,083
|
|
Q1 2019
|
Q2 2022
|
Q2 2023
|
5.98%
|
$28,098
|
|
|
|
|
|
|
|
|
|
Potential
|
|
Land Bank
|
|
|
Units
|
|
Hudson Waterfront
|
|
5,324
|
|
Greater NY/NJ
|
|
|
1,069
|
|
Boston Metro
|
|
|
864
|
|
|
|
|
|
|
Land Bank Total
|
|
7,257
|
Notes: See “Information About FFO, Core FFO, AFFO, NOI, Adjusted EBITDA & EBITDAre”. NOI amounts are projected only. In-Construction Portfolio are assets that are under construction and have not yet commenced initial leasing activities. Lease-Up Portfolio are the assets that have commenced initial operations but have not yet achieved Project Stabilization, achieved over 95% leased for six consecutive weeks. Total Costs represents full project budget, including land and developer fees, and interest expense through project completion as evidenced by a certificate of completion or issuance of a final or temporary certificate of occupancy. VRE Capital represents cash equity that the Company has contributed or has a future obligation to contribute to a project. Projected Stabilized Residential NOI assumes NOI at projected property revenue at 95% occupancy. Projected Stabilized Yield on Cost represents Projected Stabilized Residential NOI divided by Total Costs.
|
1.
| |
Represents maximum loan proceeds. |
|
2.
| |
Represents development costs funded with debt or capital as of March 31, 2022.
|

Office Portfolio
|
|
|
|
|
|
|
|
|
|
|
|
|
|
|
|
|
|
|
Property Listing
|
|
|
|
|
|
|
|
|
|
|
|
|
|
|
|
|
|
|
|
|
|
|
|
|
|
|
|
|
|
|
|
|
|
|
|
|
|
|
|
|
|
Avg. Base Rent
|
|
2022 Expirations
|
|
Building
|
|
Location
|
|
Total SF
|
|
Leased SF
|
|
% Leased
|
|
+ Escalations(1)
|
|
SF
|
|
% Total
|
|
In-Place Rent
|
|
|
|
|
|
|
|
|
|
|
|
|
|
|
|
|
|
|
|
101 Hudson
|
|
Jersey City, NJ
|
|
1,246,283
|
|
1,041,892
|
|
83.6%
|
|
$45.52
|
|
45,397
|
|
4%
|
|
$41.52
|
|
Harborside 2 & 3
|
|
Jersey City, NJ
|
|
1,487,222
|
|
1,306,330
|
|
87.8%
|
|
42.53
|
|
28,644
|
|
2%
|
|
43.20
|
|
Harborside 5
|
|
Jersey City, NJ
|
|
977,225
|
|
400,079
|
|
40.9%
|
|
46.73
|
|
9,102
|
|
1%
|
|
55.73
|
|
Harborside 6
|
|
Jersey City, NJ
|
|
231,856
|
|
47,542
|
|
20.5%
|
|
N/A
|
|
–
|
|
–
|
|
-
|
|
Total Waterfront (In-Service)
|
|
|
|
3,942,586
|
|
2,795,843
|
|
70.9%
|
|
$44.29
|
|
83,143
|
|
2%
|
|
$43.66
|
|
Harborside 1(2)
|
|
Jersey City, NJ
|
|
399,578
|
|
–
|
|
N/A
|
|
N/A
|
|
N/A
|
|
N/A
|
|
N/A
|
|
Total Waterfront
|
|
|
|
4,342,164
|
|
2,795,843
|
|
64.4%
|
|
$44.29
|
|
83,143
|
|
2%
|
|
$43.66
|
|
23 Main Street(3)
|
|
Holmdel, NJ
|
|
350,000
|
|
350,000
|
|
100.0%
|
|
27.61
|
|
–
|
|
–
|
|
-
|
|
Total Suburban
|
|
|
|
350,000
|
|
350,000
|
|
100.0%
|
|
$27.61
|
|
–
|
|
–
|
|
–
|
|
|
|
|
|
|
|
|
|
|
|
|
|
|
|
|
|
|
|
Total In-Service Office Portfolio
|
|
|
|
4,292,586
|
|
3,145,843
|
|
73.3%
|
|
$42.43
|
|
83,143
|
|
2%
|
|
$43.66
|
|
1.
| |
Includes annualized base rental revenue plus escalations for square footage leased to commercial and retail tenants only. Excludes leases for amenity, parking and month-to-month tenants. Annualized base rental revenue plus escalations is based on actual March 2022 billings times 12. For leases whose rent commences after January 1, 2022 annualized base rental revenue is based on the first full month’s billing times 12. As annualized base rental revenue is not derived from historical GAAP results, historical results may differ from those set forth above. |
|
2.
| |
Harborside 1 was taken out of service in Q4 2019. |
|
3.
| |
Average base rents + escalations reflect rental values on a triple net basis. |
|
Leasing Rollforwards & Activity
|
|
|
|
|
|
|
|
|
|
|
|
|
|
|
|
|
|
|
|
Leasing Rollforwards
|
|
|
|
|
|
|
|
|
|
|
|
|
|
|
|
|
|
|
|
|
|
|
|
For the three months ended March 31, 2022
|
|
|
|
|
|
|
|
|
|
|
|
|
|
|
|
|
|
|
|
|
|
|
|
|
|
Inventory
|
Leased (SF)
|
|
|
|
|
|
|
|
|
Leased (%)
|
Inventory
|
Leased (SF)
|
Acquired/
|
Acquired/
|
Expiring/
|
Incoming
|
Net Leasing
|
Inventory
|
Leased (SF)
|
Leased (%)
|
|
|
Q4 2021
|
Q4 2021
|
Q4 2021
|
Disposed
|
Disposed
|
Adj. SF
|
SF
|
Activity
|
Q1 2022
|
Q1 2022
|
Q1 2022
|
|
|
|
|
|
|
|
|
|
|
|
|
|
|
Waterfront
|
72.0%
|
4,508,801
|
3,244,653
|
(566,215)
|
(460,352)
|
(130,650)
|
142,192
|
11,542
|
3,942,586
|
2,795,843
|
70.9%
|
|
Suburban
|
100.0%
|
350,000
|
350,000
|
–
|
–
|
–
|
–
|
–
|
350,000
|
350,000
|
100.0%
|
|
Subtotals
|
74.0%
|
4,858,801
|
3,594,653
|
(566,215)
|
(460,352)
|
(130,650)
|
142,192
|
11,542
|
4,292,586
|
3,145,843
|
73.3%
|
|
|
|
|
|
|
|
|
|
|
|
|
|
Leasing Activity
|
|
|
|
|
|
|
|
|
|
|
|
|
|
|
|
|
|
|
|
|
For the three months ended March 31, 2022
|
|
|
|
|
|
|
|
|
|
|
|
|
|
|
|
|
|
|
Number of
|
|
Total
|
|
New Leases
|
Renewed / Other
|
Weighted Avg.
|
Weighted Avg.
|
Wtd. Avg.
|
Wtd. Avg. Costs
|
|
|
Transactions
|
|
SF
|
|
SF
|
Retained (SF)
|
SF
|
Term (Yrs)
|
Base Rent ($)(1)
|
SF Per Year ($)
|
|
|
|
|
|
|
|
|
|
|
|
|
|
Waterfront
|
4
|
|
142,192
|
|
142,192
|
–
|
35,548
|
15.3
|
$42.62
|
$8.43
|
|
Suburban
|
–
|
|
–
|
|
–
|
–
|
–
|
–
|
–
|
|
|
Subtotals
|
4
|
|
142,192
|
|
142,192
|
–
|
35,548
|
15.3
|
$42.62
|
$8.43
|
|
1.
| |
Inclusive of escalations.
|
|
|
|
|
|
|
|
|
|
|
|
|
|
|
Top 15 Tenants
|
|
|
|
|
|
|
|
|
|
|
|
|
|
|
|
|
|
|
|
|
|
|
|
Annualized
|
|
Company
|
|
Square
|
|
|
|
Year of
|
|
|
Number of
|
|
Base Rental
|
|
Annualized Base
|
|
Feet
|
|
Total Company
|
|
Lease
|
|
|
Properties
|
|
Revenue ($'000)(1)
|
|
Rental Revenue (%)(2)
|
|
Leased
|
|
Leased SF (%)(2)
|
|
Expiration
|
|
|
|
|
|
|
|
|
|
|
|
|
|
|
Merrill Lynch Pierce Fenner
|
1
|
|
$9,418
|
|
9.2%
|
|
388,207
|
|
13.0%
|
|
2027
|
|
MUFG Bank Ltd.
|
1
|
|
5,689
|
|
5.5%
|
|
137,076
|
|
4.6%
|
|
2029
|
|
Collectors Universe, Inc.
|
1
|
|
5,545
|
|
5.4%
|
|
146,812
|
|
4.9%
|
|
(3)
|
|
E-Trade Financial Corporation
|
1
|
|
5,505
|
|
5.4%
|
|
132,265
|
|
4.4%
|
|
2031
|
|
Vonage America Inc.
|
1
|
|
5,023
|
|
4.9%
|
|
350,000
|
|
11.7%
|
|
2023
|
|
Sumitomo Mitsui Banking Corp
|
1
|
|
4,624
|
|
4.5%
|
|
111,105
|
|
3.7%
|
|
2036
|
|
Arch Insurance Company
|
1
|
|
4,326
|
|
4.2%
|
|
106,815
|
|
3.6%
|
|
2024
|
|
Brown Brothers Harriman & Co.
|
1
|
|
4,018
|
|
3.9%
|
|
114,798
|
|
3.9%
|
|
2026
|
|
First Data Corporation
|
1
|
|
3,782
|
|
3.7%
|
|
88,374
|
|
3.0%
|
|
(4)
|
|
Tp Icap Americas Holdings Inc
|
1
|
|
3,446
|
|
3.4%
|
|
100,759
|
|
3.4%
|
|
(5)
|
|
Cardinia Real Estate Llc
|
1
|
|
3,239
|
|
3.2%
|
|
79,771
|
|
2.7%
|
|
2032
|
|
New Jersey City University
|
1
|
|
3,011
|
|
2.9%
|
|
84,929
|
|
2.8%
|
|
2035
|
|
Zurich American Ins. Co.
|
1
|
|
2,915
|
|
2.8%
|
|
64,414
|
|
2.2%
|
|
2032
|
|
BETMGM, LLC
|
1
|
|
2,800
|
|
2.7%
|
|
71,343
|
|
2.4%
|
|
(6)
|
|
Amtrust Financial Services
|
1
|
|
2,614
|
|
2.5%
|
|
76,892
|
|
2.6%
|
|
2023
|
|
Totals
|
|
|
$65,955
|
|
64.2%
|
|
2,053,560
|
|
68.9%
|
|
|
|
1.
| |
Annualized base rental revenue is based on actual March 2022 billings times 12. For leases whose rent commences after January 1, 2022, annualized base rental revenue is based on the first full month’s billing times 12. As annualized base rental revenue is not derived from historical GAAP results, historical results may differ from those set forth above. |
|
2.
| |
Represents the percentage of space leased and annual base rental revenue to commercial tenants only. |
|
3.
| |
Collectors Universe – 16,393 square feet expire in 2023; 130,419 square feet expire in 2038. |
|
4.
| |
First Data Corporation – 8,014 square feet expire in 2026; 80,360 square feet expire in 2029. |
|
5.
| |
Tp Icap Americas Holdings – 63,372 square feet expire in 2023; 37,387 square feet expire in 2033. |
|
6.
| |
BETMGM – 22,300 square feet expire in 2022; 49,043 square feet expire in 2032.
|
|
|
|
|
|
|
|
|
|
Lease Expirations
|
|
|
|
|
|
|
|
|
|
|
|
|
|
|
Number of
|
Net Rentable Area
|
Percentage of Total Leased
|
Annualized Base
|
Average Annualized Base Rent
|
Percentage of
|
|
Year of Expiration/Market
|
Leases
|
Subject to Expiring
|
Square Feet Represented
|
Rental Revenue Under
|
Per Net Rentable Square Foot
|
Annual Base Rent
|
|
|
Expiring(1)
|
Leases (SF)
|
by Expiring Leases (%)
|
Expiring Leases ($'000)(2)(3)
|
Represented by
|
Under
|
|
|
|
|
|
|
Expiring Leases ($)
|
Expiring Leases (%)
|
|
2022
|
|
|
|
|
|
|
|
Waterfront
|
13
|
83,143
|
2.8%
|
$3,403
|
$40.93
|
3.3%
|
|
Total – 2022
|
13
|
83,143
|
2.8%
|
$3,403
|
$40.93
|
3.3%
|
|
2023
|
|
|
|
|
|
|
|
Waterfront
|
15
|
352,464
|
11.8%
|
$13,367
|
$37.92
|
13.0%
|
|
Suburban
|
1
|
350,000
|
11.7%
|
$5,023
|
$14.35
|
4.9%
|
|
Total – 2023
|
16
|
702,464
|
23.6%
|
$18,389
|
$26.18
|
17.9%
|
|
2024
|
|
|
|
|
|
|
|
Waterfront
|
13
|
215,003
|
7.2%
|
$8,564
|
$39.83
|
8.3%
|
|
Total – 2024
|
13
|
215,003
|
7.2%
|
$8,564
|
$39.83
|
8.3%
|
|
2025
|
|
|
|
|
|
|
|
Waterfront
|
12
|
115,660
|
3.9%
|
$3,714
|
$32.11
|
3.6%
|
|
Total – 2025
|
12
|
115,660
|
3.9%
|
$3,714
|
$32.11
|
3.6%
|
|
2026
|
|
|
|
|
|
|
|
Waterfront
|
9
|
219,408
|
7.4%
|
$8,196
|
$37.35
|
8.0%
|
|
Total – 2026
|
9
|
219,408
|
7.4%
|
$8,196
|
$37.35
|
8.0%
|
|
2027
|
|
|
|
|
|
|
|
Waterfront
|
7
|
422,375
|
14.2%
|
$10,932
|
$25.88
|
10.7%
|
|
Total – 2027
|
7
|
422,375
|
14.2%
|
$10,932
|
$25.88
|
10.7%
|
|
2028 and thereafter
|
|
|
|
|
|
|
|
Waterfront
|
32
|
1,222,355
|
41.0%
|
$49,392
|
$40.41
|
48.1%
|
|
TOTAL – 2028 and thereafter
|
32
|
1,222,355
|
41.0%
|
$49,392
|
$40.41
|
48.1%
|
|
|
|
|
|
|
|
|
|
Totals by Type
|
|
|
|
|
|
|
|
Waterfront
|
101
|
2,630,408
|
88.3%
|
$97,568
|
$37.09
|
95.1%
|
|
Suburban
|
1
|
350,000
|
11.7%
|
$5,023
|
$14.35
|
4.9%
|
|
Totals/Weighted Average
|
102
|
2,980,408
|
100.0%
|
$102,590
|
$34.42
|
100.0%
|
|
1.
| |
Includes office & standalone retail property tenants only. Excludes leases for amenity, retail, parking & month‑to‑month tenants. Some tenants have multiple leases. |
|
2.
| |
Annualized base rental revenue is based on actual March 2022 billings times 12. For leases whose rent commences after January 1, 2022, annualized base rental revenue is based on the first full month’s billing times 12. As annualized base rental revenue is not derived from historical GAAP results, historical results may differ from those set forth above. |
|
3.
| |
Includes leases in effect as of the period end date, some of which have commencement dates in the future. |
Endnotes
FFO, Core FFO, AFFO, NOI, Adjusted EBITDA, & EBITDAre
|
(1)
| |
Includes the Company’s share from unconsolidated joint ventures, and adjustments for noncontrolling interest, of $2,671 and $2,275 for the three months ended March 31, 2022 and 2021, respectively. Excludes non-real estate-related depreciation and amortization of $325 and $325 for the three months ended March 31, 2022 and 2021. |
|
(2)
| |
Funds from operations is calculated in accordance with the definition of FFO of the National Association of Real Estate Investment Trusts (NAREIT). See “Information About FFO, Core FFO, AFFO, NOI, Adjusted EBITDA & EBITDAre”. |
|
(3)
| |
Includes free rent of $2,201 and $3,725 for the three months ended March 31, 2022 and 2021, respectively. Also includes the Company's share from unconsolidated joint ventures of $(305) and $88 for the three months ended March 31, 2022 and 2021, respectively. |
|
(4)
| |
Excludes expenditures for tenant spaces in properties that have not been owned by the Company for at least a year. |
|
(5)
| |
Net Debt calculated by taking the sum of senior unsecured notes, unsecured revolving credit facility, and mortgages, loans payable and other obligations, and deducting cash and cash equivalents and restricted cash, all at period end. |
|
(6)
| |
Calculated based on weighted average common shares outstanding, assuming redemption of Operating Partnership common units into common shares (8,665 and 8,803 shares for the three months ended March 31, 2022 and 2021, respectively), plus dilutive Common Stock Equivalents (i.e. stock options). |
|
Reconciliation of Net Income (Loss) to NOI
(three months ended)
|
|
$ in thousands (unaudited)
|
|
|
Q1 2022
|
Q4 2021
|
|
|
Multifamily
|
Office / Corp
|
Total
|
Multifamily
|
Office / Corp
|
Total
|
|
Net Income (loss)
|
($11,354)
|
$6,827
|
($4,527)
|
($29,708)
|
$6,471
|
($23,237)
|
|
Deduct:
|
|
|
|
|
|
|
|
Real estate services income
|
(910)
|
–
|
(910)
|
(1,848)
|
–
|
(1,848)
|
|
Interest and other investment loss (income)
|
1
|
157
|
158
|
(3)
|
(5,141)
|
(5,144)
|
|
Equity in (earnings) loss of unconsolidated joint ventures
|
487
|
–
|
487
|
1,420
|
–
|
1,420
|
|
General & Administrative - property level
|
(688)
|
–
|
(688)
|
(2,101)
|
–
|
(2,101)
|
|
Realized and unrealized (gains) losses on disposition
|
–
|
–
|
–
|
–
|
(2,501)
|
(2,501)
|
|
(Gain) loss on disposition of developable land
|
–
|
(2,623)
|
(2,623)
|
–
|
(2,004)
|
(2,004)
|
|
(Gain) loss on sale of investment in unconsolidated joint venture
|
–
|
–
|
–
|
–
|
–
|
–
|
|
(Gain) loss from early extinguishment of debt, net
|
–
|
6,289
|
6,289
|
343
|
–
|
343
|
|
Add:
|
|
|
|
|
|
|
|
Real estate services expenses
|
2,328
|
35
|
2,363
|
2,968
|
51
|
3,019
|
|
General and administrative
|
1,416
|
17,765
|
19,181
|
2,436
|
11,415
|
13,851
|
|
Dead deal and transaction-related costs
|
–
|
–
|
–
|
2,488
|
3,317
|
5,805
|
|
Depreciation and amortization
|
17,403
|
9,110
|
26,513
|
17,276
|
7,932
|
25,208
|
|
Interest expense
|
12,263
|
2,762
|
15,025
|
11,751
|
4,077
|
15,828
|
|
Property impairments
|
–
|
–
|
–
|
7,426
|
–
|
7,426
|
|
Land impairments
|
2,932
|
–
|
2,932
|
12,386
|
–
|
12,386
|
|
Net operating income (NOI)
|
$23,878
|
$40,322
|
$64,200
|
$24,834
|
$23,617
|
$48,451
|
|
|
|
|
|
|
|
|
|
Summary of Consolidated Multifamily NOI by Type (unaudited):
|
|
Q1 2022
|
Q4 2021
|
|
|
Total Consolidated Multifamily - Operating Portfolio
|
|
$24,678
|
$22,747
|
|
|
Total Consolidated Commercial
|
|
660
|
773
|
|
|
|
|
|
|
|
|
|
|
Total NOI from Consolidated Properties (excl. unconsolidated JVs/subordinated interests):
|
25,338
|
23,520
|
|
|
NOI (loss) from services, land/development/repurposing & other assets
|
|
(1,460)
|
1,314
|
|
|
|
|
|
|
|
|
|
|
Total Consolidated Multifamily NOI
|
|
$23,878
|
$24,834
|
|
|
Company Information, Executive Officers & Analysts
|
|
|
|
|
|
|
Company Information
|
|
|
|
|
|
|
|
|
|
Corporate Headquarters
|
Stock Exchange Listing
|
Contact Information
|
|
|
Veris Residential, Inc.
|
New York Stock Exchange
|
Veris Residential, Inc.
|
|
|
Harborside 3, 210 Hudson St., Ste. 400
|
|
Investor Relations Department
|
|
|
Jersey City, New Jersey 07311
|
Trading Symbol
|
Harborside 3, 210 Hudson St., Ste. 400
|
|
|
(732) 590-1010
|
Common Shares: VRE
|
Jersey City, New Jersey 07311
|
|
|
|
|
|
|
|
|
|
Anna Malhari
|
|
|
|
|
Chief Operating Officer
|
|
|
|
|
E-Mail: amalhari@verisresidential.com
|
|
|
|
|
Web: www.verisresidential.com
|
|
|
|
|
|
|
|
|
|
|
|
|
Executive Officers
|
|
|
|
|
|
|
|
|
|
Mahbod Nia
|
Amanda Lombard
|
Taryn Fielder
|
Jeff Turkanis
|
|
Chief Executive Officer
|
Chief Financial Officer
|
General Counsel and Secretary
|
EVP and Chief Investment Officer
|
|
|
|
|
|
|
Anna Malhari
|
Gwen Marnell
|
|
|
|
Chief Operating Officer
|
Chief Accounting Officer
|
|
|
|
|
|
|
|
|
|
|
|
|
|
Equity Research Coverage
|
|
|
|
|
|
|
|
|
|
Bank of America Merrill Lynch
|
Citigroup
|
Green Street Advisors
|
Truist
|
|
James C. Feldman
|
Michael Bilerman
|
John Pawlowski
|
Michael R. Lewis
|
|
|
|
|
|
|
BTIG, LLC
|
Deutsche Bank North America
|
JP Morgan
|
Evercore ISI
|
|
Thomas Catherwood
|
Derek Johnston
|
Anthony Paolone
|
Steve Sakwa
|
|
|
|
|
|
|
Any opinions, estimates, forecasts or predictions regarding Veris Residential, Inc's performance made by these analysts are theirs alone and do not represent opinions, estimates, forecasts or predictions of Veris Residential, Inc. or its management. Veris Residential, Inc. does not by its reference above or distribution imply its endorsement of or concurrence with such opinions, estimates, forecasts or predictions.
|